

Bursts of fungal nanoparticle fragments were detected in ambient air.
Abstract
Aerosol nanoparticles play an important role in the climate system by affecting cloud formation and properties, as well as in human health because of their deep reach into lungs and the circulatory system. Determining nanoparticle sources and composition is a major challenge in assessing their impacts in these areas. The sudden appearance of large numbers of atmospheric nanoparticles is commonly attributed to secondary formation from gas-phase precursors, but in many cases, the evidence for this is equivocal. We report the detection of a mode of fungal fragments with a mobility diameter of roughly 30 nm released in episodic bursts in ambient air over an agricultural area in northern Oklahoma. These events reached concentrations orders of magnitude higher than other reports of biological particles and show similarities to unclarified events reported previously in the Amazon. These particles potentially represent a large source of both cloud-forming ice nuclei and respirable allergens in a variety of ecosystems.
INTRODUCTION
Atmospheric aerosol particles influence cloud formation and properties through their roles as cloud condensation nuclei (CCN) and ice nuclei (IN) and thereby play an important role in controlling the planetary energy budget and therefore Earth’s surface temperature (1). Estimates of cloud radiative forcing depend strongly on IN concentration, which is poorly known (2). IN are thought to be largely composed of primary materials directly emitted from processes on Earth’s surface, including soot, dust, and biological particles, but the relative importance of these components is also uncertain (2–5). Primary biological particles in particular can be excellent IN, but atmospheric concentrations of known biological IN (e.g., pollen and fungal spores) are likely too low to contribute meaningfully to global IN concentrations (6, 7). This observation has led to the investigation of mechanisms by which smaller, more numerous biological materials (e.g., cell fragments or macromolecules) might become aerosolized, for example, by impaction of rain droplets on soils (8). Recent observations in ambient air have linked rain events to increases in atmospheric biological particles and ambient IN concentrations (9, 10).
Aerosols also have important human health impacts that are dependent on particle composition and size. Particles in the smallest size class (ultrafine particles, <100 nm diameter) have been shown to have an incommensurate impact on health with respect to their small mass burden (11). This may be in part explained by their composition and chemical reactivity compared to larger particles, but major factors likely include their efficient transport pathways into and persistence in tissues (11–13). Inhalation of ultrafine aerosol particles has been linked to pulmonary and neurological diseases including asthma and Alzheimer’s disease (11).
Atmospheric aerosol is present in distinct size modes, which depend on the formation and aging processes that formed them. The appearance of large numbers of particles with a sub–50-nm modal diameter is typically attributed to the homogeneous nucleation and growth from gas-phase species, a process commonly termed new particle formation (14–16). We will use the term “nanoparticle” in this manuscript to refer to particles in this size class. This process has been unequivocally demonstrated to be an important aerosol formation mechanism, and the scientific understanding of new particle formation has grown rapidly in recent years (17–19). However, indirect evidence points to the existence of other processes for atmospheric nanoparticle formation. For example, some nanoparticle formation events in marine air have been attributed to the breakup of primary biogenic colloidal gel particles (20), a hypothetical process currently included in no major atmospheric or climate model. During such nanoparticle formation events, the total ambient particle population can be dominated by these small particles, thereby potentially representing a major source of atmospheric CCN. China et al. (9) proposed the osmotically induced bursting of atmospheric fungal spores as the source of sporadic nanoparticle appearance events in the Amazon during the wet season. Such bursting events may represent a major source of IN and respirable allergens. However, for these and most cases, the composition and source of ambient nanoparticles must be inferred owing to the difficulty of direct composition measurements. In particular, it is a challenge to select a measurement approach with sufficient sensitivity, time resolution, molecular specificity, and chemically broad detectability.
RESULTS
We present observations of size-resolved ambient nanoparticle composition conducted at a field station in rural northern Oklahoma from 29 August to 23 September 2016. These measurements were made using the Thermal Desorption Chemical Ionization Mass Spectrometer (TDCIMS) (21–23) at the Department of Energy’s Atmospheric Radiation Measurement (ARM) field site near Lamont, OK. Particles with a diameter of 15 to 45 nm were isolated, collected, and then analyzed in situ using two ionization modes, with a total measurement cycle lasting about 2 hours.
Over the course of 3 weeks of measurements, several events were observed, during which nanoparticle number concentrations increased, and their composition was consistent with fungal fragments, as evidenced by a marked increase in several covarying chemical compounds. These compounds included C6 sugar alcohols and pyrolysis products of chitin. Chitin is a long-chain structural polymer of N-acetylglucosamine that is found in the cell walls of fungi and the exoskeletons of arthropods, analogous to cellulose in plants, which do not produce chitin (24). Major pyrolysis products of chitin include the monomer C8H13NO5, as well the dehydrated products dianhydro-2-acetamido-2-deoxyglucose (C8H11NO4) and trianhydro-2-acetamido-2-deoxyglucose (C8H9NO4), and 3-acetoxypyridine (C7H7NO2) (25). Mass spectral peaks consistent with these formulas were identified in the pyrolytic decomposition of sampled aerosol components. These peaks showed extremely high covariance over the campaign, essentially appearing together as a cluster or not appearing at detectable levels (fig. S1). Fungal cells store a large fraction (as much as 50%) of their carbohydrates as mannitol (26), and this sugar alcohol is used as a fungal aerosol tracer (27). Mannitol or one of its isomers was detected by TDCIMS as a desorbed intact molecule (C6H14O6) in most but not all cases when chitin was detected, with a consistent chitin/mannitol ratio (fig. S7). In some instances, the N-containing chitin breakdown products dominated the mass spectra (fig. S2), but in most cases, mannitol or one of its isomers was the main peak (Fig. 1). These differences may be related to whether the nanoparticle material consisted mostly of the cell cytoplasm or of cell wall materials, or may be related to different types of fungi, which can have different cell wall thicknesses and timing patterns in spore release, affecting atmospheric concentrations (28, 29). Over the 3 weeks of observations, chitin was detected in 96 of 424 samples, or 23% of the time. These composition observations are not consistent with new particle formation from gas-phase precursors, a process reported on previously at this site (30).
Fig. 1. Aerosol size distributions and nanoparticle composition for a characteristic fungal nanoparticle event.
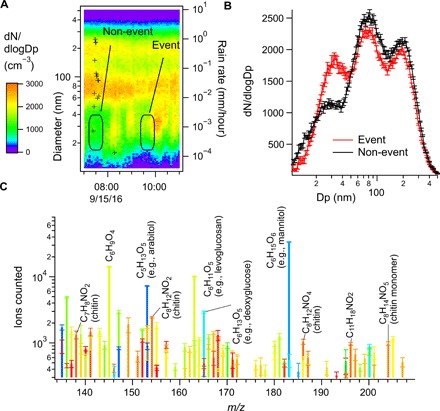
(A) Scanning mobility particle sizer (SMPS) number distribution time series of 10- to 500-nm aerosol on 15 September 2016. The time and particle size over two consecutive positive mode TDCIMS nanoparticle collections are indicated by rounded rectangles. The second collection encompassed a fungal nanoparticle event. Rain rate is indicated by black crosses. (B) Averaged SMPS size distributions over these two periods. (C) Positive ion mode mass spectrum of the composition of particles collected during the event period from (A) and (B). Only detectable peaks are plotted. None of the plotted peaks were detectable during the non-event period. Colors indicate the timing of the peaks during the filament temperature ramp. Orange and red colors indicate the products of the pyrolytic breakdown of larger molecules, including polymers such as chitin. Cooler colors (blue) indicate molecules, which likely desorbed intact. Molecular formulas consistent with chitin pyrolysis products and desorbed sugars are indicated.
The fungal nanoparticle events occurred more frequently during rainy periods, in some cases immediately after a rain event (fig. S3). A cross-correlation analysis between periods of rainfall and detectable chitin signal showed a broad period of positive correlation during and following rainfall, with a maximum correlation about 1.5 days after rainfall (fig. S4). This is consistent with previous observations that show higher atmospheric abundances of fungal spores or other biological particles during rain events and more frequent nanoparticle bursts (9, 10). The apparent delay in rupture is consistent with the finding that the fungal spores rupture only after extended exposure to high relative humidity (~10 hours) followed by drying (9). During a mostly dry period from 2 to 13 September, there were only a few fungal nanoparticle events. China et al. (9) connected the apparent fungal nanoparticle bursts in the Amazon with high nighttime relative humidity. In the present study, relative humidity was closely coupled to rainfall, making it difficult to differentiate the impacts of these two environmental variables.
The nanoparticle formation events were characterized by the appearance of a mode of particles typically centered around 20 to 50 nm (Fig. 2). Distinct from typical regional new particle formation events, these events were sometimes very brief, appearing only for minutes, and they did not include significant numbers of nucleation-mode particles smaller than 15 nm. In a few cases, there was an additional larger mode centered near 70 nm. However, when 20- to 50-nm fungal fragments were detected, on average, there were no enhancements in the concentrations of larger particles (Fig. 2). During periods with the highest levels of nanoparticle fragments, the data suggest a small depletion in the numbers of 70- to 300-nm particles (Fig. 2). These larger particles may be the parent material for the nanoparticle fragments, although we cannot exclude the possibility that the particles are generated from a process occurring at the land surface. The fact that the 20- to 50-nm fragments do not regularly appear alongside larger particles suggests that they are not aerosolized by the same process. This is consistent with the suspected fungal nanoparticle bursts in the Amazon, which were also unaccompanied by larger particles (up to the 500-nm limit of the size measurement) (9). Soil-derived organic particles directly injected into the atmosphere by rain impaction at the ARM site have a much larger characteristic size (about 0.5 μm) (31). If rain impaction at the surface directly drove the fungal nanoparticles into the atmosphere, we would expect a simultaneous increase in number over a wider range of sizes. That this did not occur means the fungal nanoparticles were usually released either as a result of atmospheric processing of larger ejected particles or by another process at the land surface. The broad time scale over which chitin correlated with rain suggests the importance of some post-rain process, possibly fungal spore germination and/or chemically or osmostically induced bursting (32–35).
Fig. 2. The time series of ambient size-resolved aerosol number concentration separated into periods when nanoparticle chitin was detected and when it was not.
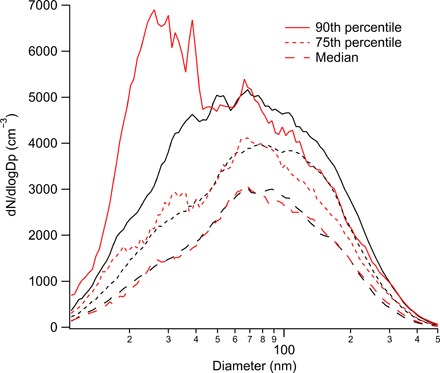
The statistical distributions of each size bin for the chitin (red traces) and nonchitin (black traces) are plotted here. Periods of detectable chitin sometimes included enhancements in sub–100-nm particle concentrations alongside lower levels of 100- to 300-nm particles, compared with the periods with no detectable nanoparticle chitin.
DISCUSSION
The mean concentration of new fungus fragment nanoparticles (size, 10 to 100 nm) generated during these events is 455 cm−3, with most (400 cm−3) below 40 nm, based on the concentration difference between identified fungus nanoparticle periods and nonfungus nanoparticle periods. This is about three orders of magnitude more abundant than “high” levels of fluorescent biological particles detected in rain events in a North American forest (1-μm-diameter lower cutoff) (10). In that study, IN concentrations at −25°C were tightly correlated with biological particle concentration during rain events. IN concentrations were roughly one-third of the biological particle concentrations and reached a maximum of about 0.2 cm−3. During dry periods, IN concentrations averaged about 0.004 cm−3. While it is not reasonable in general to assume that every biological atmospheric particle is an effective ice nucleus, the tight coupling (r2 = 0.88) between rain-event biological particle concentration and IN concentration in the forest study suggests that it is very likely that the post-rain fungal nanoparticles detected in the present study can serve as IN. Assuming that one-third of these fungal nanoparticles were IN, we would estimate a 30-min average nanoparticle IN concentration during events of 150 cm−3. This would be much higher than essentially any other reports of IN concentration, by two to three orders of magnitude (2, 36, 37). This is cause for caution, but there are at least a few possible reasons for this apparent discrepancy. One is that these fungal nanoparticles are, on average, simply much less efficient IN than larger biological IN. Perhaps the IN-relevant compounds are relegated to only a small fraction of the fragmented spores, or they are not present in the fungal species from which these numerous nanoparticles originated.
However, another possible explanation is that most studies of IN neglect particles smaller than 100 nm. Sub–100-nm particles are excluded from essentially all size-resolved IN concentration analyses (4, 10, 37), and instrumental efficiencies for detecting sub–100-nm IN are not typically assessed in measurements of total IN concentration (38, 39). In the case of the U.S. forest study (10), which is perhaps the study that best links biological particles to IN, particles smaller than about 0.5 μm were effectively excluded from consideration by using an aerosol concentrator, which optimizes the transmission of >1-μm aerosol at the cost of smaller particles (10, 39, 40). Similarly, other methods of IN measurement and sizing become challenging at sizes below 100 nm (41). IN concentrations were measured during a previous study at the ARM Southern Great Plains site and showed large variability, which was attributed to rain events (42). In at least one instance, IN concentrations increased markedly concomitant with a nanoparticle number increase similar to those in the present study (fig. S6). The sub–100-nm particles would have been counted inefficiently given the use of the aerosol concentrator, so while it is unclear whether some fraction of the detected IN were nanoparticles, on at least some occasions, IN appear alongside nanoparticles. We consider it possible that many studies significantly underestimate IN concentrations by missing these smaller particles and that biological IN represent a major IN source despite the low concentration of supermicron biological particles. This hypothesis is consistent with findings that show that the active IN components of biological particles may be physically small, on the scale of macromolecules (8, 43–45).
Fungal spores are known to be associated with adverse respiratory impacts, particularly asthma, and these fungal health impacts are understood to be related to rainy or humid conditions (46–49). Ruptured airborne pollen is recognized as a likely source of respirable allergens (50), and recent work has shown that fungal spores can also rupture and thereby become more easily respired (9, 51, 52). Because of the facility with which aerosol nanoparticles can reach deep into the lungs and even across membranes into the bloodstream (11), it seems likely that fungal aerosol nanoparticles could be a significant but underappreciated contributing factor to the negative health impacts of fungal spores.
The identification of a roughly 30-nm mode of fungal aerosol supports the idea that some atmospheric nanoparticle formation events involve mainly primary materials, rather than forming from condensation of low-volatility gases or reactive uptake. Whether there are other instances of similar processes with different starting materials remains to be seen. In the case of terrestrial fungal nanoparticles, the large numbers of sub–50-nm particles generated in these events are likely a large, but episodic, source of IN in diverse environmental settings from the Amazon to North American agricultural fields. Similarly, they may be a major source of health-impacting respirable allergens. In both areas, these small particles may have greater impacts than the intact fungal spores, which up to now have been more readily measured and characterized.
MATERIALS AND METHODS
Data sources
Rain rate, relative humidity, and aerosol size distribution data from 2016 are courtesy of the ARM user facility database (53–55). Rain rate was measured on a 1-min basis by a video disdrometer. Aerosol size distributions were measured by a scanning mobility particle sizer (SMPS) over a 10- to 475-nm mobility diameter range (models 3081 and 3775, TSI Inc.) with 5-min time resolution.
TDCIMS analytical cycle
Size-selective sampling was accomplished by charging and mobility-selecting the particles and then electrostatically collecting them onto a Pt filament (56). The analysis consists of thermal desorption and/or pyrolysis of the particle phase components in a clean N2-filled ionization region by incremental heating of the collection filament from ambient temperature to more than 900 K. The volatilized molecules were detected by atmospheric pressure chemical ionization mass spectrometry using a high-resolution time-of-flight mass spectrometer (model HTOF, Tofwerk AG), alternating between positive ion (H3O+) and negative ion (O2−) ionization. An assessment of the background signal, generated by gas-phase adsorption onto the wire, was made before or after every collection by sampling normally but with no collection high voltage applied to the filament. The sampled particle sizes were assessed using an SMPS located downstream of the TDCIMS filament (TSI 2085, custom flow and high-voltage controls).
Supplementary Material
Acknowledgments
Funding: We acknowledge support from the Atmospheric Radiation Measurement (ARM) Climate Research Facility, a user facility of the United States Department of Energy, Office of Science, sponsored by the Office of Biological and Environmental Research, and support from the Atmospheric System Research (DE-SC0014469 and DE-SC0019000) program of that office. Author contributions: J.N.S. initiated the research. M.J.L. and D.C.D. made the observations. M.J.L. analyzed the data, created the figures, and wrote the paper. J.N.S. and D.C.D. provided edits and comments on the paper. Competing interests: The authors declare that they have no competing interests. Data and materials availability: All data needed to evaluate the conclusions in the paper are present in the paper and/or the Supplementary Materials. Additional data related to this paper may be downloaded at www.arm.gov/research/campaigns/aaf2016hiscale or requested from the authors.
SUPPLEMENTARY MATERIALS
Supplementary material for this article is available at http://advances.sciencemag.org/cgi/content/full/6/3/eaax9051/DC1
Fig. S1. Partial time series of selected detected ions in positive mode from ambient nanoparticles sampled over agricultural land in northern Oklahoma.
Fig. S2. Characteristic positive ion mass spectra for nanoparticles sampled during the study.
Fig. S3. Time series of chitin monomer detected in positive (red trace) and negative (blue trace) ion modes from ambient nanoparticles.
Fig. S4. Linear correlation plot comparing rainfall and TDCIMS chitin signal.
Fig. S5. TDCIMS desorption thermograms for individual high-resolution fitted positive ions for the event collection period on 15 September and the positive non-event collection preceding it (Fig. 1).
Fig. S6. Aerosol size distributions and IN concentrations measured in a previous study at the same site during a high IN event.
Fig. S7. Integrated ion counts for the chitin monomer (C8H14NO5+) plotted against integrated ion counts for C6H15O6+ (mannitol isomer) detected in ~20- to 50-nm particles by TDCIMS in positive ion mode.
REFERENCES AND NOTES
- 1.T. F. Stocker, D. Qin, G.-K. Plattner, M. Tignor, S. K. Allen, J. Boschung, A. Nauels, Y. Xia, V. Bex, P. M. Midgley, IPCC, 2013: Climate Change 2013: The Physical Science Basis, Contribution of Working Group I to the Fifth Assessment Report of the Intergovernmental Panel on Climate Change (2013).
- 2.DeMott P. J., Prenni A. J., Liu X., Kreidenweis S. M., Petters M. D., Twohy C. H., Richardson M. S., Eidhammer T., Rogers D. C., Predicting global atmospheric ice nuclei distributions and their impacts on climate. Proc. Natl. Acad. Sci. U.S.A. 107, 11217–11222 (2010). [DOI] [PMC free article] [PubMed] [Google Scholar]
- 3.Prenni A. J., Petters M. D., Kreidenweis S. M., Heald C. L., Martin S. T., Artaxo P., Garland R. M., Wollny A. G., Pöschl U., Relative roles of biogenic emissions and Saharan dust as ice nuclei in the Amazon basin. Nat. Geosci. 2, 402–405 (2009). [Google Scholar]
- 4.Hader J. D., Wright T. P., Petters M. D., Contribution of pollen to atmospheric ice nuclei concentrations. Atmos. Chem. Phys. 14, 5433–5449 (2014). [Google Scholar]
- 5.Pratt K. A., DeMott P. J., French J. R., Wang Z., Westphal D. L., Heymsfield A. J., Twohy C. H., Prenni A. J., Prather K. A., In situ detection of biological particles in cloud ice-crystals. Nat. Geosci. 2, 398–401 (2009). [Google Scholar]
- 6.Hoose C., Kristjánsson J. E., Burrows S. M., How important is biological ice nucleation in clouds on a global scale? Environ. Res. Lett. 5, 024009 (2010). [Google Scholar]
- 7.Spracklen D. V., Heald C. L., The contribution of fungal spores and bacteria to regional and global aerosol number and ice nucleation immersion freezing rates. Atmos. Chem. Phys. 14, 9051–9059 (2014). [Google Scholar]
- 8.O’Sullivan D., Murray B. J., Ross J. F., Whale T. F., Price H. C., Atkinson J. D., Umo N. S., Webb M. E., The relevance of nanoscale biological fragments for ice nucleation in clouds. Sci. Rep. 5, 8082 (2015). [DOI] [PMC free article] [PubMed] [Google Scholar]
- 9.China S., Wang B., Weis J., Rizzo L., Brito J., Cirino G. G., Kovarik L., Artaxo P., Gilles M. K., Laskin A., Rupturing of biological spores as a source of secondary particles in Amazonia. Environ. Sci. Technol. 50, 12179–12186 (2016). [DOI] [PubMed] [Google Scholar]
- 10.Huffman J. A., Prenni A. J., DeMott P. J., Pöhlker C., Mason R. H., Robinson N. H., Fröhlich-Nowoisky J., Tobo Y., Després V. R., Garcia E., Gochis D. J., Harris E., Müller-Germann I., Ruzene C., Schmer B., Sinha B., Day D. A., Andreae M. O., Jimenez J. L., Gallagher M., Kreidenweis S. M., Bertram A. K., Pöschl U., High concentrations of biological aerosol particles and ice nuclei during and after rain. Atmos. Chem. Phys. 13, 6151–6164 (2013). [Google Scholar]
- 11.Buzea C., Blandino I. I. P., Robbie K., Nanomaterials and nanoparticles: Sources and toxicity. Biointerphases 2, MR17–MR71 (2007). [DOI] [PubMed] [Google Scholar]
- 12.Oberdörster G., Ferin J., Lehnert B. E., Correlation between particle size, in vivo particle persistence, and lung injury. Environ. Health Perspect. 102, 173–179 (1994). [DOI] [PMC free article] [PubMed] [Google Scholar]
- 13.Kreyling W. G., Semmler-Behnke M., Möller W., Ultrafine particle-lung interactions: Does size matter? J. Aerosol Med. 19, 74–83 (2006). [DOI] [PubMed] [Google Scholar]
- 14.Kulmala M., Vehkamäki H., Petäjä T., Dal Maso M., Lauri A., Kerminen V.-M., Birmili W., McMurry P. H., Formation and growth rates of ultrafine atmospheric particles: A review of observations. J. Aerosol Sci. 35, 143–176 (2004). [Google Scholar]
- 15.Dall’Osto M., Beddows D. C. S., Tunved P., Krejci R., Ström J., Hansson H.-C., Yoon Y. J., Park K.-T., Becagli S., Udisti R., Onasch T., O'Dowd C. D., Simó R., Harrison R. M., Arctic sea ice melt leads to atmospheric new particle formation. Sci. Rep. 3318 (2017). [DOI] [PMC free article] [PubMed] [Google Scholar]
- 16.O’Dowd C., Monahan C., Dall’Osto M., On the occurrence of open ocean particle production and growth events. Geophys. Res. Lett. 37, L19805 (2010). [Google Scholar]
- 17.Lehtipalo K., Yan C., Dada L., Bianchi F., Xiao M., Wagner R., Stolzenburg D., Ahonen L. R., Amorim A., Baccarini A., Bauer P. S., Baumgartner B., Bergen A., Bernhammer A.-K., Breitenlechner M., Brilke S., Buchholz A., Mazon S. B., Chen D., Chen X., Dias A., Dommen J., Draper D. C., Duplissy J., Ehn M., Finkenzeller H., Fischer L., Frege C., Fuchs C., Garmash O., Gordon H., Hakala J., He X., Heikkinen L., Heinritzi M., Helm J. C., Hofbauer V., Hoyle C. R., Jokinen T., Kangasluoma J., Kerminen V.-M., Kim C., Kirkby J., Kontkanen J., Kürten A., Lawler M. J., Mai H., Mathot S., Mauldin R. L. III, Molteni U., Nichman L., Nie W., Nieminen T., Ojdanic A., Onnela A., Passananti M., Petäjä T., Piel F., Pospisilova V., Quéléver L. L. J., Rissanen M. P., Rose C., Sarnela N., Schallhart S., Schuchmann S., Sengupta K., Simon M., Sipilä M., Tauber C., Tomé A., Tröstl J., Väisänen O., Vogel A. L., Volkamer R., Wagner A. C., Wang M., Weitz L., Wimmer D., Ye P., Ylisirniö A., Zha Q., Carslaw K. S., Curtius J., Donahue N. M., Flagan R. C., Hansel A., Riipinen I., Virtanen A., Winkler P. M., Baltensperger U., Kulmala M., Worsnop D. R., Multicomponent new particle formation from sulfuric acid, ammonia, and biogenic vapors. Sci. Adv. 4, eaau5363 (2018). [DOI] [PMC free article] [PubMed] [Google Scholar]
- 18.Kulmala M., Kontkanen J., Junninen H., Lehtipalo K., Manninen H. E., Nieminen T., Petäjä T., Sipilä M., Schobesberger S., Rantala P., Franchin A., Jokinen T., Järvinen E., Äijälä M., Kangasluoma J., Hakala J., Aalto P. P., Paasonen P., Mikkilä J., Vanhanen J., Aalto J., Hakola H., Makkonen U., Ruuskanen T., Mauldin R. L. III, Duplissy J., Vehkamäki H., Bäck J., Kortelainen A., Riipinen I., Kurtén T., Johnston M. V., Smith J. N., Ehn M., Mentel T. F., Lehtinen K. E. J., Laaksonen A., Kerminen V.-M., Worsnop D. R., Direct observations of atmospheric aerosol nucleation. Science 339, 943–946 (2013). [DOI] [PubMed] [Google Scholar]
- 19.Kuang C., McMurry P. H., McCormick A. V., Eisele F. L., Dependence of nucleation rates on sulfuric acid vapor concentration in diverse atmospheric locations. J. Geophys. Res. 113, D10209 (2008). [Google Scholar]
- 20.Karl M., Leck C., Coz E., Heintzenberg J., Marine nanogels as a source of atmospheric nanoparticles in the high Arctic. Geophys. Res. Lett. 40, 3738–3743 (2013). [Google Scholar]
- 21.Voisin D., Smith J. N., Sakurai H., McMurry P. H., Eisele F. L., Thermal desorption chemical ionization mass spectrometer for ultrafine particle chemical composition. Aerosol Sci. Tech. 37, 471–475 (2003). [Google Scholar]
- 22.Smith J. N., Rathbone G. J., Carboxylic acid characterization in nanoparticles by thermal desorption chemical ionization mass spectrometry. Int. J. Mass Spectrom. 274, 8–13 (2008). [Google Scholar]
- 23.Lawler M. J., Rissanen M. P., Ehn M., Mauldin R. L. III, Sarnela N., Sipilä M., Smith J. N., Evidence for diverse biogeochemical drivers of boreal forest new particle formation. Geophys. Res. Lett. 45, 2038–2046 (2018). [Google Scholar]
- 24.S. Tokura, H. Tamura, Chitin and chitosan, in Comprehensive Glycoscience (Elsevier Ltd., 2007), pp. 449–475. [Google Scholar]
- 25.S. C. Moldoveanu, Analytical Pyrolysis of Natural Organic Polymers (Elsevier Science, 1998). [Google Scholar]
- 26.Solomon P. S., Waters O. D. C., Oliver R. P., Decoding the mannitol enigma in filamentous fungi. Trends Microbiol. 15, 257–262 (2007). [DOI] [PubMed] [Google Scholar]
- 27.Nirmalkar J., Deb M. K., Tsai Y. I., Deshmukh D. K., Arabitol and mannitol as tracer for fungal contribution to size-differentiated particulate matter of rural atmospheric aerosols. Int. J. Environ. Sci. Dev. 6, 460–463 (2015). [Google Scholar]
- 28.Bell-Pedersen D., Garceau N., Loros J. J., Circadian rhythms in fungi. J. Genet. 75, 387–401 (1996). [Google Scholar]
- 29.Huffman J. A., Sinha B., Garland R. M., Snee-Pollmann A., Gunthe S. S., Artaxo P., Martin S. T., Andreae M. O., Pöschl U., Size distributions and temporal variations of biological aerosol particles in the Amazon rainforest characterized by microscopy and real-time UV-APS fluorescence techniques during AMAZE-08. Atmos. Chem. Phys. 12, 11997–12019 (2012). [Google Scholar]
- 30.Hodshire A. L., Lawler M. J., Zhao J., Ortega J., Jen C., Yli-Juuti T., Brewer J. F., Kodros J. K., Barsanti K. C., Hanson D. R., McMurry P. H., Smith J. N., Pierce J. R., Multiple new-particle growth pathways observed at the US DOE Southern Great Plains field site. Atmos. Chem. Phys. 16, 9321–9348 (2016). [Google Scholar]
- 31.Wang B., Harder T. H., Kelly S. T., Piens D. S., China S., Kovarik L., Keiluweit M., Arey B. W., Gilles M. K., Laskin A., Airborne soil organic particles generated by precipitation. Nat. Geosci. 9, 433–437 (2016). [Google Scholar]
- 32.Bosch A., Maronna R. A., Yantorno O. M., A simple descriptive model of filamentous fungi spore germination. Process Biochem. 30, 599–606 (1995). [Google Scholar]
- 33.Peleg M., Normand M. D., Modeling of fungal and bacterial spore germination under static and dynamic conditions. Appl. Environ. Microbiol. 79, 6765–6775 (2013). [DOI] [PMC free article] [PubMed] [Google Scholar]
- 34.Dow J. M., Rubery P. H., Hyphal tip bursting in Mucor rouxii: Antagonistic effects of calcium ions and acid. J. Gen. Microbiol. 91, 425–428 (1975). [DOI] [PubMed] [Google Scholar]
- 35.Bartnicki-Garcia S., Lippman E., The bursting tendency of hyphal tips of fungi: Presumptive evidence for a delicate balance between wall synthesis and wall lysis in apical growth. J. Gen. Microbiol. 73, 487–500 (1972). [Google Scholar]
- 36.Rogers D. C., DeMott P. J., Kreidenweis S. M., Chen Y., Measurements of ice nucleating aerosols during SUCCESS. Geophys. Res. Lett. 25, 1383–1386 (1998). [Google Scholar]
- 37.Mason R. H., Si M., Chou C., Irish V. E., Dickie R., Elizondo P., Wong R., Brintnell M., Elsasser M., Lassar W. M., Pierce K. M., Leaitch W. R., MacDonald A. M., Platt A., Toom-Sauntry D., Sarda-Estève R., Schiller C. L., Suski K. J., Hill T. C. J., Abbatt J. P. D., Huffman J. A., DeMott P. J., Bertram A. K., Size-resolved measurements of ice-nucleating particles at six locations in North America and one in Europe. Atmos. Chem. Phys. 16, 1637–1651 (2016). [Google Scholar]
- 38.Rogers D. C., Demott P. J., Kreidenweis S. M., Chen Y., A continuous-flow diffusion chamber for airborne measurements of ice nuclei. J. Atmos. Oceanic Tech. 18, 725–741 (2001). [Google Scholar]
- 39.Tobo Y., Prenni A. J., DeMott P. J., Huffman J. A., McCluskey C. S., Tian G., Pöhlker C., Pöschl U., Kreidenweis S. M., Biological aerosol particles as a key determinant of ice nuclei populations in a forest ecosystem. J. Geophys. Res. Atmos. 118, 10,100–10,110 (2013). [Google Scholar]
- 40.Romay F. J., Roberts D. L., Marple V. A., Liu B. Y. H., Olson B. A., A high-performance aerosol concentrator for biological agent detection. Aerosol Sci. Tech. 36, 217–226 (2002). [Google Scholar]
- 41.Kreidenweis S. M., Chen Y., Rogers D. C., Demott P. J., Isolating and identifying atmospheric ice-nucleating aerosols: A new technique. Atmos. Res. 46, 263–278 (1998). [Google Scholar]
- 42.P. J. DeMott, T. C. J. Hill, K. J. Suski, E. J. T. Levin, Southern Great Plains Ice Nuclei Characterization Experiment Final Campaign Summary (2015); https://www.arm.gov/research/campaigns/sgp2014ince.
- 43.Pummer B. G., Bauer H., Bernardi J., Bleicher S., Grothe H., Suspendable macromolecules are responsible for ice nucleation activity of birch and conifer pollen. Atmos. Chem. Phys. 12, 2541–2550 (2012). [Google Scholar]
- 44.Augustin S., Wex H., Niedermeier D., Pummer B., Grothe H., Hartmann S., Tomsche L., Clauss T., Voigtländer J., Ignatius K., Stratmann F., Immersion freezing of birch pollen washing water. Atmos. Chem. Phys. 13, 10989–11003 (2013). [Google Scholar]
- 45.Dreischmeier K., Budke C., Wiehemeier L., Kottke T., Koop T., Boreal pollen contain ice-nucleating as well as ice-binding ‘antifreeze’ polysaccharides. Sci. Rep. 7, 41890 (2017). [DOI] [PMC free article] [PubMed] [Google Scholar]
- 46.Khot A., Burn R., Evans N., Lenney W., Storr J., Biometeorological triggers in childhood asthma. Clin. Allergy 18, 351–359 (1988). [DOI] [PubMed] [Google Scholar]
- 47.Cecchi L., D’Amato G., Ayres J. G., Galan C., Forastiere F., Forsberg B., Gerritsen J., Nunes C., Behrendt H., Akdis C., Dahl R., Annesi-Maesano I., Projections of the effects of climate change on allergic asthma: The contribution of aerobiology. Allergy 65, 1073–1081 (2010). [DOI] [PubMed] [Google Scholar]
- 48.Dales R. E., Cakmak S., Judek S., Dann T., Coates F., Brook J. R., Burnett R. T., The role of fungal spores in thunderstorm asthma. Chest 123, 745–750 (2003). [DOI] [PubMed] [Google Scholar]
- 49.Fröhlich-Nowoisky J., Kampf C. J., Weber B., Huffman J. A., Pöhlker C., Andreae M. O., Lang-Yona N., Burrows S. M., Gunthe S. S., Elbert W., Su H., Hoor P., Thines E., Hoffmann T., Després V. R., Pöschl U., Bioaerosols in the Earth system: Climate, health, and ecosystem interactions. Atmos. Res. 182, 346–376 (2016). [Google Scholar]
- 50.Suphioglu C., Singh M. B., Taylor P., Knox R. B., Bellomo R., Holmes P., Puy R., Mechanism of grass-pollen-induced asthma. Lancet 339, 569–572 (1992). [DOI] [PubMed] [Google Scholar]
- 51.Laskin A., Gilles M. K., Knopf D. A., Wang B., China S., Progress in the analysis of complex atmospheric particles. Annu. Rev. Anal. Chem. 9, 117–143 (2016). [DOI] [PubMed] [Google Scholar]
- 52.Cho S.-H., Seo S.-C., Schmechel D., Grinshpun S. A., Reponen T., Aerodynamic characteristics and respiratory deposition of fungal fragments. Atmos. Environ. 39, 5454–5465 (2005). [Google Scholar]
- 53.ARM user facility. 2016, SMPS particle size distribution, Aug-Sept 2016, 36° 36′ 18.0″ N, 97° 29′ 6.0″ W: Southern Great Plains Central Facility (C1). Compiled by Jiumeng Liu, John Shilling, and Chongai Kuang.
- 54.ARM user facility. 2016, rain rate from video disdrometer, Aug-Sept 2016, 36° 36′ 18.0″ N, 97° 29′ 6.0″ W: Southern Great Plains Central Facility (C1); doi: 10.5439/1025315. [DOI]
- 55.ARM user facility. 2016, relative humidity, Aug-Sept 2016, 36° 36′ 18.0″ N, 97° 29′ 6.0″ W: Southern Great Plains Central Facility (C1); doi: 10.5439/1025220. [DOI]
- 56.McMurry P., Ghimire A., Ahn H.-K., Sakurai H., Moore K., Stolzenburg M., Smith J. N., Sampling nanoparticles for chemical analysis by low resolution electrical mobility classification. Environ. Sci. Technol. 43, 4653–4658 (2009). [DOI] [PubMed] [Google Scholar]
- 57.ARM user facility. 2014, ice nuclei concentrations from continuous flow diffusion chamber, April–June 2014, Paul DeMott, Kaitlyn Suski, and Ezra Levin, 36° 36′ 18.0″ N, 97° 29′ 6.0″ W: Southern Great Plains Central Facility (C1).
- 58.ARM user facility. 2014, aerosol size distributions from tandem differential mobility analyzer and aerosol particle sizer, April to June 2014, 36° 36′ 18.0″ N, 97° 29′ 6.0″ W: Southern Great Plains Central Facility (C1); doi: 10.5439/1150275. [DOI]
Associated Data
This section collects any data citations, data availability statements, or supplementary materials included in this article.
Supplementary Materials
Supplementary material for this article is available at http://advances.sciencemag.org/cgi/content/full/6/3/eaax9051/DC1
Fig. S1. Partial time series of selected detected ions in positive mode from ambient nanoparticles sampled over agricultural land in northern Oklahoma.
Fig. S2. Characteristic positive ion mass spectra for nanoparticles sampled during the study.
Fig. S3. Time series of chitin monomer detected in positive (red trace) and negative (blue trace) ion modes from ambient nanoparticles.
Fig. S4. Linear correlation plot comparing rainfall and TDCIMS chitin signal.
Fig. S5. TDCIMS desorption thermograms for individual high-resolution fitted positive ions for the event collection period on 15 September and the positive non-event collection preceding it (Fig. 1).
Fig. S6. Aerosol size distributions and IN concentrations measured in a previous study at the same site during a high IN event.
Fig. S7. Integrated ion counts for the chitin monomer (C8H14NO5+) plotted against integrated ion counts for C6H15O6+ (mannitol isomer) detected in ~20- to 50-nm particles by TDCIMS in positive ion mode.