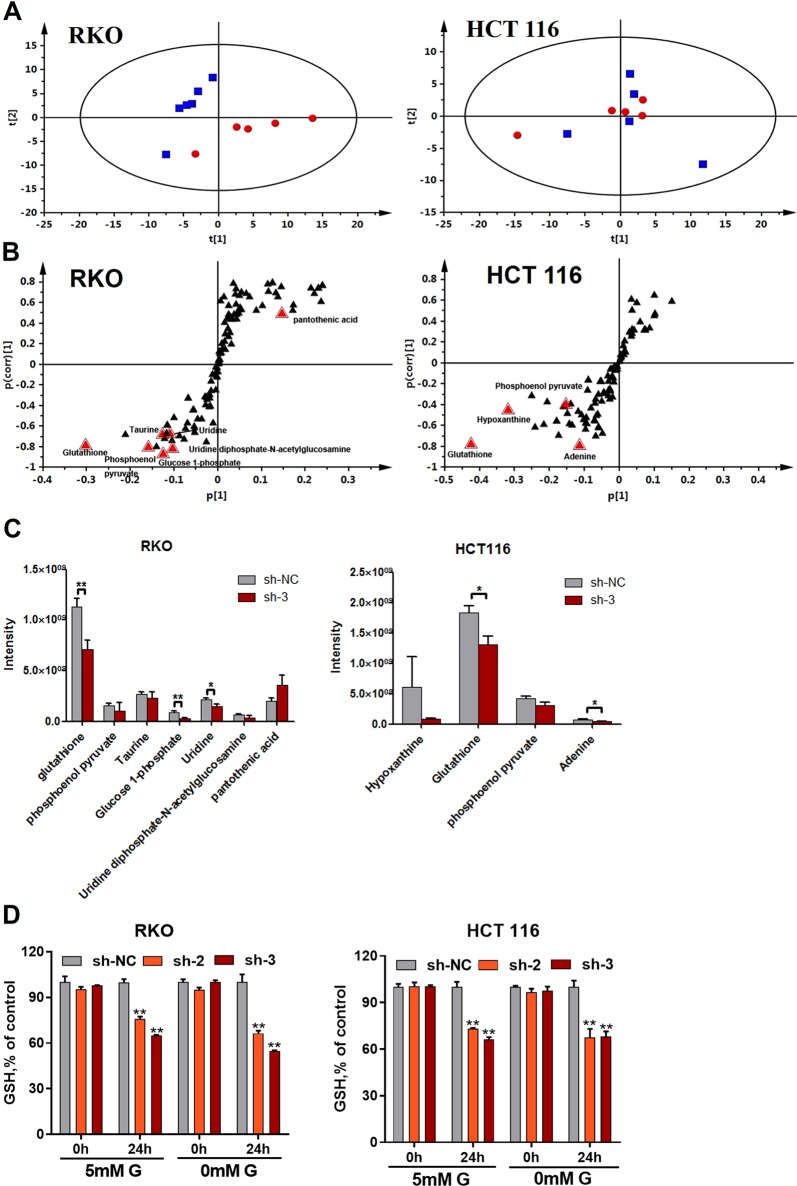
Fig. 3.
Expression of AMPKα1 maintains cellular glutathione levels. a Scatter plot of scores from the PCA analysis of RKO and HCT116 cells expressing control-shRNA (sh-NC, blue boxes) or #3-shRNA (sh-3, red dots) under the negative ionization mode. b S-plot of OPLS-DA analysis of RKO and HCT116 cells expressing control-shRNA (sh-NC) or #3-shRNA (sh-3). c Relative cellular abundance of metabolites was different in RKO and HCT116 cells expressing control-shRNA (sh-NC) or #3-shRNA (sh-3). d Identification of cellular GSH depletion in RKO and HCT116 cells expressing control-shRNA (sh-NC) or #3-shRNA (sh-3) incubated in 5 mM glucose or glucose-free medium. Data are presented as the mean ± SD (n = 6). *P < 0.05, **P < 0.01, Student’s t-test

