

Abstract
Pregnancies complicated by obesity and/or gestational diabetes (GDM) are associated with peripheral insulin resistance; however, the insulin responsiveness of the placenta in these pregnancy complications remains largely unknown. We tested the hypothesis that primary human trophoblast cells and placental villous explants will be insulin responsive, characterized by amino acid transport, Akt and Erk activity with maternal obesity, and/or GDM. We evaluated term placentas from women with normal body mass index (BMI) (normal; n = 15), obesity (OB; n = 11), normal BMI with GDM (N-GDM; n = 11), and obesity with GDM (OB-GDM; n = 11). In a subgroup, primary human trophoblast cells (PHT) were isolated, and in an independent subgroup placental villous explants were exposed to varying concentrations of insulin. Amino acid transport capacity and insulin signaling activity were determined. Insulin significantly increased amino acid transport activity to a similar degree in PHT cells isolated from normal (+21%), N-GDM (+38%), OB (+37%), and OB-GDM (+35%) pregnancies. Insulin increased Akt and Erk phosphorylation in PHT cells (3-fold) and in villous explants (2-fold) in all groups to a similar degree. In contrast to the peripheral maternal insulin resistance commonly associated with obesity and/or GDM, we found that the placenta is insulin sensitive in these pregnancy complications. We suggest that elevated maternal insulin levels in pregnancies complicated by obesity and/or GDM promote critical placental functions, including amino acid transport. Insulin-stimulated placental nutrient delivery may contribute to the increased risk of fetal overgrowth and adiposity in these pregnancies. Moreover, our findings may inform efforts to optimize insulin regimens for women with GDM.
Keywords: human, insulin sensitivity, placental transport, pregnancy, syncytiotrophoblast
INTRODUCTION
Maternal insulin sensitivity declines as pregnancy progresses, favoring the allocation of nutrients for placental transfer to meet the needs of fetal growth and development. In healthy pregnancies, normoglycemia is maintained by adaptive pancreatic β-cell hyperplasia, resulting in maternal hyperinsulinema (8). Gestational diabetes mellitus (GDM) is defined as abnormal blood glucose levels recognized in the second trimester of pregnancy (52). GDM develops in women with more pronounced peripheral insulin resistance and failure of the β-cells to fully compensate by increasing insulin secretion (11). The incidence of GDM in the US is ∼9% (19) but ranges from 1 to 22% around the world, depending on the population studied or diagnostic criteria used (28). The number of pregnant women developing GDM is increasing due to the worldwide obesity epidemic (25, 32). GDM constitutes a major public health problem because of the range of maternal and infant morbidities associated with the disease. For example, both GDM mothers and their infants have increased risk of developing obesity, cardiovascular disease, and diabetes later in life (14, 18, 59).
Maternal obesity and/or GDM are associated with an increased risk of fetal overgrowth (13, 72) and/or increased adiposity at birth (30, 64). Fetal growth and development are dependent on maternal nutrient supply and placental functions such as hormone secretion, protein synthesis, and nutrient transport capacity. Fetal overgrowth has been associated with increased placental nutrient transport capacity in obese women (46) and in women with GDM (10, 37, 39). Similarly, placental glucose and amino acid transport has been reported to be activated in mouse models of maternal obesity with fetal overgrowth (7, 63), and normalization of placental transport by maternal infusion of adiponectin prevented both fetal overgrowth (7) and the development of obesity and insulin resistance in the offspring (60). Collectively, these observations suggest that altered placental nutrient transport capacity contributes to adverse pregnancy outcomes in maternal obesity and GDM.
Placental nutrient transport is regulated by an array of metabolic hormones (46). In this context, insulin may be of particular importance given the well-established stimulatory effect of this hormone on trophoblast amino acid transport (33, 42). Although placenta is not a classically insulin-sensitive organ, we have previously shown a 1.5- to twofold increase in amino acid transport and Akt phosphorylation in response to physiological doses of insulin (5). Additionally, activation of the placental insulin/phosphoinositide 3 kinase (PI3K)/Akt/mammalian target of rapamycin (mTOR) signaling pathway has been reported in obese women delivering large babies (35). Maternal adiponectin, typically decreased in the circulation of obese and GDM mothers, has been found to inhibit placental insulin signaling (4, 41). Thus, it is possible that maternal hyperinsulimemia and activation of placental insulin signaling promote nutrient delivery to the fetus in maternal obesity and GDM, thereby increasing the risk of fetal overgrowth.
Pregnancies complicated by obesity and/or GDM are associated with peripheral insulin resistance (12). Although it has been proposed that the placenta is more insulin resistant in these conditions (48), there is little experimental evidence to support this conclusion. We tested the hypothesis that primary human trophoblast cells and placental villous explants are insulin responsive, characterized by system A amino acid transport, Akt and Erk signaling pathway activity in pregnancies complicated by maternal obesity, and/or GDM.
MATERIALS AND METHODS
Tissue collection.
Placental tissue was collected after informed, written consent was obtained. Tissue and relevant clinical data were added to a biorepository for use in multiple studies, and the protocol was approved by the Colorado Multiple Institutional Review Board (COMIRB-14-1073). After term delivery, de-identified placental tissue from a total of 48 women with varying body mass index (BMI; range: 22.0–33.5 kg/m2) based on pregravid or early gestation weight and with uncomplicated pregnancies (n = 26) or pregnancies complicated by GDM (n = 22) were included. GDM was diagnosed by the two-step method using the American College of Obstetricians and Gynecologists criteria (9, 17). Participants were subgrouped as normal (normal women with normal pregestational BMI, 18.5–24.9 kg/m2; n = 15), obese (OB; BMI ≥ 30 kg/m2; n = 11), normal BMI with GDM (N-GDM; n = 11), or obese with GDM (OB-GDM; n = 11). Exclusion criteria included twin/triplet pregnancies, pre-existing diabetes, hypertensive and cardiovascular disease, chorioamnionitis, smoking, recreational drug use, and fetal malformations. The clinical characteristics of the study participants are presented (Table 1).
Table 1.
Clinical characteristics of study participants
| Normal (n = 15) | N-GDM (n = 11) | Obese (n = 11) | OB-GDM (n = 11) |
P Value (ANOVA) |
|
|---|---|---|---|---|---|
| Mother | |||||
| Body mass index, kg/m2 | 22.8 ± 0.4a | 23.9 ± 0.4a | 34.5 ± 1.8b | 33.3 ± 1.1b | <0.001 |
| Age, yr | 29.4 ± 1.7 | 28.8 ± 1.9 | 30.1 ± 1.2 | 30.8 ± 1.1 | NS |
| Ethnicity (white/hispanic/black/asian) | 7/4/3/1 | 5/4/1/1 | 9/2/0/0 | 4/4/2/1 | |
| Gestational age | 39.1 ± 0.1 | 39.5 ± 0.2 | 39.3 ± 0.2 | 38.8 ± 0.3 | NS |
| Gestational age at diagnosis | 27.4 ± 2.7 | 24.7 ± 1.9 | NS | ||
| Fasting glucose, mg/dL | 83.1 ± 5.2 | 110 ± 17.7 | NS | ||
| 1-h Glucose OGTT, mg/dL | 196 ± 8.6 | 190 ± 6.4 | NS | ||
| 2-h Glucose OGTT, mg/dL | 186 ± 13.3 | 157 ± 8.4 | NS | ||
| 3-h Glucose OGTT, mg/dL | 110 ± 15.6 | 120 ± 11.9 | NS | ||
| Mode of delivery (vaginal/C-section) | 8/7 | 8/3 | 3/8 | 10/1 | |
| Clinical treatment (diet/insulin/glyburide) | 7/2/2 | 4/4/3 | |||
| Newborn | |||||
| Sex (men/women) | 7/8 | 6/5 | 4/7 | 4/7 | |
| Birth weight, kg | 3.23 ± 0.09a | 3.27 ± 0.1a | 3.56 ± 0.1b | 3.23 ± 0.1a | <0.05 |
| Placenta weight, g | 594 ± 23.4a | 602 ± 21.9a | 729 ± 49.6b | 601 ± 21.3a | <0.001 |
Data are presented as means ± SE. N-GDM, gestational diabetes mellitus with normal body mass index; NS, not significant; OB-GDM, obesity with GDM; OGTT, oral glucose tolerance test. One-way ANOVA followed by Tukey’s multiple comparison test, P < 0.05.
,
Time points with different superscripted letters are significantly different.
Primary human trophoblast culture and treatment.
Placentas from normal (n = 6), OB (n = 6), N-GDM (n = 6), and OB-GDM (n = 6) pregnancies delivered by vaginal or Caesarean section at term were collected within 15 min of delivery for isolation of primary human trophoblast (PHT) cells. PHT cells were isolated as described (44), with minor modifications (6). Briefly, ∼30 g of villous tissue was dissected and washed then transferred to digestion buffer with trypsin (0.25%; Invitrogen, Carlsbad, CA) and deoxyribonuclease I (Sigma Aldrich, St. Louis, MO). Trophoblast cells were separated through a discontinuous 10–70% Percoll gradient centrifugation. Isolated cytotrophoblast cells were cultured in high-glucose Dulbecco’s modified Eagle’s medium (DMEM; 15 mM; Sigma-Aldrich) and Ham’s F-12 (Life Technologies, Carlsbad, CA) nutrient mixture supplemented with l-glutamine, 10% fetal bovine serum (FBS; Atlanta Biologicals, Atlanta, GA), 50 μg/mL gentamicin, 60 μg/mL benzyl penicillin, and 100 μg/mL streptomycin (Sigma-Aldrich). PHT cells were plated at a density of 1.2 × 10⁶ in six-well plates (amino acid transport activity assay) or 4 × 10⁶ cells in 60-mm dishes (protein expression experiments). Cells were incubated in a 5% CO2 humidified atmosphere air at 37°C, and culture media were changed daily. After 66 h, differentiated PHT cells were treated with increasing concentrations of insulin (0, 0.25, 0.5, and 1 nM from bovine pancreas, Cat. No. I0516; Sigma Aldrich) for 24 h. The concentrations of insulin used are in the range of physiological postprandial insulin levels in pregnant women at term (61). All experiments were terminated at 90 h of culture. The release of chorionic gonadotropin (hCG) into the cell culture media was measured at 18, 42, 66, and 90 h after plating using a commercial ELISA (β-hCG ELISA; Immuno-Biological Laboratories, Minneapolis, MN). hCG secretion is expressed as milli-international units per milligram of protein per hour (mIU·mg−1·h−1) and represents a marker for trophoblast differentiation.
System A amino acid transport in PHT cells.
System A amino acid transport activity was determined by measuring Na+-dependent uptake of 14C-methyl-aminoisobutyric acid (MeAIB) (4). Following 24-h treatment with insulin, PHT cells were washed with Tyrode’s salt solution with or without Na+ (135 mM NaCl or Choline Cl, 5 mM KCl, 1.8 mM CaCl2, 1 mM MgCl2, 10 mM HEPES, and 5.6 mM glucose, pH 7.4) Subsequently, cells were incubated with Tyrode’s with or without Na+ and containing 14C-MeAIB (final concentration of 20 μM) for 8 min, a time point on the initial linear phase of uptake (44). Uptake was terminated by washing the cells three times with Na+-free ice-cold Tyrode’s salt solution. Cells were lysed by incubation in distilled water for 2 h, and released radiolabeled isotope was collected, mixed with scintillation fluid, and counted. Cellular protein content was determined using the Lowry method (51). System A-mediated uptake was determined by subtracting Na+-free (non-mediated) from total uptake (Na+-containing buffer) performed in triplicate. Transport activity is expressed as picomoles of MeAIB uptake per milligram of protein per minute (pmol·mg−1·min−1).
Placental villous explants and treatment.
An independent cohort of placentas was collected for villous explant experiments (normal, n = 9; N-GDM, n = 5; OB, n = 5; OB-GDM, n = 5). Villous tissue was washed and cut into pieces ∼4 mm in diameter and then incubated in increasing concentrations of insulin (0, 0.25, 0.5, and 1 nM, cat. no. I0516; Sigma-Aldrich) in DMEM culture media containing 10% FBS for 3 h under gentle agitation in triplicate. Explants were washed and placed in buffer D (250 mM sucrose in 10 mM HEPES-Tris) containing protease inhibitor (1:100, Cat. No. P8340; Sigma-Aldrich) and phosphatase inhibitor cocktails 1, 2, and 3 (1:100, cat. nos. P5726, P0044, and P8340, respectively; Sigma-Aldrich), homogenized and stored at −80°C until protein expression analysis by Western blot.
Western blotting.
PHT cells were harvested in radioimmunoprecipitation (RIPA) buffer (Thermo Fisher Scientific, Rockford, IL) containing protease inhibitor cocktail protease inhibitor and phosphatase inhibitors cocktails 1, 2, and 3 (1:100). Protein concentrations were determined by Pierce bicinchoninic acid (BCA) protein assay kit (Thermo Fisher Scientific), and samples were stored at −80°C until being separated by SDS-PAGE electrophoresis. Equal amounts of total protein, 6 μg from PHT lysates and 20 μg from explant homogenates, were separated on 10% Bis-Tris gels. Western blot analyses were carried out, as previously described (5). Antibodies were diluted as follows: total Akt (9272, diluted 1:1,000; Cell Signaling Technologies, Boston, MA) and phosphorylated Akt (T308, 5106S, diluted 1:1,000; Cell Signaling Technologies). Analysis of the blots was performed by densitometry using G:BOX Chemi XT4 gel imaging system and GeneTools analysis software (Syngene, Cambridge, UK). Amido Black staining was used to account for any differences in loading and transfer.
We determined the phosphorylation of Akt (S473) and MAPK ERK1/2 (T202/Y204) in PHT cells and villous explants using the Simple Western system, an automated capillary electrophoresis (cat. nos. SM-W004-1, PS-ST01, and PN-009–050; Protein Simple, San Jose, CA). Proteins were separated and probed using primary antibodies p-Akt (S473) and MAPK ERK1/2 (T202/Y204) (nos. 9271L and 4370, diluted 1:50; Cell Signaling Technologies), total Akt, and total MAPK ERK1/2 (Cell Signaling Technologies, Boston, MA, #9272 and #4695 diluted 1:50) and vinculin (no. 1390, diluted 1:200; Cell Signaling Technologies) as the loading control. Secondary anti-rabbit horseradish peroxidase antibody conjugate (DM-001; Protein Simple) was used against primary antibody targets. Analysis was performed by Compass for SW software (29). For comparison purposes, the average expression of nontreated cells and explants from each maternal condition was arbitrarily assigned a value of 1.0 to be used as control for that group. Treatment responses are expressed relative to their control group.
Data presentation and statistical analysis.
Data are presented as means ± SE. Statistical analysis was performed using Prism 7.0 (Graph Pad Software, Inc. La Jolla, CA). Data complied with homoscedastic or normality assumptions. Statistical significance was determined by repeated-measures one-way and two-way ANOVA, followed by Fisher’s least significant difference LSD post hoc test or Student’s paired t-test. Correlations between placental weights, birth weights, and maternal BMI were analyzed using Pearson’s correlation coefficient. A P value <0.05 and α = 0.05 was considered statistically significant.
RESULTS
Clinical characteristics.
Selected clinical data are stratified by pregestational BMI (<25 kg/m2) or obesity (≥30 kg/m2) and with or without GDM (Table 1). There were no statistical differences between groups in maternal age, gestational age at delivery, or gestational age at GDM diagnosis. Fasting and oral glucose tolerance test results did not differ between women whose placentas were used for PHT isolation and those used for villous explant studies. Birth weights and placental weights were significantly higher in the obese group compared with the normal BMI group. Placental weights were positively correlated with birth weight (r2 = 0.28, P = 0.0002), and placental weight (r2 = 0.20, P = 0.002) and birth weight (r2 = 0.38; P = 0.03) were positively correlated with maternal BMI independent of the presence of GDM (Fig. 1).
Fig. 1.
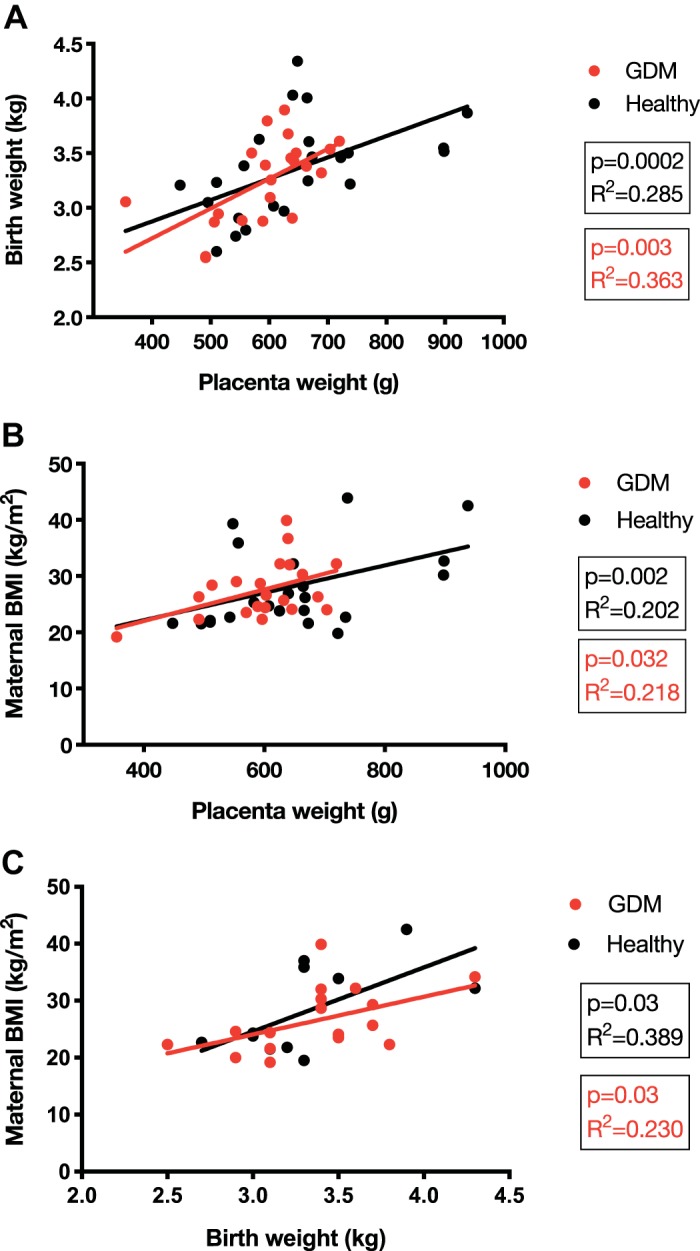
Correlations with birth weight and placenta weight. Correlations of placenta weight and birth weight (A), placenta weight and maternal body mass index (BMI; B), and maternal BMI and birth weight (C). Pearson’s correlation coefficient. P < 0.05 and α = 0.05 were considered statistically significant. GDM, gestational diabetes mellitus.
Insulin stimulates PHT cell System A amino acid transport activity in all groups.
To determine the insulin responsiveness of PHT cells, we measured the activity of System A amino acid transporters. Insulin treatment increased 14C-MeAIB uptake in the normal BMI, N-GDM, OBESE, and OB-GDM groups when compared with non-treated cells in a magnitude similar to previous reports (Fig. 2) (5, 41). Marked increased levels of hCG were detected at 66 and 90 h after plating compared with 18 h (P < 0.05), confirming differentiation of isolated cytotrophoblast cells. There was no difference in the secretion of hCG between groups at any time studied (Fig. 3).
Fig. 2.

Effect of insulin on system A amino acid transport in primary human trophoblast (PHT) cells. Differentiated PHT cells were incubated with insulin for 24 h before the activity assay. Data are presented as Na+-dependent uptake of 14C-methyl-aminoisobutyric acid (MeAIB), representing system A activity. Normal (n = 6; A), normal and gestational diabetes mellitus (N-GDM; n = 6; B), obese (OB; n = 6; C), obese and gestational diabetes mellitus (OB-GDM; n = 6; D) groups. Data are presented as means ± SE. Repeated-measures one-way ANOVA followed by Fisher’s least significant difference test, P < 0.05. Treatment groups with different letters are significantly different.
Fig. 3.
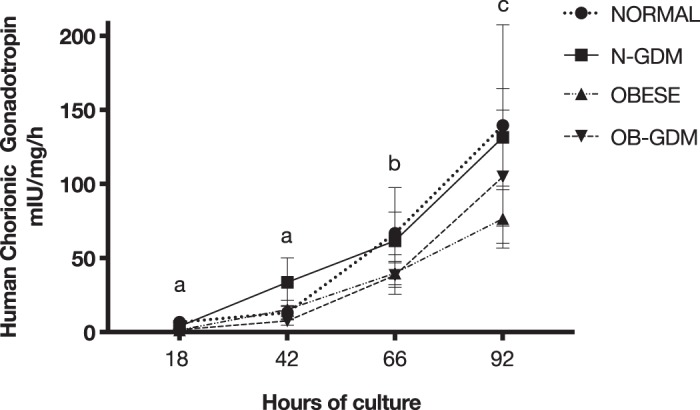
Secretion of human chorionic gonadotropin (hCG) from primary human trophoblast cells in culture. Significantly higher amounts of hCG were secreted into the media after 66 and 92 h in all 4 groups as compared with 18 h of culture [normal: n = 6; normal and gestational diabetes mellitus (N-GDM): n = 6; obese (OB): n = 6; obese and gestational diabetes mellitus (OB-GDM): n = 6]. Data are presented as means ± SE. Repeated-measures one-way ANOVA, followed by Fisher’s least significant difference test, P < 0.05. Time points with different letters are significantly different.
The lowest concentration of insulin (0.25 nM) tested significantly increased amino acid uptake in N-GDM (+38%, P = 0.03), OB (+37%, P = 0.02), and OB-GDM (+35%, P = 0.05) compared with untreated cells in the same group. In cells from normal pregnancies, 0.25 nM insulin increased system A by +21% (P = 0.07), and 1 nM insulin stimulation of system A reached statistical significance (+29%, P = 0.01). System A activity did not differ between the four groups at any insulin concentration (2-way ANOVA, Fisher’s LSD test, P = 0.43). The GDM study participants were managed with different clinical treatments (Table 1); however, the increase in system A amino acid uptake was similar in response to 1 nM insulin in PHT cells isolated from GDM women managed with diet (+30%, P = 0.03) and PHT cells isolated from GDM pregnancies treated with glyburide/insulin (+40%, P = 0.005; data not shown).
Insulin increases Akt phosphorylation in PHT cells.
Insulin treatment for 3 h in PHT cells caused a significant, approximately threefold increase in Akt (T308) phosphorylation in response to 1 nM insulin in all four groups (Fig. 4). Normal BMI and OB-GDM groups showed maximal stimulation at 0.25 nM insulin, whereas OB and N-GDM groups showed more of a dose response to increasing insulin concentrations. The total expression of Akt did not change at any insulin concentration. In addition, we found that insulin at 1 nM significantly increased the phosphorylation of Akt (S473) in normal BMI (2.4-fold) and obese GDM PHT (2.2-fold) compared with nontreated cells, but no significant change was observed in PHT isolated from N-GDM or obese pregnancies (Fig. 5, B and E).
Fig. 4.

Effect of insulin on Akt (T308) phosphorylation in primary human trophoblast (PHT) cells. A: representative Western blots of PHT cells treated with insulin for 3 h. Histogram illustrates relative protein expression of Akt (T308)/Akt. B–E: normal n = 6 (B), normal and gestational diabetes mellitus (N-GDM) n = 6 (C), obese (OB) n = 6 (D), obese and gestational diabetes mellitus (OB-GDM) n = 6 (E). Data are presented as means ± SE. Repeated-measures one-way ANOVA, followed by Fisher’s least significant difference test, P < 0.05. Treatment groups with different letters are significantly different.
Fig. 5.

Effect of insulin on Akt (S473) phosphorylation in primary human trophoblast (PHT) cells. A: representative simple Western images (60) of lysates of PHT cells incubated for 3 h with insulin. Histograms illustrate relative protein expression of Akt (S473)/Akt. B–E: normal n = 6 (B), normal and gestational diabetes mellitus (N-GDM) n = 6 (C), obese (OB) n = 6 (D), obese and gestational diabetes mellitus (OB-GDM) n = 4 (E). Data are presented as means ± SE. Repeated-measures one-way ANOVA, followed by Fisher’s least significant difference test, P < 0.05. Treatment groups with different letters are significantly different.
Insulin treatment increases phosphorylation of Akt and MAPK Erk1/2 in placental villous explants.
To study insulin responsiveness in ex vivo trophoblast, we collected an independent cohort of placentas from normal BMI and obese women, with or without GDM, to determine the effect of insulin on Akt and MAPK ERK1/2 phosphorylation in villous explants. Immediately after delivery, villous explants were dissected, washed, and treated with insulin (0, 0.25, 0.5, and 1 nM) for 3 h. The phosphorylation of Akt (T308) increased following insulin treatment in all groups when compared with nontreated villous explants, and total Akt remained unchanged (Fig. 6). The highest concentration of insulin (1 nM) significantly increased phosphorylation of Akt in normal (2.2-fold) and GDM groups (N-GDM: 1.9-fold; OB-GDM: 1.7-fold). We observed a similar increase in the OB group (1.6-fold); however, this change did not reach statistical significance (P = 0.06). Insulin treatment increased the Akt S473 phosphorylation in villous explants in all groups (Fig. 7). Insulin at 1 nM significantly increased the phosphorylation of Akt (S473) in normal, N-GDM, and OB-GDM (1.6-fold), whereas insulin at 0.5 nM increased Akt (S473) phosphorylation (1.6-fold) in the OB group.
Fig. 6.

Effect of insulin on Akt (T308) phosphorylation in villous explants. A: representative Western blots of villous explants incubated with insulin for 3 h. Histogram illustrates relative protein expression of Akt (T308)/Akt. B–E: normal n = 9 (B), normal and gestational diabetes mellitus (N-GDM) n = 5 (C), obese (OB) n = 5 (D), obese and gestational diabetes mellitus (OB-GDM) n = 5 (E). Data are presented as means ± SE. Repeated-measures one-way ANOVA, followed by Fisher’s least significant difference test, P < 0.05. Treatment groups with different letters are significantly different.
Fig. 7.

Effect of insulin on Akt (S473) phosphorylation in villous explants. A: representative simple Western images (60) of villous explants incubated with insulin. Histogram illustrates relative protein expression of Akt (S473)/Akt. B–E: normal n = 8 (B), normal and gestational diabetes mellitus (N-GDM) n = 6 (C), obese (OB) n = 7 (D), obese and gestational diabetes mellitus (OB-GDM) n = 6 (E). Data are presented as means ± SE. Repeated-measures one-way ANOVA, followed by Fisher’s least significant difference test, P < 0.05. Treatment groups with different letters are significantly different.
In addition, we measured the expression and phosphorylation of MAP ERK1/2. Insulin treatment (1 nM) significantly increased the phosphorylation of MAPK ERK1/2 (T202/Y204) in normal (1.5-fold), obese (2.0-fold), and diabetic groups (N-GDM: 1.6-fold; OB-GDM: 1.2-fold) when compared with untreated explants (Fig. 8).
Fig. 8.

Effect of insulin on MAPK ERK1/2 (T202/Y204) phosphorylation in villous explants. A: representative simple Western images (60) of villous explants incubated with insulin. Histogram illustrates relative protein expression of MAPK ERK1/2 (T202/Y204)/MAPK ERK1/2. B–E: normal n = 6 (B), normal and gestational diabetes mellitus (N-GDM) n = 6 (C), obese (OB) n = 6 (D), obese and gestational diabetes mellitus (OB-GDM) n = 6 (E). Data are presented as means ± SE. Paired t-test, P < 0.05. Treatment group with different letters are significantly different.
DISCUSSION
Using cultured primary human trophoblast cells and ex vivo trophoblast villous explants, we report that the placenta retains insulin responsiveness in pregnancies complicated by obesity and/or gestational diabetes. The combination of maternal hyperinsulinemia and normal placental insulin sensitivity in maternal obesity and GDM may promote placental growth and nutrient transport and contribute to accelerating fetal growth and/or adiposity, a common feature of these pregnancy complications.
Peripheral insulin secretory response and insulin sensitivity increase in early pregnancy and may represent a metabolic adaptation to the anabolic state of early gestation. In contrast, during late gestation, insulin sensitivity decreases in adipose tissue and skeletal muscle, which allows nutrients to become available for placental transfer to support fetal growth. Consequently, normal pregnancy is a state of relative insulin resistance (2, 49). Maternal obesity is associated with exacerbated insulin resistance, often resulting in hyperinsulinemia with maintained normal fasting blood-glucose. Defects in insulin-signaling transduction in adipose tissue and skeletal muscle represent the molecular underpinnings to peripheral insulin resistance in maternal obesity and GDM (15). GDM is primarily the result of insufficient islet adaptation and inability to increase insulin secretion adequately to maintain maternal glucose homeostasis in response to peripheral insulin resistance, which leads to hyperglycemia and hyperinsulinemia (65, 67).
Insulin regulates multiple metabolic functions of the placenta, including stimulation of hormone production and amino acid transport (31). Thus, it is important to determine placental insulin responsiveness in maternal obesity and/or GDM to better understand the impact of these common pregnancy complications on placental function and fetal growth. The placenta has also been proposed to function as a nutrient sensor that balances fetal growth with maternal nutrient availability by modifying its growth and function (21). It has been suggested that hyperinsulinemia activates mTOR to stimulate placental growth, contributing to the increased placental weight that is often observed in maternal obesity and GDM (69). This hypothesis is supported by a report from O’Tierney-Ginn et al. (57) demonstrating that the insulin response to a glucose challenge in normal, overweight, and obese women was correlated to placental volume in early pregnancy and to placental weight at term. In our study, placental and fetal weights were significantly increased only in pregnancies complicated by maternal obesity. We found a positive correlation between maternal prepregnancy BMI and placental and birth weight when all subjects were included in the correlation. These data support the model that increased maternal BMI promotes placental and fetal growth mediated in part by the effects of maternal hyperinsulinemia on placental growth and function.
The main treatment goal in GDM is to prevent hyperglycemia-associated maternal and fetal complications (66). Insulin, which remains one the recommended treatment options for glucose management in GDM (24), reduces the risk of fetal overgrowth and lowers the cranial-thoracic circumference ratio compared with other treatments (58). However, fetal overgrowth was reported to be more common in GDM women treated with long-acting insulin compared with GDM women with short-acting insulin, whereas glyburide increases infant length and birth weight (54), possibly by activating placental glucose transport (20). These observations suggest that treatment regimens may influence fetal growth by mechanisms unrelated to lowering maternal glucose levels, such as effects on placental function. In terms of placental insulin responsiveness, one study suggested that first-trimester placental glucose transfer is enhanced by insulin, whereas third-trimester glucose uptake is not regulated by insulin (22). Insulin receptors are abundantly present on the maternal-facing side of the trophoblast, with 10-fold higher receptor expression in the syncytiotrophoblast microvillous plasma membrane compared with the fetal-facing basal plasma membrane (56, 70, 71), highlighting the importance of understanding the effects of insulin on the placenta. In our study, we found that placental insulin sensitivity was not affected by the clinical strategy to manage glycaemia (either diet or insulin/glyburide).
Previous studies have explored the effect of obesity and/or GDM on the placental insulin-signaling pathway and reported that the expression of proteins such as IR, IR-1, IR-2, PI3K, and Akt is decreased, unchanged, or increased in placentas from pregnancies complicated by obesity or GDM (3, 16, 27). To the best of our knowledge, our study is the first to report markers of placental insulin sensitivity in maternal obesity with and without GDM. Using placental system A amino acid transport activity and phosphorylation of Akt and MAPK ERK1/2 as functional readouts of insulin signaling, we demonstrate that responsiveness to insulin did not differ from normal pregnancies, as we have previously described. This is in general agreement with previous findings where insulin-stimulated phosphorylation of histone H2B was increased in placentas from non-insulin-dependent diabetic women giving birth to large-for-gestational age babies (68). It has also been reported that placental Akt (S473) phosphorylation is increased in GDM women managed with insulin as compared with diet-treated GDM women and pregnant women with normal glucose tolerance (55).
Normal pregnant women produce sufficient amounts of insulin (2- to 3-fold increase) to overcome the pregnancy-related insulin resistance and the 50–60% decrease in peripheral insulin sensitivity. When either exacerbated insulin resistance exists or pancreatic insulin secretion is impaired, GDM develops. Obesity has been associated with a greater risk to develop GDM due to a state of increased insulin resistance. In contrast, studies in lean Japanese pregnant women who develop GDM demonstrated that insulin secretion is significantly lower when compared with Caucasians (26, 45). Taking into consideration that women with normal prepregnancy BMI and GDM have an impaired insulin secretion and obese GDM women have an increased insulin resistance, our data suggest that placental insulin sensitivity remains similar to euglycemic pregnancies independent of the underlying maternal defect that results in GDM.
We confirmed our findings in cultured trophoblast cells by demonstrating that insulin responsiveness was similar in ex vivo trophoblast villous explants isolated from normal and obese pregnancies with and without GDM. Our findings in villous explants suggest that the lack of difference in insulin sensitivity in PHT cells was unlikely to be the result of cytotrophoblast isolation, culture, and differentiation in vitro but rather represents the in vivo trophoblast in these pregnancy complications. We used insulin concentrations in the range of physiological postprandial insulin levels in pregnant women at term (61), further contributing to the physiological and clinical relevance of our studies.
Limitations of our study include the relatively small sample size per group that precludes us from determining the possible effects of ethnicity, mode of delivery, and fetal sex. Moreover, our sample did not include any obese or GDM women delivering large-for-gestational age babies, making it impossible to assess potential differences in placental insulin responsiveness related to abnormal fetal growth. This study characterized placental insulin responsiveness by one functional readout and two major insulin-signaling pathway arms, and other pathways may also be involved in the response to insulin by the human placenta in vivo.
Maternal nutrient availability and placental transport capacity are key determinants of fetal growth. Placental capacity to transport amino acids (35, 38), glucose (1, 23, 40), and fatty acids (47, 50, 53) has been reported to be increased in obese and/or diabetic women, particularly in cases of fetal overgrowth. These observations are in line with the placental nutrient-sensing model that enhanced maternal nutrient availability as indicated by higher insulin levels stimulates placental transfer of nutrients to the fetus, supporting increased fetal growth, as in obese and GDM pregnancies. Insulin promotes trophoblast amino acid (4, 33, 42) and glucose transport (23) mediated by activation of mTOR signaling (62). Because placental insulin and mTOR signaling are activated and placental amino acid transport is increased in obese women giving birth to large babies (35), it is possible that the hyperinsulinemia in combination with the maintenance of normal placental insulin responsiveness contributes to enhanced nutrient transport and fetal overgrowth and/or increased adiposity in these pregnancies.
In conclusion, in contrast to the peripheral maternal insulin resistance commonly associated with obesity and/or GDM, we found placental insulin responsiveness determined by activation of the Akt and Erk signaling pathways and amino acid transport activity in these pregnancy complications. We suggest that elevated maternal insulin levels in pregnancies complicated by obesity and/or GDM promote critical placental functions, including amino acid transport. Insulin-stimulated placental nutrient delivery may contribute to the increased risk of fetal overgrowth and adiposity in these pregnancies. Moreover, our findings may inform efforts to optimize insulin regimens for women with GDM.
GRANTS
This work was supported by National Institutes of Health Grant R01-HD-068370 and Colorado Clinical and Translational Sciences Institute Grants UL1TR002535, KL2TR002534, and TL1TR002533.
DISCLOSURES
No conflicts of interest, financial or otherwise, are declared by the authors.
AUTHOR CONTRIBUTIONS
M.C.-C., T.J., and T.L.P. conceived and designed research; M.C.-C. performed experiments; M.C.-C. analyzed data; M.C.-C., T.J., and T.L.P. interpreted results of experiments; M.C.-C. prepared figures; M.C.-C. drafted manuscript; M.C.-C., T.J., and T.L.P. edited and revised manuscript; M.C.-C., T.J., and T.L.P. approved final version of manuscript.
ACKNOWLEDGMENTS
Authors are grateful to Anita Kramer, Kathryn Erickson, and CTRC research nurses team for technical assistance.
REFERENCES
- 1.Acosta O, Ramirez VI, Lager S, Gaccioli F, Dudley DJ, Powell TL, Jansson T. Increased glucose and placental GLUT-1 in large infants of obese nondiabetic mothers. Am J Obstet Gynecol 212: 227.e1–227.e7, 2015. doi: 10.1016/j.ajog.2014.08.009. [DOI] [PubMed] [Google Scholar]
- 2.Ahlsson F, Diderholm B, Jonsson B, Nordén-Lindberg S, Olsson R, Ewald U, Forslund A, Stridsberg M, Gustafsson J. Insulin resistance, a link between maternal overweight and fetal macrosomia in nondiabetic pregnancies. Horm Res Paediatr 74: 267–274, 2010. doi: 10.1159/000295710. [DOI] [PubMed] [Google Scholar]
- 3.Alonso A, Del Rey CG, Navarro A, Tolivia J, González CG. Effects of gestational diabetes mellitus on proteins implicated in insulin signaling in human placenta. Gynecol Endocrinol 22: 526–535, 2006. doi: 10.1080/09513590600921374. [DOI] [PubMed] [Google Scholar]
- 4.Aye IL, Gao X, Weintraub ST, Jansson T, Powell TL. Adiponectin inhibits insulin function in primary trophoblasts by PPARα-mediated ceramide synthesis. Mol Endocrinol 28: 512–524, 2014. doi: 10.1210/me.2013-1401. [DOI] [PMC free article] [PubMed] [Google Scholar]
- 5.Aye IL, Jansson T, Powell TL. Interleukin-1β inhibits insulin signaling and prevents insulin-stimulated system A amino acid transport in primary human trophoblasts. Mol Cell Endocrinol 381: 46–55, 2013. doi: 10.1016/j.mce.2013.07.013. [DOI] [PMC free article] [PubMed] [Google Scholar]
- 6.Aye IL, Jansson T, Powell TL. TNF-α stimulates System A amino acid transport in primary human trophoblast cells mediated by p38 MAPK signaling. Physiol Rep 3: e12594, 2015. doi: 10.14814/phy2.12594. [DOI] [PMC free article] [PubMed] [Google Scholar]
- 7.Aye IL, Rosario FJ, Powell TL, Jansson T. Adiponectin supplementation in pregnant mice prevents the adverse effects of maternal obesity on placental function and fetal growth. Proc Natl Acad Sci USA 112: 12858–12863, 2015. doi: 10.1073/pnas.1515484112. [DOI] [PMC free article] [PubMed] [Google Scholar]
- 8.Butler AE, Cao-Minh L, Galasso R, Rizza RA, Corradin A, Cobelli C, Butler PC. Adaptive changes in pancreatic beta cell fractional area and beta cell turnover in human pregnancy. Diabetologia 53: 2167–2176, 2010. doi: 10.1007/s00125-010-1809-6. [DOI] [PMC free article] [PubMed] [Google Scholar]
- 9.Carpenter MW, Coustan DR. Criteria for screening tests for gestational diabetes. Am J Obstet Gynecol 144: 768–773, 1982. doi: 10.1016/0002-9378(82)90349-0. [DOI] [PubMed] [Google Scholar]
- 10.Castillo-Castrejon M, Powell TL. Placental nutrient transport in gestational diabetic pregnancies. Front Endocrinol (Lausanne) 8: 306, 2017. [Erratum in: Front Endocrinol (Lausanne) 10: 5, 2019.] doi: 10.3389/fendo.2017.00306. [DOI] [PMC free article] [PubMed] [Google Scholar]
- 11.Catalano PM. Trying to understand gestational diabetes. Diabet Med 31: 273–281, 2014. doi: 10.1111/dme.12381. [DOI] [PMC free article] [PubMed] [Google Scholar]
- 12.Catalano PM, Presley L, Minium J, Hauguel-de Mouzon S. Fetuses of obese mothers develop insulin resistance in utero. Diabetes Care 32: 1076–1080, 2009. doi: 10.2337/dc08-2077. [DOI] [PMC free article] [PubMed] [Google Scholar]
- 13.Catalano PM, Shankar K. Obesity and pregnancy: mechanisms of short term and long term adverse consequences for mother and child. BMJ 356: j1, 2017. doi: 10.1136/bmj.j1. [DOI] [PMC free article] [PubMed] [Google Scholar]
- 14.Chandrasekaran S, Neal-Perry G. Long-term consequences of obesity on female fertility and the health of the offspring. Curr Opin Obstet Gynecol 29: 180–187, 2017. doi: 10.1097/GCO.0000000000000364. [DOI] [PMC free article] [PubMed] [Google Scholar]
- 15.Colomiere M, Permezel M, Lappas M. Diabetes and obesity during pregnancy alter insulin signalling and glucose transporter expression in maternal skeletal muscle and subcutaneous adipose tissue. J Mol Endocrinol 44: 213–223, 2010. doi: 10.1677/JME-09-0091. [DOI] [PubMed] [Google Scholar]
- 16.Colomiere M, Permezel M, Riley C, Desoye G, Lappas M. Defective insulin signaling in placenta from pregnancies complicated by gestational diabetes mellitus. Eur J Endocrinol 160: 567–578, 2009. doi: 10.1530/EJE-09-0031. [DOI] [PubMed] [Google Scholar]
- 17.Committee on Practice Bulletins—Obstetrics ACOG Practice Bulletin No. 190: Gestational Diabetes Mellitus. Obstet Gynecol 131: e49–e64, 2018. doi: 10.1097/AOG.0000000000002501. [DOI] [PubMed] [Google Scholar]
- 18.Coustan DR. Gestational diabetes mellitus. Clin Chem 59: 1310–1321, 2013. doi: 10.1373/clinchem.2013.203331. [DOI] [PubMed] [Google Scholar]
- 19.DeSisto CL, Kim SY, Sharma AJ. Prevalence estimates of gestational diabetes mellitus in the United States, Pregnancy Risk Assessment Monitoring System (PRAMS), 2007-2010. Prev Chronic Dis 11: E104, 2014. doi: 10.5888/pcd11.130415. [DOI] [PMC free article] [PubMed] [Google Scholar]
- 20.Díaz P, Dimasuay KG, Koele-Schmidt L, Jang B, Barbour LA, Jansson T, Powell TL. Glyburide treatment in gestational diabetes is associated with increased placental glucose transporter 1 expression and higher birth weight. Placenta 57: 52–59, 2017. doi: 10.1016/j.placenta.2017.05.016. [DOI] [PMC free article] [PubMed] [Google Scholar]
- 21.Díaz P, Powell TL, Jansson T. The role of placental nutrient sensing in maternal-fetal resource allocation. Biol Reprod 91: 82, 2014. doi: 10.1095/biolreprod.114.121798. [DOI] [PMC free article] [PubMed] [Google Scholar]
- 22.Ericsson A, Hamark B, Jansson N, Johansson BR, Powell TL, Jansson T. Hormonal regulation of glucose and system A amino acid transport in first trimester placental villous fragments. Am J Physiol Regul Integr Comp Physiol 288: R656–R662, 2005. doi: 10.1152/ajpregu.00407.2004. [DOI] [PubMed] [Google Scholar]
- 23.Ericsson A, Hamark B, Powell TL, Jansson T. Glucose transporter isoform 4 is expressed in the syncytiotrophoblast of first trimester human placenta. Hum Reprod 20: 521–530, 2005. doi: 10.1093/humrep/deh596. [DOI] [PubMed] [Google Scholar]
- 24.Finneran MM, Landon MB. Oral agents for the treatment of gestational diabetes. Curr Diab Rep 18: 119, 2018. doi: 10.1007/s11892-018-1093-2. [DOI] [PubMed] [Google Scholar]
- 25.Flegal KM, Kruszon-Moran D, Carroll MD, Fryar CD, Ogden CL. Trends in Obesity Among Adults in the United States, 2005 to 2014. JAMA 315: 2284–2291, 2016. doi: 10.1001/jama.2016.6458. [DOI] [PMC free article] [PubMed] [Google Scholar]
- 26.Furukawa S, Kobayashi Y. Leaner women with impaired insulin secretion accounts for about 40% of gestational diabetes mellitus in japan. J Pregnancy 2019: 1–6, 2019. doi: 10.1155/2019/7578403. [DOI] [PMC free article] [PubMed] [Google Scholar]
- 27.Gallo LA, Barrett HL, Dekker Nitert M. Review: placental transport and metabolism of energy substrates in maternal obesity and diabetes. Placenta 54: 59–67, 2017. doi: 10.1016/j.placenta.2016.12.006. [DOI] [PubMed] [Google Scholar]
- 28.Goldenberg RL, McClure EM, Harrison MS, Miodovnik M. Diabetes during Pregnancy in Low- and Middle-Income Countries. Am J Perinatol 33: 1227–1235, 2016. doi: 10.1055/s-0036-1584152. [DOI] [PubMed] [Google Scholar]
- 29.Harris VM. Protein detection by simple Western™ analysis. Methods Mol Biol 1312: 465–468, 2015. doi: 10.1007/978-1-4939-2694-7_47. [DOI] [PubMed] [Google Scholar]
- 30.Heerwagen MJR, Gumina DL, Hernandez TL, Van Pelt RE, Kramer AW, Janssen RC, Jensen DR, Powell TL, Friedman JE, Winn VD, Barbour LA. Placental lipoprotein lipase activity is positively associated with newborn adiposity. Placenta 64: 53–60, 2018. doi: 10.1016/j.placenta.2018.03.001. [DOI] [PubMed] [Google Scholar]
- 31.Hiden U, Glitzner E, Hartmann M, Desoye G. Insulin and the IGF system in the human placenta of normal and diabetic pregnancies. J Anat 215: 60–68, 2009. doi: 10.1111/j.1469-7580.2008.01035.x. [DOI] [PMC free article] [PubMed] [Google Scholar]
- 32.Hruby A, Hu FB. The Epidemiology of Obesity: A Big Picture. Pharmacoeconomics 33: 673–689, 2015. doi: 10.1007/s40273-014-0243-x. [DOI] [PMC free article] [PubMed] [Google Scholar]
- 33.Jansson N, Greenwood SL, Johansson BR, Powell TL, Jansson T. Leptin stimulates the activity of the system A amino acid transporter in human placental villous fragments. J Clin Endocrinol Metab 88: 1205–1211, 2003. doi: 10.1210/jc.2002-021332. [DOI] [PubMed] [Google Scholar]
- 35.Jansson N, Rosario FJ, Gaccioli F, Lager S, Jones HN, Roos S, Jansson T, Powell TL. Activation of placental mTOR signaling and amino acid transporters in obese women giving birth to large babies. J Clin Endocrinol Metab 98: 105–113, 2013. doi: 10.1210/jc.2012-2667. [DOI] [PMC free article] [PubMed] [Google Scholar]
- 37.Jansson T, Ekstrand Y, Björn C, Wennergren M, Powell TL. Alterations in the activity of placental amino acid transporters in pregnancies complicated by diabetes. Diabetes 51: 2214–2219, 2002. doi: 10.2337/diabetes.51.7.2214. [DOI] [PubMed] [Google Scholar]
- 38.Jansson T, Ekstrand Y, Björn C, Wennergren M, Powell TL. Alterations in the activity of placental amino acid transporters in pregnancies complicated by diabetes. Diabetes 51: 2214–2219, 2002. doi: 10.2337/diabetes.51.7.2214. [DOI] [PubMed] [Google Scholar]
- 39.Jansson T, Ekstrand Y, Wennergren M, Powell TL. Placental glucose transport in gestational diabetes mellitus. Am J Obstet Gynecol 184: 111–116, 2001. doi: 10.1067/mob.2001.108075. [DOI] [PubMed] [Google Scholar]
- 40.Jansson T, Wennergren M, Powell TL. Placental glucose transport and GLUT 1 expression in insulin-dependent diabetes. Am J Obstet Gynecol 180: 163–168, 1999. doi: 10.1016/S0002-9378(99)70169-9. [DOI] [PubMed] [Google Scholar]
- 41.Jones HN, Jansson T, Powell TL. Full-length adiponectin attenuates insulin signaling and inhibits insulin-stimulated amino Acid transport in human primary trophoblast cells. Diabetes 59: 1161–1170, 2010. doi: 10.2337/db09-0824. [DOI] [PMC free article] [PubMed] [Google Scholar]
- 42.Karl PI, Alpy KL, Fisher SE. Amino acid transport by the cultured human placental trophoblast: effect of insulin on AIB transport. Am J Physiol 262: C834–C839, 1992. doi: 10.1152/ajpcell.1992.262.4.C834. [DOI] [PubMed] [Google Scholar]
- 44.Kliman HJ, Nestler JE, Sermasi E, Sanger JM, Strauss JF III. Purification, characterization, and in vitro differentiation of cytotrophoblasts from human term placentae. Endocrinology 118: 1567–1582, 1986. doi: 10.1210/endo-118-4-1567. [DOI] [PubMed] [Google Scholar]
- 45.Kusunoki Y, Katsuno T, Nakae R, Watanabe K, Ochi F, Tokuda M, Akagami T, Miuchi M, Miyagawa J, Namba M. Insulin resistance and β-cell function influence postprandial blood glucose levels in Japanese patients with gestational diabetes mellitus. Gynecol Endocrinol 31: 929–933, 2015. doi: 10.3109/09513590.2015.1075498. [DOI] [PubMed] [Google Scholar]
- 46.Lager S, Powell TL. Regulation of nutrient transport across the placenta. J Pregnancy 2012: 1–14, 2012. doi: 10.1155/2012/179827. [DOI] [PMC free article] [PubMed] [Google Scholar]
- 47.Lager S, Ramirez VI, Gaccioli F, Jang B, Jansson T, Powell TL. Protein expression of fatty acid transporter 2 is polarized to the trophoblast basal plasma membrane and increased in placentas from overweight/obese women. Placenta 40: 60–66, 2016. doi: 10.1016/j.placenta.2016.02.010. [DOI] [PMC free article] [PubMed] [Google Scholar]
- 48.Lassance L, Haghiac M, Leahy P, Basu S, Minium J, Zhou J, Reider M, Catalano PM, Hauguel-de Mouzon S. Identification of early transcriptome signatures in placenta exposed to insulin and obesity. Am J Obstet Gynecol 212: 647.e1-11, 2015. doi: 10.1016/j.ajog.2015.02.026. [DOI] [PMC free article] [PubMed] [Google Scholar]
- 49.Li J, Leng J, Li W, Zhang C, Feng L, Wang P, Chan JCN, Hu G, Yu Z, Yang X. Roles of insulin resistance and beta cell dysfunction in macrosomia among Chinese women with gestational diabetes mellitus. Prim Care Diabetes 12: 565–573, 2018. doi: 10.1016/j.pcd.2018.07.010. [DOI] [PMC free article] [PubMed] [Google Scholar]
- 50.Lindegaard ML, Damm P, Mathiesen ER, Nielsen LB. Placental triglyceride accumulation in maternal type 1 diabetes is associated with increased lipase gene expression. J Lipid Res 47: 2581–2588, 2006. doi: 10.1194/jlr.M600236-JLR200. [DOI] [PubMed] [Google Scholar]
- 51.Lowry OH, Rosebrough NJ, Farr AL, Randall RJ. Protein measurement with the Folin phenol reagent. J Biol Chem 193: 265–275, 1951. [PubMed] [Google Scholar]
- 52.Mack LR, Tomich PG. Gestational diabetes: diagnosis, classification, and clinical care. Obstet Gynecol Clin North Am 44: 207–217, 2017. doi: 10.1016/j.ogc.2017.02.002. [DOI] [PubMed] [Google Scholar]
- 53.Magnusson AL, Waterman IJ, Wennergren M, Jansson T, Powell TL. Triglyceride hydrolase activities and expression of fatty acid binding proteins in human placenta in pregnancies complicated by IUGR and diabetes. J Clin Endocrinol Metab 89: 4607–4614, 2004. doi: 10.1210/jc.2003-032234. [DOI] [PubMed] [Google Scholar]
- 54.Martis R, Crowther CA, Shepherd E, Alsweiler J, Downie MR, Brown J. Treatments for women with gestational diabetes mellitus: an overview of Cochrane systematic reviews. Cochrane Database Syst Rev 8: CD012327, 2018. doi: 10.1002/14651858.CD012327.pub2. [DOI] [PMC free article] [PubMed] [Google Scholar]
- 55.Muralimanoharan S, Maloyan A, Myatt L. Mitochondrial function and glucose metabolism in the placenta with gestational diabetes mellitus: role of miR-143. Clin Sci (Lond) 130: 931–941, 2016. doi: 10.1042/CS20160076. [DOI] [PMC free article] [PubMed] [Google Scholar]
- 56.Nelson DM, Smith RM, Jarett L. Nonuniform distribution and grouping of insulin receptors on the surface of human placental syncytial trophoblast. Diabetes 27: 530–538, 1978. doi: 10.2337/diabetes.27.5.530. [DOI] [PubMed] [Google Scholar]
- 57.O’Tierney-Ginn P, Presley L, Myers S, Catalano P. Placental growth response to maternal insulin in early pregnancy. J Clin Endocrinol Metab 100: 159–165, 2015. doi: 10.1210/jc.2014-3281. [DOI] [PMC free article] [PubMed] [Google Scholar]
- 58.Olmos PR, Borzone GR, Olmos RI, Valencia CN, Bravo FA, Hodgson MI, Belmar CG, Poblete JA, Escalona MO, Gómez B. Gestational diabetes and pre-pregnancy overweight: possible factors involved in newborn macrosomia. J Obstet Gynaecol Res 38: 208–214, 2012. doi: 10.1111/j.1447-0756.2011.01681.x. [DOI] [PubMed] [Google Scholar]
- 59.Ott R, Stupin JH, Loui A, Eilers E, Melchior K, Rancourt RC, Schellong K, Ziska T, Dudenhausen JW, Henrich W, Plagemann A. Maternal overweight is not an independent risk factor for increased birth weight, leptin and insulin in newborns of gestational diabetic women: observations from the prospective ‘EaCH’ cohort study. BMC Pregnancy Childbirth 18: 250, 2018. doi: 10.1186/s12884-018-1889-8. [DOI] [PMC free article] [PubMed] [Google Scholar]
- 60.Paulsen ME, Rosario FJ, Wesolowski SR, Powell TL, Jansson T. Normalizing adiponectin levels in obese pregnant mice prevents adverse metabolic outcomes in offspring. FASEB J 33: 2899–2909, 2019. doi: 10.1096/fj.201801015R. [DOI] [PMC free article] [PubMed] [Google Scholar]
- 61.Phelps RL, Metzger BE, Freinkel N. Carbohydrate metabolism in pregnancy. XVII. Diurnal profiles of plasma glucose, insulin, free fatty acids, triglycerides, cholesterol, and individual amino acids in late normal pregnancy. Am J Obstet Gynecol 140: 730–736, 1981. doi: 10.1016/0002-9378(81)90731-6. [DOI] [PubMed] [Google Scholar]
- 62.Roos S, Lagerlöf O, Wennergren M, Powell TL, Jansson T. Regulation of amino acid transporters by glucose and growth factors in cultured primary human trophoblast cells is mediated by mTOR signaling. Am J Physiol Cell Physiol 297: C723–C731, 2009. doi: 10.1152/ajpcell.00191.2009. [DOI] [PubMed] [Google Scholar]
- 63.Rosario FJ, Kanai Y, Powell TL, Jansson T. Increased placental nutrient transport in a novel mouse model of maternal obesity with fetal overgrowth. Obesity (Silver Spring) 23: 1663–1670, 2015. doi: 10.1002/oby.21165. [DOI] [PMC free article] [PubMed] [Google Scholar]
- 64.Santangeli L, Sattar N, Huda SS. Impact of maternal obesity on perinatal and childhood outcomes. Best Pract Res Clin Obstet Gynaecol 29: 438–448, 2015. doi: 10.1016/j.bpobgyn.2014.10.009. [DOI] [PubMed] [Google Scholar]
- 65.Simpson S, Smith L, Bowe J. Placental peptides regulating islet adaptation to pregnancy: clinical potential in gestational diabetes mellitus. Curr Opin Pharmacol 43: 59–65, 2018. doi: 10.1016/j.coph.2018.08.004. [DOI] [PubMed] [Google Scholar]
- 66.Subiabre M, Silva L, Toledo F, Paublo M, López MA, Boric MP, Sobrevia L. Insulin therapy and its consequences for the mother, foetus, and newborn in gestational diabetes mellitus. Biochim Biophys Acta Mol Basis Dis 1864: 2949–2956, 2018. doi: 10.1016/j.bbadis.2018.06.005. [DOI] [PubMed] [Google Scholar]
- 67.Sureshchandra S, Marshall NE, Wilson RM, Barr T, Rais M, Purnell JQ, Thornburg KL, Messaoudi I. Inflammatory determinants of pregravid obesity in placenta and peripheral blood. Front Physiol 9: 1089, 2018. doi: 10.3389/fphys.2018.01089. [DOI] [PMC free article] [PubMed] [Google Scholar]
- 68.Takayama-Hasumi S, Yoshino H, Shimisu M, Minei S, Sanaka M, Omori Y. Insulin-receptor kinase is enhanced in placentas from non-insulin-dependent diabetic women with large-for-gestational-age babies. Diabetes Res Clin Pract 22: 107–116, 1994. doi: 10.1016/0168-8227(94)90043-4. [DOI] [PubMed] [Google Scholar]
- 69.Tanaka K, Yamada K, Matsushima M, Izawa T, Furukawa S, Kobayashi Y, Iwashita M. Increased maternal insulin resistance promotes placental growth and decreases placental efficiency in pregnancies with obesity and gestational diabetes mellitus. J Obstet Gynaecol Res 44: 74–80, 2018. doi: 10.1111/jog.13474. [DOI] [PubMed] [Google Scholar]
- 70.Tavaré JM, Holmes CH. Differential expression of the receptors for epidermal growth factor and insulin in the developing human placenta. Cell Signal 1: 55–64, 1989. doi: 10.1016/0898-6568(89)90020-X. [DOI] [PubMed] [Google Scholar]
- 71.Whitsett JA, Lessard JL. Characteristics of the microvillus brush border of human placenta: insulin receptor localization in brush border membranes. Endocrinology 103: 1458–1468, 1978. doi: 10.1210/endo-103-4-1458. [DOI] [PubMed] [Google Scholar]
- 72.Yang Y, Wang Z, Mo M, Muyiduli X, Wang S, Li M, Jiang S, Wu Y, Shao B, Shen Y, Yu Y. The association of gestational diabetes mellitus with fetal birth weight. J Diabetes Complications 32: 635–642, 2018. doi: 10.1016/j.jdiacomp.2018.04.008. [DOI] [PubMed] [Google Scholar]