

SUMMARY
Lymphoid tissue inducer (LTi) cells are regarded as a subset of innate lymphoid cells (ILCs). However, these cells are not derived from the ILC common progenitor, which generates other ILC subsets and is defined by the expression of the transcription factor PLZF. Here we examined transcription factor(s) determining the fate of LTi progenitor versus non-LTi ILC progenitor. Conditional deletion of Gata3 resulted in the loss of PLZF+ non-LTi progenitors but not the LTi progenitors that expressed the transcription factor RORγt. Consistently, PLZF+ non-LTi progenitors expressed high amounts of GATA3 whereas GATA3 expression was low in RORγt+ LTi progenitors. The generation of both progenitors required the transcriptional regulator Id2, which defines the common helper-like innate lymphoid progenitor, but not cytokine signaling. Nevertheless, low GATA3 expression was necessary for the generation of functionally mature LTi cells. Thus, differential expression of GATA3 determines the fates and functions of distinct ILC progenitors.
eTOC
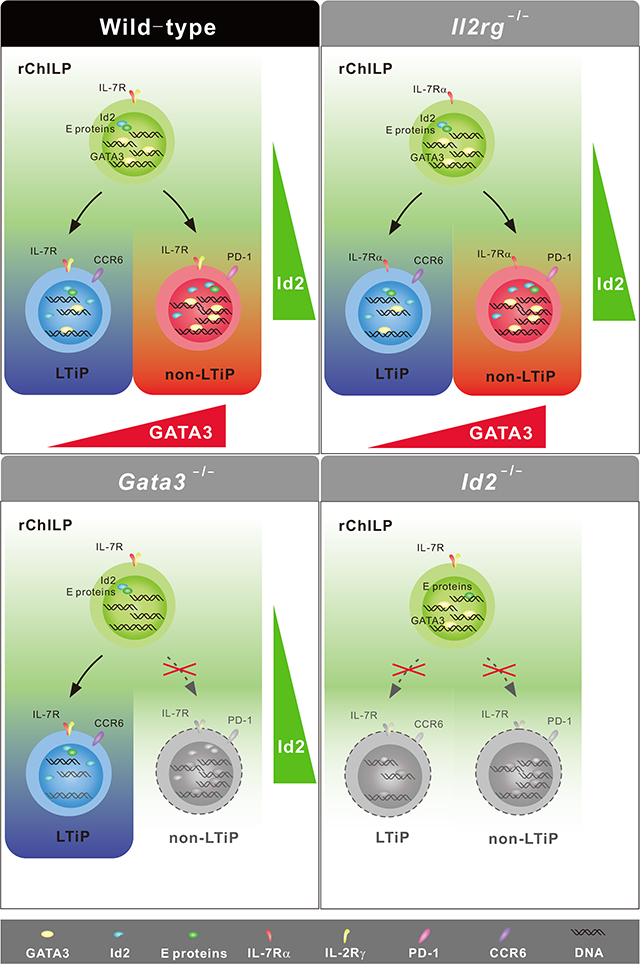
Lymphoid tissue inducer (LTi) cells are regarded as a subset of innate lymphoid cells (ILCs). Zhong et al. show that the generation of both non-LTi and LTi progenitors requires the transcriptional regulator Id2, but is distinguished by differential requirement for the transcription factor GATA3. Their findings suggest that non-LTi ILCs cells are the bona fide innate counterpart of CD4+ T effector cells.
Graphical Abstract
INTRODUCTION
Innate lymphoid cells (ILCs) similar as CD4+ T helper (Th) cells play important roles in protective immunity and in chronic inflammation (Artis and Spits, 2015; Diefenbach et al., 2014; Fang and Zhu, 2017; Zook and Kee, 2016). ILCs originate from the common progenitors for all T helper-like ILCs (common helper-like innate lymphocyte progenitor, or ChILP), defined by the expression of the integrin α4β7+ and the transcriptional regulator Id2. ChILPs give rise to all ILC subsets, including ILC1, ILC2 and ILC3, but not to conventional natural killer (cNK), T or B cells (Klose et al., 2014). Transcription factors associated with T cell development, such as TCF1, TOX, and Bcl11b, are also involved in the generation of ChILPs and the maturation of ILC subsets (Califano et al., 2015; Seehus et al., 2015; Walker et al., 2015; Yang et al., 2015; Yu et al., 2015). GATA3, another critical transcription factor for T cell development, is also required for the development of multiple ILC subsets including ILC3s and for the maintenance of ILC1s and ILC2s (Furusawa et al., 2013; Hoyler et al., 2012; Klein Wolterink et al., 2013; Klose et al., 2014; Mjosberg et al., 2012; Serafini et al., 2014; Yagi et al., 2014; Yang et al., 2013), but whether it has a unique role at the ILC progenitor stage is unknown.
Lymphoid tissue inducer (LTi) cells are a critical cell type involved in lymphoid organogenesis at the fetal stage (Eberl et al., 2004; Mebius, 2003; Zhong et al., 2018). LTi cells are regarded as a subgroup of ILC3s because deletion of the transcription factor RORγt, a defining factor for ILC3s, also depletes LTi cells. On the other hand, LTi cells and non-LTi ILC3s, some of which express the natural cytotoxicity receptor (NCR), seem to be functionally redundant during protective immune responses to Citrobacter rodentium infection (Rankin et al., 2016; Song et al., 2015). Cell fate mapping studies suggest that the LTi cells belong to lineage separate from ILC3s, as they are generated from ILC progenitors that have no history of expression of the transcription factor PLZF, whereas all other non-LTi ILCs are derived from PLZF-expressing progenitors (Constantinides et al., 2014). Thus, non-LTi ILC3s seem to be developmentally closer to ILC1s and ILC2s than to LTi cells even though both non-LTi ILC3s and LTi cells express RORγt. Consistent with this notion, LTi cells and NCR+ ILC3 cells have distinct gene expression signatures (Koues et al., 2016; Shih et al., 2016; Zhong et al., 2016).
GATA3 promotes the expression of NCR+ ILC3-specific genes but suppresses LTi-specific genes in NCR+ ILC3s (Zhong et al., 2016), suggesting that GATA3 may also be involved in fate determination of distinct ILC lineages at an earlier stage of ILC development. Since residual ILC3s but no other ILCs are still present in Gata3-deficient mice (Yagi et al., 2014), we wondered whether GATA3 differently affects the development of LTi cells and non-LTi ILC3s and whether GATA3 specifically regulates the generation of the PLZF+ ILC progenitors. In addition, although mice deficient in either GATA3, Id2 or γc all lack ILCs and do not form lymphoid structures, the relationship among these critical regulators during ILC development is unknown.
In this study, we found that GATA3 was dispensable for the development of LTi cells but required for the generation of other ILCs. This selective dependence of GATA3 for the development of distinct ILC progenitors was associated with differential expression of GATA3 in the distinct progenitors of LTi and non-LTi ILCs. Nevertheless, low GATA3 expression was necessary for acquiring LTi functions. By contrast, Id2 was required for the generation of both LTi and non-LTi progenitors, while γc cytokines were not involved in this process. The unique function of GATA3 in the development of non-LTi ILCs indicates that these cells but not LTi cells are the bona fide innate counterpart of CD4+ T effector cells.
RESULTS
GATA3 Is Required for the Development of Non-LTi ILCs
We have previously reported a critical role of GATA3 during ILC development using the Gata3fl/flVavCre mouse strain (Yagi et al., 2014), in which VavCre-mediated Gata3 deletion occurs at the hematopoietic stem cell stage. However, while T cells were completely absent in these mice, residual IL-7Rα (CD127)-expressing ILCs were still detectable (Figure 1A). In the small intestine lamina propria (siLP), the majority of the residual CD127+ ILCs from the Gata3fl/flVavCre mice were RORγt+ cells (Figure 1B and 1C) and expressed the LTi cell surface marker CCR6 (Figure 1D and 1E). These cells also expressed other molecules, including c-Kit, CD25, CD4, MHCII, and Id2, whose expression is found in wildtype (WT) LTi cells (Figure S1A). Nonetheless, Gata3fl/flVavCre mice failed to develop secondary lymphoid organs suggesting that either a cell number reduction or a functional deficit of Gata3−/− LTi cells may result in the failure of lymphoid organogenesis. Indeed, the total number of CCR6+ LTi cells was significantly reduced in the Gata3fl/flVavCre mice (Figure 1F). Some CCR6+ RORγt-expressing LTi cells were found in clusters in the gut of Gata3fl/flVavCre mice, however, these cells failed to recruit B cells into these clusters to form isolated lymphoid follicles (data not shown), suggesting that the GATA3-deficient LTi cells may be dysfunctional.
Figure 1. GATA3 is Required for the Development of All Non-LTi ILCs but Dispensable for the LTi Cell Generation.

(A) Flow cytometry analysis of small intestine lamina propria (siLP) lymphocytes. Dead cells were excluded by a fixable viability dye, and the Lin−CD127+ ILCs were further gated for analyses in (B) and (C).
(B) Residual ILC (Lin−CD127+) population in the siLP of the Gata3fl/flVavCre mice were characterized by intracellular GATA-3 and RORγt staining.
(C) The NKp46+ ILC3 subset (RORγt+NKp46+) among the siLP ILCs (Lin−CD127+) was analyzed.
(D) The RORγt+NKp46− ILC3s shown in (C) were further characterized based on their CCR6 and T-bet expression.
(E) The percentage of LTi cells (CCR6+ ILC3s) among all IL-7R-expressing ILCs were compared (mean ± s.d.; n = 5–6; ***P < 0.001, Student’s t-test).
(F) The total CCR6+ LTi cell numbers in the siLP were compared (mean ± s.d.; n = 5–6; ***P < 0.001, Student’s t-test).
Data are representative of at least three independent experiments (A-F).
See also Figure S1.
Despite of the presence of LTi cells in the Gata3fl/flVavCre mice, the NCR-expressing (NKp46+) ILC3 cells and their potential precursors that are either CCR6−T-bet+ or CCR6−T-bet− were largely absent in these mice (Figure 1C and 1D). Immature ILC1s (as indicated by NK1.1+NKp46+CD127+Eomes-) were also absent in the bone marrow of the Gata3fl/flVavCre mice (Figure S1B). In WT animals, mature ILC1s were found in various peripheral tissues such as siLP and liver, however, ILC1s were absent in the siLP and liver of the Gata3fl/flVavCre mice (Figure S1C and S1D). Unlike ILC1s in the liver, ILC1s among the small intestine intraepithelial lymphocytes (siIEL) could not be distinguished from the Eomes+ cNKs by CD49a expression (Figure S1E). NK1.1+NKp46+ siIELs were a mixture of CD127+Eomes− ILC1s and CD127−Eomes+ cNK cells in the WT mice, and the CD127+Eomes− ILC1s were absent in the Gata3fl/flVavCre mice (Figure S1E and S1F). Similarly, in the uterus and salivary gland of the Gata3fl/flVavCre mice, all the remaining NK1.1+NKp46+cells were Eomes-expressing cells (Figure S1H and S1I). Thus, ILC1s were undetectable in the Gata3fl/flVavCre mice in the bone marrow and various peripheral tissues. Bcl11b expression in some ILC progenitors may determine the ILC2 cell fate (Califano et al., 2015; Walker et al., 2015; Xu et al., 2019; Yu et al., 2015), and Bcl11b+ cells among the bone marrow ILC progenitor-containing αLP (lineage−CD127+Flt-3−T1/ST2−α4β7+) population were also absent in the Gata3fl/flVavCre mice (Figure S1G). Therefore, except for LTi cells, all other ILCs require GATA3 for their development.
GATA3 Dictates the Generation of PLZF+ ILC Progenitors
Common helper-like innate lymphoid progenitors (ChILPs) defined by the expression of the transcription factor Id2 and integrin α4β7 can generate all ILC subsets, presumably including the LTi cells (Klose et al., 2014). Thus, to analyze the ILC progenitors, we used an Id2-YFP reporter mouse strain in which the yellow fluorescent protein (YFP) reflects the expression of Id2 (Kim et al., 2014). As expected, T1/ST2-expressing ILC2s or ILC2 progenitors were absent in the Gata3fl/flVavCre mice (Figure 2A). By contrast, the Id2-expressing progenitors were still found in the bone marrow of these mice (Figure 2A). However, the expression of the other markers associated with ChILPs, such as CD127, c-Kit, Thy-1, and TCF1, was differentially affected by Gata3 deletion (Figure 2B). Fewer integrin α4β7+ αLP cells, mainly consisting of ILC progenitors, were detected in the bone marrow of Gata3fl/flVavCre mice (Figure 2C). Among the ChILPs, the PLZF-expressing ILC progenitors give rise to all the ILC subsets except for LTi cells (Constantinides et al., 2014). Analysis of the PLZF+ ILC progenitors among the αLP cells indicated that these cells were absent in the Gata3fl/flVavCre mice (Figure 2D). Thus, although ChILPs were still present in the bone marrow of Gata3fl/flVavCre mice, PLZF-expressing ILC progenitors (ILCPs) and the downstream T1/ST2-expressing ILC2 progenitors (ILC2Ps) were absent (Figure 2A and 2E). To rule out the effect of Gata3 deficiency on IL-7R expression and to be consistent with the previous report defining the PLZF+ ILC progenitors (Constantinides et al., 2014), we also checked all the PLZF+ cells within the live Lineage− gate in the bone marrow, and found no such cells in the bone marrow of Gata3fl/flVavCre mice (Figure S2A). In addition, no PLZF+ ILC progenitors were detected in the fetal livers of the Gata3fl/flVavCre embryos (Figure S2B). Thus, GATA3 is essential for the development of PLZF+ ILC progenitors.
Figure 2. GATA3 is Indispensable for the Generation of the PLZF+ Non-LTi ILC Progenitors.

(A) Flow cytometry analysis of common helper-like innate lymphoid progenitors (ChILPs) in the bone marrow (BM). The plots were gated on the live Lin−CD127+Flt-3−α4β7+ population. T1/ST2-Id2-YFPhigh cells were further analyzed for the expression of other molecules as shown in (B).
(B) The expression of representative molecules by the ChILP (live Lin−CD127+Flt-3−α4β7+T1/ST2−Id2-YFP+) cells in the presence (black line) or absence (red line) of Gata3 was analyzed by flow cytometry.
(C) The total numbers of αLP cells (live Lin−CD127+Flt-3−α4β7+T1/ST2-) were counted and plotted (mean ± s.d.; n = 6–7; ***P < 0.001, Student’s t-test). (D) The PLZF+ non-LTi ILC progenitors were analyzed by flow cytometry through gating on the live Lin−CD127+Flt-3−T1/ST2− cell population.
(E) The total numbers of ChILPs (live Lin−CD127+Flt-3−α4β7+T1/ST2−Id2-YFP+), ILCPs (live Lin−CD127+Flt-3−α4β7+T1/ST2−Id2-YFP+PLZF+) and ILC2Ps (live Lin−CD127+Flt-3−α4β7+T1/ST2+) were counted and plotted (mean ± s.d.; n = 3; **P < 0.01, ***P < 0.001, Student’s t-test).
Data are representative of three independent experiments (A-E).
See also Figure S2.
Differential Expression of GATA3 Distinguishes the PLZF+ ILC Progenitors from the LTi Progenitors
Given our new results, we hypothesize that the non-LTi ILC subsets are the true counterparts of CD4+ T effector cells. During T cell development, GATA3 expression is highly induced in the MHCII-restricted CD69+CD4+CD8int cells that undergo positive selection and these GATA3high cells have adopted the CD4+ T cell fate (Ho et al., 2009; Wang et al., 2008). Thus, we also tested whether GATA3 induction also occurs during the development of non-LTi ILCs.
In the bone marrow, ILC progenitors and “immature” ILC2s express CD127, integrin α4β7, and GATA3 (Klose et al., 2014). Indeed, the lineage−CD127+Flt-3−α4β7+ cells in the bone marrow exhibited a broad range of GATA3 expression (Figure S3A and S3B). In the previous study of ChILPs (Klose et al., 2014), the bone marrow “immature” ILC2s were excluded from the progenitor pool based on their CD25 expression. However, while most of the CD25+ cells showed high GATA3 expression, a strong indication of ILC2s, a few CD25+ cells expressed low amounts of GATA3 (Figure S3B), and thus they were unexpectedly excluded as “ILC2s” from the previous study. We also analyzed the expression of two other ILC2 surface markers, Sca-1 and T1/ST2, and found that only T1/ST2+ cells were exclusively GATA3high (Figure S3B). Thus, we replaced CD25 with T1/ST2 as the marker to distinguish immature ILC2s from the ILC progenitors throughout our study, which allows CD25-expressing progenitors to be included in subsequent analyses.
By using the Id2-YFP reporter mice, we found that both GATA3 and Id2 were expressed by most of the integrin α4β7+ αLP cells which consisted of the GATA3low and GATA3high populations (Figure 3A). Within the GATA3+ αLP cells more than half of them expressed c-Kit, while almost all the GATA3− cells were c-Kit− (Figure 3A). Although c-Kit is continuously expressed by some mature ILC subsets (Bernink et al., 2019; Fallon et al., 2006; Ricardo-Gonzalez et al., 2018), given the importance of SCF/Kit signaling in early lymphoid progenitor generation and maintenance, ILC progenitors also express c-Kit, and thus the c-Kit−GATA3+ αLP cells may represent more mature ILCs. Therefore, we also included c-Kit expression in defining the ILC progenitors in our study and we refer to this population as refined ChILPs (rChILPs, Lineage−CD127+Flt-3−α4β7+c-Kit+T1/ST2-). Among the rChILPs, based on the expression of GATA3 and Id2, there were three subsets --- Id2low/−, Id2highGATA3low, and Id2highGATA3high cell populations (Figure 3A). While most of the rChILPs and ILC2Ps expressed Id2-YFP, common lymphoid progenitors (CLPs) were found to be Id2-YFP negative as expected (Figure 3B). The differential GATA3 expression in the subsets of the Lineage−CD127+Flt-3−T1/ST2− cells was also confirmed by a GATA3-GFP reporter (Figure 3C). The expression of GATA3 and Id2 was further confirmed by an imaging flow cytometry analysis (Figure S3C).
Figure 3. Heterogeneity of Refined ChILP Cells Separated by the Differential Expression of GATA3 and Id2.

(A) A refined ChILP (rChILP) population in the BM was defined as the live Lin−CD127+Flt-3−T1/ST2−α4β7+c-Kit+ cells. The expression of GATA3 and Id2, and the proportions of three subsets with different GATA3 and Id2 expression among the rChILP cells were analyzed.
(B) Differential Id2-YFP expression in CLPs (live Lin−CD127+Flt-3+α4β7−Sca1+c-Kit+), rChILPs (live Lin−CD127+Flt-3−T1/ST2−α4β7+c-Kit+) and ILC2Ps (live Lin−CD127+Flt-3−α4β7+T1/ST2+) in the bone marrow.
(C) The GATA3 expression difference among the Lin−CD127+Flt-3−T1/ST2−α4β7+ including the rChILPs (red gate and red line) was further confirmed with a GATA3-GFP reporter mouse. Within the live Lin−CD127+Flt-3− BM cells, GATA3 level in the T1/ST2+ BM ILC2s (green gate and line) and the α4β7− cells (blue gate and line) were used as references for the GATA3 high- and negative/low- expression. The pink and blue shadows indicated the high and low amounts of GATA3-GFP.
(D) Id2high and Id2low/− rChILP cells were further analyzed for their expression association between GATA3 and PLZF.
(E) The previously defined Lin−PLZF+ ILC progenitors (ILCPs) (red gate and line) were compared with the rChILP cells (blue gate and line) in the same sample for Id2 and GATA3 expression.
(F) The GATA3high and GATA3low rChILP subsets were isolated from the GATA3-GFP reporter mice bearing a congenic marker (CD45.1XCD45.2) by cell sorting (see also Figure S3H), and were subsequently transferred into sublethally irradiated Rag2−/−Il2rg−/− recipients (CD45.2). After 4–6 weeks, the repopulated progenies derived from the CD45.1+CD45.2+ donor cells were analyzed in the siLPL of recipients. GATA3, RORγt, NKp46, T-bet, Eomes and CCR6 were used to distinguish distinct innate lymphoid populations, among which the CCR6+ cells (red gate) represent the LTi/LTi-like cells.
Data are representative of three (A-E) and two (F) independent experiments.
See also Figure S3.
The Id2-YFP reporter appeared to be brighter than the Id2-GFP reporter used in the previous ChILP study (Klose et al., 2014), since the Id2-GFP+ cells in the previous study resembled the Id2-YFPhigh cells (Figure S3D) and the Id2-YFP reporter also revealed a previously unknown population that is Id2low. Given that the expression of Id2 increases during early ILC progenitor development from CLPs, these Id2low cells could be at an earlier developmental stage than the Id2high cells. However, further in depth investigation is needed before such conclusion can be made. However, another sensitive Id2-RFP reporter (Xu et al., 2019) does not separate Id2low and Id2hi progenitors, possibly because an internal ribosome entry sequence (IRES) is introduced into that reporter system; the IRES often results in an amplified reporter expression especially for the transcripts that are expressed at a basal level (Mohrs et al., 2001). Nevertheless, the ILC/cNK cell common progenitors, EILPs (early innate lymphoid progenitors) (Yang et al., 2015), also showed low Id2 expression based on Id2-YFP (Figure S3E). Moreover, both the Id2high and Id2low progenitors could give rise to ILCs upon adoptive transfer (Figure S3F). These results suggest that an earlier ILC progenitor with low Id2 expression may exist among the α4β7+ αLP cells.
Within the Id2high rChILPs, the majority of the GATA3high cells expressed PLZF, while the GATA3low rChILPs were PLZF negative (Figure 3D). By contrast, very few of the GATA3high cells among the c-Kit−GATA3+ αLPs, which may represent mature ILCs, expressed PLZF (Figure S3G), consistent with the idea that PLZF is transiently expressed during ILC development. Moreover, no CD25+ cells were found within the GATA3high rChILP population, however, some GATA3highc-Kit− αLPs expressed CD25, indicating that they are committing towards the ILC2 fate. Consistent with this idea, most of the GATA3highc-Kit− αLPs expressed ILC2-related transcription factor Bcl11b (Figure S3G). Co-expression of GATA3 and PLZF was also detected in the Id2low/− rChILPs (Figure 3D). Furthermore, all the PLZF+ ILC progenitors exhibited high GATA3 expression (Figure 3E).
To further address whether the GATA3high and GATA3low rChILPs have already committed to distinct lineage fates, we analyzed the progenies of these two progenitor subsets in an adoptive transfer model. The GATA3-GFP reporter was used to separate the GATA3high and GATA3low rChILPs and the GATA3-GFP expression in the BM immature ILC2 cells was used as a reference in identifying the GATA3high rChILPs (Figure S3H). The GATA3-GFPhigh and GATA3-GFPlow rChILPs were sorted from congenic mice (CD45.1XCD45.2) and transferred to sublethally irradiated Rag2−/−Il2rg−/− recipients (CD45.2). Consistent with two recent reports (Walker et al., 2019; Xu et al., 2019), after 4–6 weeks, we also found that the GATA3-GFPhigh rChILPs had retained their capacity to become NK cells but not CCR6+ LTi cells (Figure 3F). However, while the GATA3-GFPhigh rChILPs generated all the non-LTi ILCs, the GATA3-GFPlow rChILPs preferentially gave rise to the CCR6+ LTi cells (Figure 3F). Thus, GATA3 expression is differently regulated during the non-LTi ILC and LTi cell development and such differential expression functionally separates these two distinct lineages.
GATA3 but not RORγt Is Dispensable for the Generation of LTi Progenitors
Since LTi cells but no other ILC subsets were present in the Gata3fl/flVavCre mice, we asked whether the residual rChILPs in the GATA3-deficient mice represent LTi progenitors. Some Id2highGATA3low rChILPs in adult WT bone marrow expressed low amounts of RORγt (Figure 4A). By using an RORγt-E2-Crimsin reporter strain, we confirmed the existence of these RORγt+ progenitors in adult bone marrow (Figure S4A). Moreover, by using an RORγt fate mapping tool (Rorc-Cre-Rosa26Tdtomato), we found that the vast majority of the GATA3low rChILPs were RORγt expressed/expressing cells, whereas GATA3high rChILPs had never expressed RORγt during their development (Figure 4B). CCR6 is expressed by mature LTi cells and fetal LTi progenitors (Ishizuka et al., 2016; Okubo et al., 2019; Xu et al., 2019), but the PLZF-expressing ILC progenitors do not express CCR6 (Constantinides et al., 2014). Indeed, CCR6 was expressed by a subset of the Id2high rChILPs, and these CCR6-expressing cells were mostly GATA3low and PLZF− (Figure 4C). Furthermore, these CCR6+ rChILPs gave rise to mature LTi cells after adoptive transfer (Figure 4D). The CCR6+ rChILPs with low RORγt expression are progenitors rather than mature LTi cells since they had a much greater capacity in populating mature LTi cells than CCR6+ LTi cells from the small intestines (Figure S4B).
Figure 4. RORγt but Not GATA3 is Required for the Generation of the CCR6-Expressing LTi Progenitors in Adult Bone Marrow.

(A) RORγt expression in GATA3highId2high (red line), GATA3lowId2high (blue line) and Id2low/− (green line) rChILPs was assessed by intracellular staining for RORγt. CLPs (shaded gray) were used as a negative control for RORγt expression.
(B) The expression of RORγt during the development of ILCs was monitored by an RORγt fate-mapping tool (Rorc-Cre-Rosa26Tdtomato).
(C) The expression of CCR6 on the rChILP cells were analyzed by flow cytometry; within the Id2high rChILPs, the CCR6+ cells are GATA3low and PLZF−.
(D) CCR6+ rChILPs were isolated from CD45.1+ congenic mice by cell sorting, and transferred to sublethally irradiated Rag2−/−Il2rg−/− (CD45.2) recipients. Repopulated progeny of the CD45.1 donor cells in the siLP were analyzed 4–6 weeks later. The percentage of the CCR6+ LTi cells among all the Lin−CD127+ progenies was calculated.
(E) The lineage specificity of the residual rChILP cells in the bone marrow of Gata3fl/flVavCre mice were analyzed by RORγt and CCR6 expression.
(F) The role of RORγt during ILC development was tested on the Rorcgfp/gfp mice. The lineage specificity of the rChILP cells in the bone marrow of Rorcgfp/gfp mice was characterized by GATA3 staining as well as the expression of the LTi progenitor markers including RORγt, CCR6, and CD25.
Data are representative of three independent experiments (A-F).
See also Figure S4.
RORγt was expressed by the majority of the residual rChILPs in the GATA3-deficient mice (Figure 4E). In fact, RORγt expression was higher in these cells than that in WT LTi progenitors, which is consistent with the notion that GATA3 represses RORγt expression in ILC3s (Zhong et al., 2016). CCR6 was also expressed by the majority of the Gata3−/− rChILPs confirming that these are LTi progenitors (Figure 4E). Mixed bone marrow chimera experiments confirmed that the development of PLZF-expressing but not CCR6-expressing rChILPs required GATA3 expression (Figure S4C). By contrast, GATA3low αLP cells was nearly absent, and there were no LTi progenitors in the Rorcgfp/gfp (RORγt-deficient) mice based on GATA3, RORγt, CCR6 and CD25 staining (Figure 4F). However, the GATA3hi progenitors were not affected by RORγt deficiency. Thus, although RORγt expression in the bone marrow LTi progenitors is low, it is required for the development of these cells.
Single Cell Analysis Confirmed rChILP Heterogeneity
To further investigate the heterogeneity of the rChILP cells and the relationship between Id2, GATA3 and other important factors (Zhong and Zhu, 2017; Zook and Kee, 2016), we performed single-cell multiplex RT-qPCR to assess the expression of a set of representative genes in each individual rChILP cell. To select a list of genes for this analysis, we first compared the differences in gene expression between rChILPs and CLPs with bulk RNA-Seq analysis (Figure 5A). Based on this result and another similar study in the literature (Ishizuka et al., 2016), we selected 92 genes (most of which encode transcription factors and cell surface molecules) together with 18s RNA and three spike RNAs for the single-cell analysis (Figure S5A and S5B). From our initial experiment, we first found the expression of Pdcd1 (encoding PD-1) and Zbtb16 (encoding PLZF) in rChILPs were co-expressed at the single cell level consistent with two previous reports (Seillet et al., 2016; Yu et al., 2016). This correlation was further confirmed by flow cytometry (Figure S5C). Therefore, we used PD-1 and CCR6 expression to label the non-LTi and LTi progenitors among rChILPs and recorded the expression of PD-1 and CCR6 for each sorted cell using indexed sorting. Based on gene expression pattern, the WT rChILPs were clustered into three major subgroups, with the cluster 2 (C2) and C3 cells labeled by anti-PD-1 and anti-CCR6, respectively (Figure 5B). C2 cells expressed higher amounts of GATA3 than C3 cells did. Both C2 and C3 cells expressed high amounts of Id2, but C1 cells had lower Id2 expression (Figure 5B). A diffusion map algorithm also showed a similar clustering pattern (Figure 5C). Thus, our single cell gene expression results confirm that the heterogeneity of rChILPs can be demonstrated by the relative expression of Id2 and GATA3.
Figure 5. Single-Cell Gene Expression Analyses Confirm an Essential but Different Role of Id2 and GATA3 during ILC Lineage Specification.

(A) The rChILP and CLP cells were isolated by cell sorting. Their gene expression were analyzed by RNA-Seq and compared with an MA plot.
(B) The rChILP cells from C57BL/6 WT mice (left) and the Gata3fl/flVavCre mice (right) were index sorted. Their PD-1 and CCR6 expression based on the flow cytometric record is indicated by distinct colors. The expression of 92 selected genes and the 18sRNA in the sorted cells together with three spike RNAs were analyzed with single cell RT-qPCR on the Fludigm’s 96.96 chips. Based on the gene expression pattern, the WT rChILP cells were clustered into three subsets, C1, C2, and C3. C1 enriched for Id2low/− progenitors, while C2 and C3 represent PD-1-expressing non-LTi progenitors and CCR6-expressing LTi progenitors, respectively.
(C) Clustering of the rChILP cells based on the gene expression analyses at the single cell level shown in (B) was also displayed via a diffusion map algorithm. Each dot represents a single cell and its color indicates the expression of PD-1 and CCR6 from the flow cytometric data.
(D) The clustering analysis of the rChILP cells in (C) was applied to the rChILP cells from the Gata3fl/flVavCre mice.
(E) The rChILPs were sorted from the Id2gfp/+ and Id2gfp/gfp mice respectively, followed by single cell RT-qPCR gene expression analysis shown in (B). The cell clustering analysis in (C) was then applied to assess the effect of Id2 deficiency on rChILP subset development.
Data are from two biological duplicates (A) and pooled from two (B-E) independent experiments.
See also Figure S5.
Consistent with the flow cytometry results shown above, single cell gene expression analysis also indicated that the residual rChILPs from the Gata3fl/flVavCre mice exhibited a similar gene expression pattern as the C3 cells in the WT group, further confirming that GATA3 is dispensable for the development of LTi lineage (Figure 5B and 5D). Id2 is required for the generation of all innate lymphocytes. However, the Id2-GFP+ “ChILP” cells still existed in the Id2gfp/gfp (Id2-deficient) mice, indicating that Id2 itself was not required for its own upregulation, although these Id2-deficient “ChILP” cells had reduced IL-7R (CD127) expression (Figure S5D). Similar as in the Gata3-deficient mice, PLZF+ ILC progenitors were completely absent in the Id2gfp/gfp mice (Figure S5E). In addition, Id2gfp/gfp rChILPs failed to express high amounts of GATA3 (Figure S5F). These developmental deficits were further confirmed by the single cell gene expression analysis (Figure 5E). The majority of the Id2gfp/gfp rChILP cells were clustered into the C1 cluster, indicating that C1 cells could be early progenitors and without Id2 expression, these progenitors cannot further develop. Together, our single cell gene expression results indicate that Id2 is required for the development of both PD-1-expressing ILC progenitors and CCR6-expressing LTi progenitors, whereas GATA3 functions further downstream of Id2 and selectively regulates the development of PD-1/PLZF-expressing ILC progenitors.
Positive Correlation between the Expression of GATA3 and PLZF+ ILC Progenitor-Specific Genes
Because ILC progenitors are heterogeneous and the non-LTi progenitors are completely absent in the GATA3-deficient mice, we cannot simply compare the gene expression pattern between WT and GATA3-deficient rChILPs to identify genes regulated by GATA3. However, due to the expression variation of each individual gene at the single cell level, it is possible for us to investigate the correlation between the expression of any two given genes. Based on the single-cell gene expression data, we first selected the genes that are preferentially expressed by either non-LTi ILC progenitors (PD-1+ Cell Cluster, C2) or LTi progenitors (CCR6+ Cell Cluster, C3), which could be defined as “DC1lowDC2low” and “DC1high” rChILPs, respectively (Figure S6A), by scoring the 92 genes with DC1 and DC2 (Figure S6B). The genes with low scores in both DC1 and DC2 (DC1lowDC2low Gene Cluster) were considered as the non-LTi ILC lineage-related genes, whereas the gene with the highest score in DC1 (DC1high Gene Cluster) were regarded as the LTi lineage-related genes. As expected, while GATA3 was identified as one of the non-LTi ILC lineage-related genes, whereas Id2 did not associate with either lineage (Figure S6B). When we analyzed the correlation between these lineage-related gene expressions with either GATA3 or Id2 (Figure 6A), we found that GATA3 expression was positively correlated with many non-LTi lineage-specific genes but negatively correlated with several LTi lineage-specific genes in non-LTi ILC progenitors. On the other hand, Id2 expression was positively correlated with many lineage-specific genes of both cell types. Furthermore, in non-LTi ILC progenitors, genes that were positively correlated with GATA3 expression were not the same genes that were positively correlated with the Id2 expression. Therefore, GATA3 and Id2 may regulate the development of non-LTi ILC progenitors through different mechanisms.
Figure 6. GATA3 Expression is Positively or Negatively Associated with the Expression of Lineage-Related Genes that Belong to PD-1- or CCR6-Expressing ILC Progenitors, Respectively.

(A) The PD-1+ cells (non-LTi ILC progenitors) and CCR6+ cells (LTi progenitors) were defined as in Figure S6A, and non-LTi ILC lineage related genes (DC1lowDC2low Gene Cluster) and LTi lineage related genes (DC1high Gene Cluster) were defined as in Figure S6B. The correlation (Spearman) between the expression of GATA3 (upper panel) or Id2 (lower panel) and these lineage related genes were analyzed within the two progenitor populations. All pairs with correlation p values < 0.05 are boxed in the heatmap. NA, not applicable because of very low or no expression of this gene.
(B) The distinct ILC progenitors within the rChILP population were isolated by cell sorting (non-LTi ILC progenitor = Lin−CD127+Flt-3-T1/ST2−α4β7+c-Kit+PD-1+CCR6−, and LTi progenitor = Lin−CD127+Flt-3−T1/ST2−α4β7+c-Kit+PD-1−CCR6+), and they were then subjected to bulk RNA-Seq analysis. The gene expression of these two ILC progenitors was then compared using the CLPs as a reference.
Data are pooled from two independent experiments (A) or from two biological duplicates (B).
See also Figure S6.
To extend the list of genes that are differentially expressed by PD-1+ ILC progenitors and CCR6+ LTi progenitors, we further investigated these two lineages through bulk RNA-Seq analysis with their progenitor CLP as the reference (Figure S6C and S6D). The expression of many genes that were highly expressed in rChILPs, was induced in both the PD-1+ rChILPs and the CCR6+ rChILPs. However, the degree of induction of these genes was relatively higher when they developing into the PD-1+ rChILPs than into the CCR6+ rChILPs (Figure S6C and S6D). Direct comparison between non-LTi ILC and LTi progenitors confirmed the differential expression of these genes (Figure 6B). These results indicate that the development of these two lineages may share many critical components but a quantitative difference in the expression of these factors may form distinct gene regulatory network.
We also compared the RNA-Seq data from the CCR6+ rChILPs with our previously published RNA-Seq data from small intestine CCR6+ LTi cells (Zhong et al., 2016). Consistently with the idea that CCR6+ rChILPs are distinct from mature LTi cells, thousands of genes were differentially expressed by these two cell populations (Table S1). As expected, CCR6+ rChILPs expressed lower amounts of Rorc than gut CCR6+ LTi cells did. While both CCR6+ cell populations expressed lymphotoxins, only the gut CCR6+ cells but not the bone marrow CCR6+ rChILPs expressed Il22, Il17a and Il17f. Furthermore, the CCR6+ rChILPs preferentially expressed Sell (encoding CD62L) and Cd24a (encoding CD24a, a cell surface marker for immature cells), while the mature LTi cells preferentially expressed Cd69 (encoding CD69, a cell surface marker for tissue residency, Table S1).
Cytokine Signaling Is Not Required for Early ILC Development
Besides Id2 and GATA3, cytokine signaling is also crucial for the development/maturation of ILC subsets and thus the Rag2−/−Il2rg−/− mice that are deficient in both Rag2 and the IL-2 receptor common γ chain (γc) showed a global defect in the generation of all ILC subgroups (Figure S7A and S7B). However, normal numbers of rChILPs were detected in the bone marrow of Rag2−/−Il2rg−/− mice (Figure 7A). In addition, neither the PLZF+ non-LTi ILC progenitors nor the CCR6+ LTi progenitors were affected by the absence of γc-cytokine-mediated signaling (Figure 7B). These results indicate that γc-cytokine-mediated signaling is not essential for the generation of early ILC progenitors, indicating that the role of GATA3 in regulating the development and functions of ILC subsets proceeds the functions of cytokines in ILC homeostasis and maturation.
Figure 7. Dose-Dependent GATA3-Mediated Transcriptional Regulation Dictates the Development of ILCs Prior to Cytokine Signals.

(A) The total rChILP cell numbers in the Rag2−/− and Rag2−/−Il2rg−/− mice were counted and plotted (mean ± s.d.; n = 3).
(B) The GATA3high or PLZF+ non-LTi ILC progenitors and GATA3low or CCR6+ LTi progenitors from the Rag2−/−Il2rg−/− mice were analyzed in comparison with these populations in the Rag2−/− mice.
(C) Flow cytometry analysis of ILCs found in the siLP of the Gata3fl/flVavCre-TghCD2-Gata3 mice. Dead cells were excluded by a fixable viability dye, and the Lin−CD127+ ILCs were further gated for analyses. The total numbers of indicated populations were counted and plotted (mean ± s.d.; n = 3; *P < 0.05, **P < 0.01, Student’s t-test).
(D) Flow cytometry analysis of rChILPs in the bone marrow of the Gata3fl/flVavCre-TghCD2-Gata3 mice. The plots were first gated on the live Lin−CD127+Flt-3−α4β7+ population. T1/ST2−c-Kit+ cells were further analyzed for the expression of RORγt and PLZF. The degree of GATA3 expression by different subsets was further compared. The total numbers of indicated populations were counted and plotted (mean ± s.d.; n = 3; **P < 0.01, ***P < 0.001, Student’s t-test).
Data are representative of three independent experiments (A-D) or a combination of three independent experiments (C-D).
See also Figure S7.
Low GATA3 Expression Restores LTi Functions but not the Development of PLZF-Expressing ILC Progenitors
To further address the role of low GATA3 expression in regulating the development and functions of LTi cells, we crossed the Gata3fl/flVavCre mice onto a transgenic background in which the expression of GATA3 transgene is controlled by human CD2 promoter. The resulting Gata3fl/flVavCre-TghCD2-Gata3 mice developed lymph node structures and B cells were the major population in these lymph nodes (Figure S7C). The Gata3 transgene also rescued the LTi cell numbers both in the gut and in the bone marrow (Figure 7C and 7D), however, this transgene failed to rescue the development of ILC2s and NKp46+ ILC3s in the gut (Figure 7C), ILC2s in the lung (Figure S7D) and ILC1s in the liver (Figure S7E), and the PLZF-expressing progenitors in the bone marrow (Figure 7D). Indeed, the expression of the Gata3 transgene was equivalent to the endogenous GATA3 amounts in WT LTi cells, but much lower than GATA3 expression found in PLZF-expressing progenitors (Figure 7D). These data indicate that low GATA3 expression is essential for generating functional LTi cells, but not sufficient for driving the development of ILC1s, ILC2s and NKp46+ ILC3s. While the Gata3 transgene also rescued the development of CCR6−NKp46− RORγt-expressing ILC3s (Figure 7C), it failed to restore the generation of PLZF-expressing non-LTi progenitors (Figure 7D). Some T cells were also found in the lymph nodes and spleens of the Gata3fl/flVavCre-TghCD2-Gata3, however, all these cells were γδ but not αβ T cells (Figure S7C). Given that GATA3 is also differentially expressed during CD4/CD8 T cell development, the dose effect of GATA3 during lymphocyte development may be applied to both innate and adaptive lymphoid system at multiple developmental stages.
DISCUSSION
In this study, we have analyzed the role of GATA3 in regulating the development of innate lymphoid cell subsets by focusing on its expression and functions in various ILC progenitors in the bone marrow. GATA3 was differentially expressed by two distinct ILC progenitors, namely LTi/LTi-like progenitors and non-LTi progenitors, both of which expressed high amounts of Id2. Importantly, GATA3 was required for the development of PLZF-expressing non-LTi progenitors, but dispensable for the development of LTi/LTi-like progenitors. Nevertheless, low GATA3 expression was required for the acquisition of LTi functions.
Both LTi and non-LTi progenitors were within the Id2hi population that have been defined as the common helper-like innate lymphoid progenitors (ChILPs) (Klose et al., 2014). In this previous study, CD25 was used as a cell surface marker to exclude ILC2s. However, CD25 was not exclusively expressed by ILC2s. In fact, many LTi progenitors also expressed CD25. The expression of a subunit of IL-33 receptor, T1/ST2, however, was specific to the GATA3high ILC2s. Thus, using T1/ST2 rather than CD25 to exclude ILC2s in this study is a reasonable way in defining the ILC progenitors. We also limited the common ILC progenitors to those c-Kit+ cells as most early progenitors express c-Kit. In fact, among the αLP cells, c-Kit− cells were either GATA3− cells or GATA3high cells. GATA3− cells were likely non-lymphoid cells whereas GATA3highc-Kit− αLPs included a large proportion of Bcl11b+ but PLZF− cells, indicating that they had already committed to the ILC2 fate (Xu et al., 2019). Thus, we defined the T1/ST2−c-Kit+ αLPs (Lineage−CD127+Flt-3−α4β7+T1/ST2−c-Kit+) as refined common helper-like innate lymphoid progenitors (rChILPs).
Within the rChILPs, there existed at least two major distinct populations which can be regarded as LTi and non-LTi ILC progenitors, respectively. The heterogeneity of the ILC progenitors has also been previously investigated through single cell analysis and the results from our current single cell analysis are consistent with the previous report (Ishizuka et al., 2016). Fetal LTi progenitors express high amounts of RORγt (Eberl et al., 2004), however, the expression of this molecule was low in adult bone marrow LTi progenitors. Nevertheless, the development of adult LTi progenitors also depended on RORγt. Another marker specifically expressed on the surface of bone marrow LTi progenitors was CCR6, which is also expressed by mature LTi cells and fetal LTi progenitors. By contrast, PD-1 is an alternative marker for the PLZF+ non-LTi ILC progenitors. Using cell surface expression of CCR6 and PD-1 in identifying different ILC lineage progenitors will facilitate studies to address outstanding questions in the field of ILC development. For example, although the PLZF- or PD-1-expressing ILC progenitors still retain their capacity to become NK cells (Walker et al., 2019; Xu et al., 2019), the relative contribution of this developmental pathway in NK cell development during physiological conditions is unknown.
Using another GATA3-deficient mouse strain, Harly et al. have reported that GATA3 is required for the generation of PLZF-expressing ILC progenitors (Harly et al., 2018). Here, we further demonstrated that high GATA3 expression was crucial for the development of non LTi ILC progenitors. Single-cell analysis showed that the amounts of GATA3 expression were positively correlated with the amounts of the expression of the non-LTi ILC lineage-related genes, but negatively correlated with the amounts of the expression of the LTi lineage-related genes. These results suggest that the amounts of GATA3 expression control the bifurcation of the LTi and non-LTi lineages. Constitutively active notch signal disrupts LTi cell development and secondary lymphoid structure formation. Notch signaling may promote GATA3 expression partly via TCF1 induction (Yang et al., 2013). Indeed, the expression of both GATA3 and TCF1 was high in the non-LTi ILC progenitors. The relationship between GATA3 and TCF1 in regulating ILC lineage fate requires further investigation.
The development of RORγt-expressing ILC3s is impaired in the Gata3fl/fl-VavCre mice (Yagi et al., 2014), however, residual RORγt-expressing cells can still be found but the identity of these RORγt-expressing cells (which turns out to be LTi lineage) was not previously determined. Consistent with the idea that the Gata3 deficiency did not block the development of LTi cells, CD127+ RORγt-expressing cells are only slightly reduced in the Gata3-deficient fetal livers (Serafini et al., 2014), although CD127hi RORγt-expressing cells are nearly absent. While CCR6-expressing LTi cells were present in the Gata3fl/fl-VavCre mice, secondary lymphoid structures are absent in these mice (Yagi et al., 2014). GATA3 maintains ILC3 and LTi homeostasis through regulating IL-7Rα expression (Zhong et al., 2016). However, this does not explain lack of lymph nodes in Gata3fl/fl-VavCre mice since Gata3fl/fl-Rorc-Cre mice develop these structures normally despite of reduced LTi cells. Furthermore, IL-7Rα transgene while was able to restore LTi total cell numbers in the Gata3fl/fl-VavCre mice failed to rescue the defect in lymph node generation (data not shown), indicating that GATA3 is required for the functions of LTi cells. Indeed, the frequency of lymphotoxin- and TNF-expressing cells among the LTi cells was much lower in the absence of GATA3 based on the results from single cell analysis and the GATA3-deficient LTi cells were less mature with high amounts of c-Kit, Sox4, CD27 and CD62L expression. Because Rorc-Cre deletes Gata3 only after RORγt-expressing cells have already developed, the role of GATA3 in regulating LTi functions is likely to be at the earlier stages of LTi development.
Low GATA3 expression was essential for LTi functions since an hCD2 promoter-driven Gata3 transgene, which was expressed at a low level, could rescue the generation of lymph nodes in the Gata3fl/flVavCre mice. Nevertheless, this transgene failed to restore the development of PLZF-expressing progenitors, indicating that the generation of these non-LTi progenitors requires high GATA3 expression. The Gata3 transgene also rescued the development of CCR6−NKp46− RORγt-expressing ILC3s. It is possible that in some progenitors, the Gata3 transgene is transiently expressed at high amounts, which allows these cells to pass through the non-LTi progenitor stage. Alternatively, the Gata3 transgene has triggered an artificial development pathway to the CCR6−NKp46− ILC3s, but this pathway does not occur under physiological settings. Finally, although CCR6− ILC3s are derived from the GATA3hi non-LTi progenitors, their development may only require low GATA3 expression. More in depth studies are required to address these possibilities. CCR6−NKp46− ILC3s can further develop into NKp46+ ILC3s in the WT animals. However, NKp46+ ILC3s did not develop in the presence of CCR6−NKp46− ILC3s rescued by the Gata3 transgene suggesting that the development of NKp46+ not only depends on GATA3 (Zhong et al., 2016), but may also require a transient induction of high GATA3 expression.
Among the transcription factors that are known to play an important role in ILC development, GATA3 and Id2 are the two most critical ones since deficiency in either molecule results in a complete loss of ILCs (Yagi et al., 2014; Yokota et al., 1999). However, they played distinct roles during this process. Id2 was required for the generation of all innate lymphocytes including ILCs, LTi cells and NK cells, on the other hand, GATA3 was essential for the development of all non-LTi ILCs, but dispensable for the development of both LTi and NK cells. This was consistent with the expression amounts of these two transcription factors --- while Id2 was highly expressed by both progenitors, GATA3 was expressed at higher amounts in the non-LTi ILC progenitors than in the LTi progenitors. Cytokine signaling is also critical for the development of ILCs. However, in the Rag2−/−γc−/− mice where mature ILCs were nearly absent in peripheral tissues, both LTi and non-LTi progenitors were normal in these mice, suggesting that transcription factor-mediated ILC lineage fate determination, particularly by GATA3 and Id2, proceeds cytokine signaling that may play a critical role in ILC homeostasis after their lineage commitment.
In conclusion, differential expression of GATA3 functionally determined the development of ILC progenitors. Distinct from a critical function of Id2 in determining the development of both LTi and non-LTi ILC progenitors, GATA3 selectively dictated the development of non-LTi ILC progenitors and the low GATA3 expression, while not essential for the development of LTi progenitors, was required for regulating LTi functions. PLZF, PD-1 and high GATA3 expression each may serve as a good marker for the non-LTi ILC progenitors. However, only GATA3 was functionally critical for the lineage commitment of this population. Since the GATA3high ILC progenitors mirror the GATA3hi CD4+CD8low transitional thymocytes that have committed to become CD4+ T cells, ILCs derived from the GATA3high ILC progenitor, but not the LTi cells, should be regarded as the bona fide innate counterparts of CD4+ T helper cells.
STAR*METHODS
LEAD CONTACT AND MATERIALS AVAILABILITY
Further information and requests for resources and reagents should be directed to and will be fulfilled by the Lead Contact, Jinfang Zhu (jfzhu@niaid.nih.gov).
EXPERIMENTAL MODEL DETAILS
Mice
Gata3fl/fl (line 355; Taconic) and Gata3fl/flVavCre (line 8446; Taconic) mice on the C57BL/6 background and TghCD2-Gata3 transgenic mouse strain have been described previously (Lesourne et al., 2009; Xiong et al., 2013; Yagi et al., 2014; Zhu et al., 2004). Gata3fl/flVavCre mice were cross-bred with the TghCD2-Gata3 transgenic mice to generate the Gata3fl/flVavCre-TghCD2-Gata3 mice. Partial description of the generation of the Id2-YFP reporter mice on the C57BL/6 background were included in the supplemental methods of a previous report (Kim et al., 2014). Id2-GFP reporter mice were purchased from the Jackson Laboratory (Stock No: 016224). The heterozygous mice were bred to generate the Id2-deficient (Id2gfp/gfp) mice. GATA-3-GFP reporter mice (Hosoya et al., 2009) on the C57BL/6 background were kindly gifted from Dr. James Douglas Engel. Id2-YFP and GATA-3-GFP mice were bred with CD45.1 congenic mice (line 7; Taconic) for transfer experiments. C57BL/6 RORγt-E2-Crimson reporter mice were described previously (Zhong et al., 2016) and were bred with the GATA-3-GFP mice in the study. RORγt fate-mapping mice were generated by breeding Rorc-Cre mice (originally from Dr. Dan R. Littman, now also available from the Jackson Laboratory as Stock No: 022791) with Rosa26TdTamato mice (Stock No: 007914; the Jackson Laboratory). Rorc+/+ and Rorcgfp/gfp (line 8475; Taconic), CD45.2 Rag2−/−Il2rg−/− (line 111; Taconic), CD45.1 Rag2−/−Il2rg−/− (line 8494; Taconic), Rag2−/− (line 103; Taconic), CD45.1/CD45.2 C57BL/6 (line 8422; Taconic), CD45.1 C57BL/6 (line 7; Taconic) and C57BL/6 mice were ordered from the Taconic or the NIAID-Taconic repository. All mice were bred and maintained in the National Institute of Allergy and Infectious Diseases specific pathogen–free animal facility. All the experiments without specification used mice at 6–16 weeks of age under an animal study protocol which was approved by the National Institute of Allergy and Infectious Diseases Animal Care and Use Committee.
Bone marrow transplant
The congenically (CD45.1, CD45.2 or CD45.1XCD45.2) marked ILC progenitors were sorted into collection tubes with CD45.2 or CD45.1 Rag2−/−Il2rg−/− splenic carrier cells and intraveneously injected into 6–8 week-old sub-lethally irradiated (550 rad) CD45.2 or CD45.1 Rag2−/−Il2rg−/− recipient mice. In some experiments, total bone marrow cells were used for transplant. Repopulated progenies in the recipients were analyzed 4–6 weeks (for ILC progenitor transfer) or 6–8 weeks (for bone marrow transfer) after cell transfer.
METHOD DETAILS
Cell preparation
For isolation of lamina propria cells, small intestines from euthanized mice were emptied of the contents, excised of Peyer’s patches, opened longitudinally and cut into 1-cm pieces. The intraepithelial lymphocytes (IEL) were dissociated from the intestine fragments by first shacking the fragments 20 min at 37 °C in RPMI-1640 medium containing 3% FBS, 5 mM EDTA and 1 mM dithiothreitol, and then vortexing the fragments three times with RPMI-1640 medium containing 2 mM EDTA. To isolate lamina propria cells, the remained fragments were minced and digested at 37 °C for 30 min in RPM I-1640 medium containing 0.1 mg/ml Liberase (Roche) and 10 U/ml DNase I (Roche). The digestion suspension was then filtered through a 40-mm cell strainer, centrifuged at 1,600 r.p.m. for 6 min, the cell pellets were washed twice and resuspended in HBSS containing 3% FBS for further analysis. For preparation of bone marrow single cell suspension, the contents of marrow were flushed out of the bone shafts with HBSS-containing 3% FBS. The cells were passed through a 40-mm cell strainer after pipetting up and down several times, and pelleted by spinning at 1,600 r.p.m. for 6 min. Bone marrow cell pellets were washed twice and resuspended in HBSS containing 3% FBS for following staining. For cell preparation from uterus and Salivary gland, these mouse tissues were processed using a protocol involving both mechanical and enzymatic processing. Finely minced tissues were digested in Liberase DH and DNase I for 35 min at 37°C with gentle orbital agit ation (80 rpm). Following digestion, tissues were passed through the cell strainer (70 μm) using a plunger to mechanically dissociate remaining tissues. After centrifuged at 1600 rpm for 6 min, the resulting cell pellet was washed with sterile PBS, centrifuged and resuspended in HBSS containing 3% FBS for following staining. For fetal Liver, single-cell suspensions were prepared directly from mouse fetal livers (E15.5).
Flow cytometry
Single-cell suspensions were preincubated with anti-CD16/32 (clone 2.4G2) for 10 mins to block the surface Fc receptors. Then, cell-surface molecules were stained with different antibody combinations for 30 min in HBSS with 3% FBS. For identifying the rChILP cells in the bone marrow, lineage staining includes antibodies against CD3, CD5, CD19, B220, Gr-1, NK1.1, CD11b, CD11c, and TER-119. For assessing peripheral ILCs, lineage markers include CD3, CD5, CD19, B220, and Gr-1. The stained cells were centrifuged at 1,600 r.p.m. for 6 min and resuspended with HBSS with 3% FBS for flow cytometry analyses on an LSR Fortessa (BD Biosciences). When an intracellular transcription factor staining was carried out, the cells were fixed and permeabilized with a Foxp3 staining buffer set (eBioscience) according to the protocol. Transcription factor staining usually lasted for more than 4 hours at 4 °C. The flow cytometry data were analyzed with FlowJo software (Tree Star). Antibodies specific to mouse CD3 (2C11), CD5 (53–7.3), CD19 (eBio1D3), B220 (RA3–6B2), Gr-1 (RB6–8C5), NK1.1 (PK136), CD11b (M1/70), CD11c (N418), TER-119 (TER-119), integrin α4β7 (DATK32), CD4 (RM4–5), NKp46 (29A1.4), Sca-1 (D7), CD25 (eBio3C7), PD-1 (J43), Eomes (Dan11mag), PLZF (9E12), CD45.1 (A20), CD45.2 (104) were purchased from eBioscience; antibodies specific to mouse CD127 (A7R34), CCR6 (29–2L17), c-Kit (2B8) were purchased from BioLegend; antibodies specific to mouse RORγt (Q31–378), GATA3 (L50–823), T-bet (O4–46), TCF1 (S33–966), Flt-3 (A2F10.1) were purchased from BD Biosciences; antibody specific to Bcl11b (D6F1) was purchased from Cell Signaling Technology; and antibody specific to T1/ST2 (DJ8) was purchased from MD Biosciences.
Cell enrichment and sorting
For progenitor transfer, RNA-Seq, and single-cell RT-PCR experiments, the indicated bone marrow ILC progenitors were collected by FACS sorting after pre-enrichment with Miltenyi microbeads. For sorting CLP and rChILP, the lineage negative cells were enriched with the “Lineage Cell Depletion Kit, mouse” from Miltenyi Biotec according to the manual. Enriched Lineage negative bone marrow cells were stained with relative antibodies followed by sorting on a cell sorter FACS Aria III (BD Biosciences) for “live Lineage−CD127+Flt-3+Integrin α4β7−Sca1+c-Kit+” CLP and “live Lineage−CD127+Flt-3−Integrin α4β7+T1/ST2−c-Κit+” rChILP. For sorting PD-1+ non-LTi ILC progenitors and CCR6+ LTi progenitors, the Fc receptor-blocked bone marrow single-cell suspension was stained with PE-conjugated anti-integrin α4β7 antibody, followed by washing and incubation with anti-PE microbeads. The samples were then applied to the Miltenyi LS columns in magnetic field and washed three times by PBS with 3% FBS according to the manufacturer’s instruction. The integrin α4β7+ cells on the column were finally flushed into a collection tube for further surface molecule staining. Non-LTi ILC progenitors (live Lineage−CD127+Flt-3−Integrin α4β7+T1/ST2−c-Κit+PD-1+CCR6−) and LTi progenitors (live Lineage−CD127+Flt-3−Integrin α4β7+T1/ST2−c-Κit+PD-1−CCR6+) were then sorted via FACS Aria III (BD Biosciences).
RNA-Seq
CLPs, total rChILPs, PD-1+ or CCR6+ progenitors described above were sorted directly into 700 μL of QIAzol Lysis Reagent in the miRNAeasy Micro Kit (QIAGEN, Cat#217084). Total RNA was extracted and RNA-Seq libraries were prepared through the Smart-seq2 method (Picelli et al., 2014) as previously described (Hu et al., 2018). Multiplex sequencing reads of 50 bp were generated by the NHLBI DNA Sequencing and Computational Biology Core. Sequence reads were mapped to mouse genome (mm9) by using bowtie 2 with default settings (Langmead and Salzberg, 2012). Gene expression was measured by RPKM (reads per kilo-base of exon per million reads) (Mortazavi et al., 2008). Differentially expressed genes were identified by edgeR 3 (Robinson et al., 2010) with the following criteria: FDR (false discovery rate) < 0.05, FC (fold change) log2≥ 1, and at least one sample’s RPKM≥1.
Single-cell multiplex RT-PCR
Single cell qPCR was carried out using the Fluidigm Biomark according to the manufacturer’s “Two step single-cell gene expression using EvaGreen Supermix on the Biomark and Biomark HD systems” protocol. Single cells were sorting into individual wells of a 96-well low-profile skirted PCR plate (Bio-rad) containing 1.2 μL 5X VILO Reaction Mix, 0.3 μL SUPERase-In (both from Life Technologies), 0.25 μL 10% IGEPAL CA-630 (Sigma-Aldrich), and 3.25 μL of nuclease-free water containing a 1:100,000 dilution of ArrayControl RNA spike-ins 1, 4, and 7 (Life technologies). Plates with sorted cells were frozen on dry ice and stored at −80°C. Frozen plates were thawed, and 0.15 μL Superscript Enzyme mix (from Life Technologies VILO kit), 0.12 μL SUPERase-in, and 0.73 μL nuclease-free water was added to each well. Reverse transcription was carried out by incubating at 25°C for 5 minutes, 50°C for 30 minutes, 60°C for 5 minutes, 70°C for 10 minutes in a PCR machine (Bio-rad C1000 with 96-well low-profile fast cycling block). Specific target amplification (STA) was then carried out by using a pool of all gene-specific primers (1 μL of each 100 μM primer stock diluted up to 200 μL total using 10 mM Tris, 0.1 mM EDTA solution (low EDTA TE)) by mixing each sample with 1.5 μL of the primer pool, 7.5 μL of Sso Advanced Preamp Mix (Bio-rad), and 0.075 μL of 0.5 M EDTA, pH 8.0. STA cycling was then performed for 21 cycles of 96°C for 5 seconds, 60°C for 4 minutes, after a 3 minute 95°C initial denaturation/polymerase activation, with thermal cycling ramp rates adjusted to 2.2°C per second. Unincorporated primers were then digested using Exonuclease I (New England Biolabs) by adding 0.6 μL Exonuclease I reaction buffer, 1.2 μL Exonuclease 1, and 4.2 μL water and incubation at 37°C for 30 minutes, 80°C for 15 minutes in a PCR machine. Samples were then diluted by adding 54 μL of low EDTA TE (10 mM Tris HCl pH 8.0. 0.1 mM EDTA), and qPCR analysis was performed on the BioMark HD according to manufacturer’s instructions. Cq data was calculated using Fluidigm software, using the linear (derivative) baseline subtraction setting.
Data analysis was performed using R (version 3.2.4). qPCR Cq values for each cell and matching flow cytometry data (obtained from FACSDiva using indexed sorting mode) were imported. Flow data was arcsinh transformed and used to define CCR6− and PD1-expressing subsets. qPCR data were transformed to 40-Cq values. To remove low quality cell samples, cells were filtered out which did not have at least 33 genes with 40-Cq expression values greater than 1. Heatmaps were created using the package pheatmap. Heatmap columns were clustered using hierarchical clustering using pheatmap default parameters (complete linkage, Euclidean distance). Diffusion map analysis was performed using the package destiny (Angerer et al., 2016). The diffusion map was created using the data consisting of WT cells; the data from the Gata3-deficient and the Id2-deficient cells were then projected onto this map using the dm.predict() function of the destiny package. For the assessment of the correlation of Gata3 and Id2 expression across cells within the subsets, spearman correlation between the indicated genes was calculated using the R function cor(); cor.test() was used to calculate correlation p values, and all pairs with correlation p values smaller than 0.05 were considered significant. Only significant correlation values were used to determine hierarchical clustering shown in the heatmaps.
QUANTIFICATION AND STATISTICAL ANALYSIS
Statistical analysis
Samples were compared with Prism 6 software (GraphPad) by a two-tailed unpaired Student’s t-test. A p-value of <0.05 was considered significant.
DATA AND CODE AVAILABILITY
RNA-Seq datasets are available in the Gene Expression Omnibus (GEO) database (http://www.ncbi.nlm.nih.gov/gds) under the accession number GSE93863.
Supplementary Material
Supplemental Figures S1-S7 in a PDF file
Supplemental Table S1 in an Excel spreadsheet (related to Figure 6): List of genes that are differentially expressed by bone marrow LTi progenitors and mature LTi cells from siLP.
KEY RESOURCES TABLE.
| REAGENT or RESOURCE | SOURCE | IDENTIFIER |
|---|---|---|
| Antibodies | ||
| eFluor 450-anti-mouse CD3e (145–2C11) | Thermo Fisher Scientific | Cat#48–0031–82; RRID: AB_10735092 |
| eFluor 450-anti-mouse CD19 (eBio1D3) | Thermo Fisher Scientific | Cat#48–0193; RRID: AB_2043815 |
| eFluor 450-anti-mouse CD45R(B220) (RA3–6B2) | Thermo Fisher Scientific | Cat#48–0452–82; RRID: AB_1548761 |
| eFluor 450-anti-mouse CD5 (53–7.3) | Thermo Fisher Scientific | Cat#48–0051–82; RRID: AB_1603250 |
| eFluor 450-anti-mouse Ly-6G/Ly-6C(Gr-1) (RB6–8C5) | Thermo Fisher Scientific | Cat#48–5931–82; RRID: AB_1548788 |
| eFluor 450-anti-mouse CD11b (M1/70) | Thermo Fisher Scientific | Cat#48–0112–82; RRID: AB_1582236 |
| eFluor 450-anti-mouse CD11c (N418) | Thermo Fisher Scientific | Cat#48–0114–82; RRID: AB_1548654 |
| eFluor 450-anti-mouse FceR1 alpha (MAR-1) | Thermo Fisher Scientific | Cat#48–5898–82; RRID: AB_2574086 |
| eFluor 450-anti-mouse NK1.1 (PK136) | Thermo Fisher Scientific | Cat#48–5941–82; RRID: AB_2043877 |
| eFluor 450-anti-mouse TER-119 (TER-119) | Thermo Fisher Scientific | Cat#48–5921–82; RRID: AB_1518808 |
| PE-anti-mouse Integrin alpha4 beta 7 (LAMP-1) (DATK-32) | Thermo Fisher Scientific | Cat#12–5887–82; RRID: AB_657803 |
| APC-anti-mouse Integrin alpha4 beta 7 (LAMP-1) (DATK-32) | Thermo Fisher Scientific | Cat#17–5887–82; RRID: AB_1210577 |
| APC-eFluor 780-anti-mouse CD4 (RM4–5) | Thermo Fisher Scientific | Cat#47–0042–82; RRID: AB_1272183 |
| Biotin-anti-mouse CD335 (NKp46) (29A1.4) | Thermo Fisher Scientific | Cat#13–3351–82; RRID: AB_2572784 |
| Alexa Fluor 700-anti-mouse Ly-6A/E (Sca-1) (D7) | Thermo Fisher Scientific | Cat#56–5981–82; RRID: AB_657836 |
| Alexa Fluor 488-anti-mouse CD25 (eBio3C7(3C7)) | Thermo Fisher Scientific | Cat#53–0253–82; RRID: AB_763471 |
| APC-eFluor 780-anti-mouse CD279 (PD-1) (J43) | Thermo Fisher Scientific | Cat#47–9985–82; RRID: AB_2574002 |
| PE-Cyanine7-anti-mouse EOMES (Dan11mag) | Thermo Fisher Scientific | Cat#25–4875–82; RRID: AB_2573454 |
| APC-anti-mouse PLZF (9E12) | Thermo Fisher Scientific | Cat#17–9322–82; RRID: AB_2637113 |
| APC-Cyanine7-anti-mouse CD45.1 (A20) | Thermo Fisher Scientific | Cat#A15415; RRID: AB_2534428 |
| Alexa Fluor 700-anti-mouse CD45.2 (104) | Thermo Fisher Scientific | Cat#56–0454–82; RRID: AB_657752 |
| PE/Cy7 anti-mouse CD127 (IL-7Rα) (A7R34) | BioLegend | Cat#135014; RRID: AB_1937265 |
| Brilliant Violet 785-anti-mouse CD127 (IL-7Rα) (A7R34) | BioLegend | Cat#135037; RRID: AB_2565269 |
| PE-anti-mouse CD196 (CCR6) (29–2L7) | BioLegend | Cat#129804; RRID: AB_1279137 |
| APC-anti-mouse CD196 (CCR6) (29–2L7) | BioLegend | Cat#129814; RRID: AB_1877147 |
| PE-anti-mouse CD117 (c-Kit) (2B8) | BioLegend | Cat#105808; RRID: AB_313217 |
| PE-CF594-anti-mouse RORγt (Q31–378) | BD Bioscience | Cat#562684; RRID: AB_2651150 |
| BV650-anti-mouse RORγt (Q31–378) | BD Bioscience | Cat#564722; RRID: AB_2738915 |
| BUV395-anti-mouse GATA3 (L50–823) | BD Bioscience | Cat#565448; RRID: AB_2739241 |
| PE-anti-mouse GATA3 (L50–823) | BD Bioscience | Cat#560074; RRID: AB_1645330 |
| PE-Cy7-anti-mouse GATA3 (L50–823) | BD Bioscience | Cat#560405; RRID: AB_1645544 |
| Alexa Fluor 647-anti-mouse T-bet (O4–46) | BD Bioscience | Cat#561267; RRID: AB_10564093 |
| BV650-anti-mouse T-bet (O4–46) | BD Bioscience | Cat#564142; RRID: AB_2738616 |
| PE-anti-mouse TCF-7/TCF-1 (S33–966) | BD Bioscience | Cat#564217; RRID: AB_2687845 |
| PE-CF594-anti-mouse CD135 (Flt-3) (A2F10.1) | BD Bioscience | Cat#562537; RRID: AB_2737639 |
| Anti-Bcl11b (D6F1) | Cell Signaling Technology | Cat#12120; RRID: AB_2797823 |
| FITC-anti-mouse Ctip2 (Bcl11b) (25B6) | Abcam | Cat#ab123449; RRID: AB_10973033 |
| Biotin-anti-mouse T1/ST2 (IL-33 R) (DJ8) | MD Biosciences | Cat#101001B; RRID: AB_947551 |
| Chemicals, Peptides, and Recombinant Proteins | ||
| DNase I | Roche | Cat#04536282001; RRID: N/A |
| Liberase DH | Roche | Cat#5401020001; RRID: N/A |
| Deposited Data | ||
| Raw Data Files for RNA Sequencing | NCBI Gene Expression Omnibus or this paper | GEO: GSE93863 |
| Raw Data Files for RNA Sequencing | Zhong et al., 2016 | GEO: GSE71198 |
| Experimental Models: Organisms/Strains | ||
| Mouse: Gata3fl/fl | NIAID –Taconic repository | line 355; PMID: 15475959; RRID: N/A |
| Mouse: Gata3fl/flVavCre | NIAID –Taconic repository | line 8446; PMID: 24631153; RRID: N/A |
| Mouse: TghCD2-Gata3 | Remy Bosselut’s lab | PMID: 23310955; RRID: N/A |
| Mouse: Id2-YFP | Jonathan Keller’s lab | PMID: 25051963; RRID: N/A |
| Mouse: Id2-GFP | The Jackson Laboratory | Cat#JAX:016224; RRID: IMSR_JAX:016224 |
| Mouse: GATA-3-GFP | James Douglas Engel’s lab | PMID: 19934022; RRID: N/A |
| Mouse: CD45.1 | NIAID – Taconic repository | line 7; RRID: N/A |
| Mouse: RORγt-E2-Crimson | Zhong et al, 2016 | PMID: 26595886; RRID: N/A |
| Mouse: Rorc-Cre | The Jackson Laboratory | Cat#JAX:022791; RRID: IMSR_JAX:022791 |
| Mouse: Rosa26TdTamato | The Jackson Laboratory | Cat#JAX:007914; RRID: IMSR_JAX:007914 |
| Mouse: Rorcgfp/+ | NIAID – Taconic repository | line 8475; RRID: N/A |
| Mouse: CD45.2 Rag2−/−Il2rg−/− | NIAID – Taconic repository | line 111; RRID: N/A |
| Mouse: Rag2−/− | NIAID – Taconic repository | line 103; RRID: N/A |
| Mouse: C57BL/6NTac | Taconic | Cat#TAC:b6; RRID: IMSR_TAC:b6 |
| Mouse: CD45.1 Rag2−/−Il2rg−/− | NIAID – Taconic repository | line 8494; RRID: N/A |
| Mouse: CD45.1/CD45.2 C57BL/6 | NIAID – Taconic repository | line 8422; RRID: N/A |
| Software and Algorithms | ||
| R 3.2.4 | R Development Core Team, 2018 | https://www.r-project.org; RRID: N/A |
| FlowJo v9 | Tree Star | https://www.flowjo.com/; RRID: N/A |
| GraphPad Prism 6 | GraphPad | https://www.graphpad.com; RRID: N/A |
Highlights.
High GATA3 expression is required for the development of non-LTi ILC progenitors.
GATA3 is dispensable for the development of RORγt-expressing LTi progenitors.
Low GATA3 expression is essential for the acquisition of LTi cell function.
GATA3 and Id2 determine ILC lineage fates before cytokine-mediated ILC maturation.
ACKNOWLEDGMENTS
We thank Drs. Remy Bosselut of NCI and Kairui Mao of Xiamen University for their critical reading of the manuscript. We also thank Dr. Remy Bosselut for providing the TghCD2-Gata3 transgenic mouse strain. This work is supported by the Division of Intramural Research of the NIAID and the NHLBI (US National Institutes of Health, 1ZIAAI001169 and 1ZIAHL006031). The generation of Id2-YFP mice has been funded in part with Federal funds from the Frederick National Laboratory for Cancer Research, NIH, under Contract HHSN261200800001E. C.Z. is also supported by the National Natural Science Foundation of China (No. 31770957, No. 91842102), and the Natural Science Foundation of Beijing (No. 18G10645).
Footnotes
DECLARATION OF INTERESTS
The authors declare no competing interests.
SUPPLEMENTAL INFORMATION
Supplemental Information can be found online at: http://dx.doi.org/10.1016/j.immuni.2019.12.001
Publisher's Disclaimer: This is a PDF file of an unedited manuscript that has been accepted for publication. As a service to our customers we are providing this early version of the manuscript. The manuscript will undergo copyediting, typesetting, and review of the resulting proof before it is published in its final form. Please note that during the production process errors may be discovered which could affect the content, and all legal disclaimers that apply to the journal pertain.
REFERENCES
- Angerer P, Haghverdi L, Buttner M, Theis FJ, Marr C, and Buettner F (2016). destiny: diffusion maps for large-scale single-cell data in R. Bioinformatics 32, 1241–1243. [DOI] [PubMed] [Google Scholar]
- Artis D, and Spits H (2015). The biology of innate lymphoid cells. Nature 517, 293–301. [DOI] [PubMed] [Google Scholar]
- Bernink JH, Ohne Y, Teunissen MBM, Wang J, Wu J, Krabbendam L, Guntermann C, Volckmann R, Koster J, van Tol S, et al. (2019). c-Kit-positive ILC2s exhibit an ILC3-like signature that may contribute to IL-17-mediated pathologies. Nature immunology 20, 992–1003. [DOI] [PubMed] [Google Scholar]
- Califano D, Cho JJ, Uddin MN, Lorentsen KJ, Yang Q, Bhandoola A, Li H, and Avram D (2015). Transcription Factor Bcl11b Controls Identity and Function of Mature Type 2 Innate Lymphoid Cells. Immunity 43, 354–368. [DOI] [PMC free article] [PubMed] [Google Scholar]
- Constantinides MG, McDonald BD, Verhoef PA, and Bendelac A (2014). A committed precursor to innate lymphoid cells. Nature 508, 397–401. [DOI] [PMC free article] [PubMed] [Google Scholar]
- Diefenbach A, Colonna M, and Koyasu S (2014). Development, differentiation, and diversity of innate lymphoid cells. Immunity 41, 354–365. [DOI] [PMC free article] [PubMed] [Google Scholar]
- Eberl G, Marmon S, Sunshine MJ, Rennert PD, Choi YW, and Littman DR (2004). An essential function for the nuclear receptor ROR gamma t in the generation of fetal lymphoid tissue inducer cells. Nature immunology 5, 64–73. [DOI] [PubMed] [Google Scholar]
- Fallon PG, Ballantyne SJ, Mangan NE, Barlow JL, Dasvarma A, Hewett DR, McIlgorm A, Jolin HE, and McKenzie AN (2006). Identification of an interleukin (IL)-25-dependent cell population that provides IL-4, IL-5, and IL-13 at the onset of helminth expulsion. The Journal of experimental medicine 203, 1105–1116. [DOI] [PMC free article] [PubMed] [Google Scholar]
- Fang D, and Zhu J (2017). Dynamic balance between master transcription factors determines the fates and functions of CD4 T cell and innate lymphoid cell subsets. The Journal of experimental medicine 214, 1861–1876. [DOI] [PMC free article] [PubMed] [Google Scholar]
- Furusawa J, Moro K, Motomura Y, Okamoto K, Zhu J, Takayanagi H, Kubo M, and Koyasu S (2013). Critical role of p38 and GATA3 in natural helper cell function. J Immunol 191, 1818–1826. [DOI] [PMC free article] [PubMed] [Google Scholar]
- Harly C, Cam M, Kaye J, and Bhandoola A (2018). Development and differentiation of early innate lymphoid progenitors. The Journal of experimental medicine 215, 249–262. [DOI] [PMC free article] [PubMed] [Google Scholar]
- Ho IC, Tai TS, and Pai SY (2009). GATA3 and the T-cell lineage: essential functions before and after T-helper-2-cell differentiation. Nature reviews 9, 125–135. [DOI] [PMC free article] [PubMed] [Google Scholar]
- Hosoya T, Kuroha T, Moriguchi T, Cummings D, Maillard I, Lim KC, and Engel JD (2009). GATA-3 is required for early T lineage progenitor development. The Journal of experimental medicine 206, 2987–3000. [DOI] [PMC free article] [PubMed] [Google Scholar]
- Hoyler T, Klose CS, Souabni A, Turqueti-Neves A, Pfeifer D, Rawlins EL, Voehringer D, Busslinger M, and Diefenbach A (2012). The transcription factor GATA-3 controls cell fate and maintenance of type 2 innate lymphoid cells. Immunity 37, 634–648. [DOI] [PMC free article] [PubMed] [Google Scholar]
- Hu G, Cui K, Fang D, Hirose S, Wang X, Wangsa D, Jin W, Ried T, Liu P, Zhu J, et al. (2018). Transformation of Accessible Chromatin and 3D Nucleome Underlies Lineage Commitment of Early T Cells. Immunity 48, 227–242 e228. [DOI] [PMC free article] [PubMed] [Google Scholar]
- Ishizuka IE, Chea S, Gudjonson H, Constantinides MG, Dinner AR, Bendelac A, and Golub R (2016). Single-cell analysis defines the divergence between the innate lymphoid cell lineage and lymphoid tissue-inducer cell lineage. Nature immunology 17, 269–276. [DOI] [PMC free article] [PubMed] [Google Scholar]
- Kim W, Klarmann KD, and Keller JR (2014). Gfi-1 regulates the erythroid transcription factor network through Id2 repression in murine hematopoietic progenitor cells. Blood 124, 1586–1596. [DOI] [PMC free article] [PubMed] [Google Scholar]
- Klein Wolterink RG, Serafini N, van Nimwegen M, Vosshenrich CA, de Bruijn MJ, Fonseca Pereira D, Veiga Fernandes H, Hendriks RW, and Di Santo JP (2013). Essential, dose-dependent role for the transcription factor Gata3 in the development of IL-5+ and IL-13+ type 2 innate lymphoid cells. Proceedings of the National Academy of Sciences of the United States of America 110, 10240–10245. [DOI] [PMC free article] [PubMed] [Google Scholar]
- Klose CS, Flach M, Mohle L, Rogell L, Hoyler T, Ebert K, Fabiunke C, Pfeifer D, Sexl V, Fonseca-Pereira D, et al. (2014). Differentiation of type 1 ILCs from a common progenitor to all helper-like innate lymphoid cell lineages. Cell 157, 340–356. [DOI] [PubMed] [Google Scholar]
- Koues OI, Collins PL, Cella M, Robinette ML, Porter SI, Pyfrom SC, Payton JE, Colonna M, and Oltz EM (2016). Distinct Gene Regulatory Pathways for Human Innate versus Adaptive Lymphoid Cells. Cell 165, 1134–1146. [DOI] [PMC free article] [PubMed] [Google Scholar]
- Langmead B, and Salzberg SL (2012). Fast gapped-read alignment with Bowtie 2. Nat Methods 9, 357–359. [DOI] [PMC free article] [PubMed] [Google Scholar]
- Lesourne R, Uehara S, Lee J, Song KD, Li L, Pinkhasov J, Zhang Y, Weng NP, Wildt KF, Wang L, et al. (2009). Themis, a T cell-specific protein important for late thymocyte development. Nature immunology 10, 840–847. [DOI] [PMC free article] [PubMed] [Google Scholar]
- Mebius RE (2003). Organogenesis of lymphoid tissues. Nature reviews 3, 292–303. [DOI] [PubMed] [Google Scholar]
- Mjosberg J, Bernink J, Golebski K, Karrich JJ, Peters CP, Blom B, te Velde AA, Fokkens WJ, van Drunen CM, and Spits H (2012). The transcription factor GATA3 is essential for the function of human type 2 innate lymphoid cells. Immunity 37, 649–659. [DOI] [PubMed] [Google Scholar]
- Mohrs M, Shinkai K, Mohrs K, and Locksley RM (2001). Analysis of type 2 immunity in vivo with a bicistronic IL-4 reporter. Immunity 15, 303–311. [DOI] [PubMed] [Google Scholar]
- Mortazavi A, Williams BA, McCue K, Schaeffer L, and Wold B (2008). Mapping and quantifying mammalian transcriptomes by RNA-Seq. Nat Methods 5, 621–628. [DOI] [PubMed] [Google Scholar]
- Okubo Y, Tokumaru S, Yamamoto Y, Miyagawa SI, Sanjo H, and Taki S (2019). Generation of a common innate lymphoid cell progenitor requires interferon regulatory factor 2. Int Immunol 31, 489–498. [DOI] [PubMed] [Google Scholar]
- Picelli S, Faridani OR, Bjorklund AK, Winberg G, Sagasser S, and Sandberg R (2014). Full-length RNA-seq from single cells using Smart-seq2. Nat Protoc 9, 171–181. [DOI] [PubMed] [Google Scholar]
- Rankin LC, Girard-Madoux MJ, Seillet C, Mielke LA, Kerdiles Y, Fenis A, Wieduwild E, Putoczki T, Mondot S, Lantz O, et al. (2016). Complementarity and redundancy of IL-22-producing innate lymphoid cells. Nature immunology 17, 179–186. [DOI] [PMC free article] [PubMed] [Google Scholar]
- Ricardo-Gonzalez RR, Van Dyken SJ, Schneider C, Lee J, Nussbaum JC, Liang HE, Vaka D, Eckalbar WL, Molofsky AB, Erle DJ, and Locksley RM (2018). Tissue signals imprint ILC2 identity with anticipatory function. Nature immunology 19, 1093–1099. [DOI] [PMC free article] [PubMed] [Google Scholar]
- Robinson MD, McCarthy DJ, and Smyth GK (2010). edgeR: a Bioconductor package for differential expression analysis of digital gene expression data. Bioinformatics 26, 139–140. [DOI] [PMC free article] [PubMed] [Google Scholar]
- Seehus CR, Aliahmad P, de la Torre B, Iliev ID, Spurka L, Funari VA, and Kaye J (2015). The development of innate lymphoid cells requires TOX-dependent generation of a common innate lymphoid cell progenitor. Nature immunology 16, 599–608. [DOI] [PMC free article] [PubMed] [Google Scholar]
- Seillet C, Mielke LA, Amann-Zalcenstein DB, Su S, Gao J, Almeida FF, Shi W, Ritchie ME, Naik SH, Huntington ND, et al. (2016). Deciphering the Innate Lymphoid Cell Transcriptional Program. Cell reports 17, 436–447. [DOI] [PubMed] [Google Scholar]
- Serafini N, Klein Wolterink RG, Satoh-Takayama N, Xu W, Vosshenrich CA, Hendriks RW, and Di Santo JP (2014). Gata3 drives development of RORgammat+ group 3 innate lymphoid cells. The Journal of experimental medicine 211, 199–208. [DOI] [PMC free article] [PubMed] [Google Scholar]
- Shih HY, Sciume G, Mikami Y, Guo L, Sun HW, Brooks SR, Urban JF Jr., Davis FP, Kanno Y, and O’Shea JJ (2016). Developmental Acquisition of Regulomes Underlies Innate Lymphoid Cell Functionality. Cell 165, 1120–1133. [DOI] [PMC free article] [PubMed] [Google Scholar]
- Song C, Lee JS, Gilfillan S, Robinette ML, Newberry RD, Stappenbeck TS, Mack M, Cella M, and Colonna M (2015). Unique and redundant functions of NKp46+ ILC3s in models of intestinal inflammation. The Journal of experimental medicine 212, 1869–1882. [DOI] [PMC free article] [PubMed] [Google Scholar]
- Walker JA, Clark PA, Crisp A, Barlow JL, Szeto A, Ferreira ACF, Rana BMJ, Jolin HE, Rodriguez-Rodriguez N, Sivasubramaniam M, et al. (2019). Polychromic Reporter Mice Reveal Unappreciated Innate Lymphoid Cell Progenitor Heterogeneity and Elusive ILC3 Progenitors in Bone Marrow. Immunity 51, 104–118 e107. [DOI] [PMC free article] [PubMed] [Google Scholar]
- Walker JA, Oliphant CJ, Englezakis A, Yu Y, Clare S, Rodewald HR, Belz G, Liu P, Fallon PG, and McKenzie AN (2015). Bcl11b is essential for group 2 innate lymphoid cell development. The Journal of experimental medicine 212, 875–882. [DOI] [PMC free article] [PubMed] [Google Scholar]
- Wang L, Wildt KF, Zhu J, Zhang X, Feigenbaum L, Tessarollo L, Paul WE, Fowlkes BJ, and Bosselut R (2008). Distinct functions for the transcription factors GATA-3 and ThPOK during intrathymic differentiation of CD4(+) T cells. Nature immunology 9, 1122–1130. [DOI] [PMC free article] [PubMed] [Google Scholar]
- Xiong Y, Castro E, Yagi R, Zhu J, Lesourne R, Love PE, Feigenbaum L, and Bosselut R (2013). Thpok-independent repression of Runx3 by Gata3 during CD4+ T-cell differentiation in the thymus. European journal of immunology 43, 918–928. [DOI] [PMC free article] [PubMed] [Google Scholar]
- Xu W, Cherrier DE, Chea S, Vosshenrich C, Serafini N, Petit M, Liu P, Golub R, and Di Santo JP (2019). An Id2(RFP)-Reporter Mouse Redefines Innate Lymphoid Cell Precursor Potentials. Immunity 50, 1054–1068 e1053. [DOI] [PMC free article] [PubMed] [Google Scholar]
- Yagi R, Zhong C, Northrup DL, Yu F, Bouladoux N, Spencer S, Hu G, Barron L, Sharma S, Nakayama T, et al. (2014). The transcription factor GATA3 is critical for the development of all IL-7Ralpha-expressing innate lymphoid cells. Immunity 40, 378–388. [DOI] [PMC free article] [PubMed] [Google Scholar]
- Yang Q, Li F, Harly C, Xing S, Ye L, Xia X, Wang H, Wang X, Yu S, Zhou X, et al. (2015). TCF-1 upregulation identifies early innate lymphoid progenitors in the bone marrow. Nature immunology 16, 1044–1050. [DOI] [PMC free article] [PubMed] [Google Scholar]
- Yang Q, Monticelli LA, Saenz SA, Chi AW, Sonnenberg GF, Tang J, De Obaldia ME, Bailis W, Bryson JL, Toscano K, et al. (2013). T cell factor 1 is required for group 2 innate lymphoid cell generation. Immunity 38, 694–704. [DOI] [PMC free article] [PubMed] [Google Scholar]
- Yokota Y, Mansouri A, Mori S, Sugawara S, Adachi S, Nishikawa S, and Gruss P (1999). Development of peripheral lymphoid organs and natural killer cells depends on the helix-loop-helix inhibitor Id2. Nature 397, 702–706. [DOI] [PubMed] [Google Scholar]
- Yu Y, Tsang JC, Wang C, Clare S, Wang J, Chen X, Brandt C, Kane L, Campos LS, Lu L, et al. (2016). Single-cell RNA-seq identifies a PD-1hi ILC progenitor and defines its development pathway. Nature 539, 102–106. [DOI] [PubMed] [Google Scholar]
- Yu Y, Wang C, Clare S, Wang J, Lee SC, Brandt C, Burke S, Lu L, He D, Jenkins NA, et al. (2015). The transcription factor Bcl11b is specifically expressed in group 2 innate lymphoid cells and is essential for their development. The Journal of experimental medicine 212, 865–874. [DOI] [PMC free article] [PubMed] [Google Scholar]
- Zhong C, Cui K, Wilhelm C, Hu G, Mao K, Belkaid Y, Zhao K, and Zhu J (2016). Group 3 innate lymphoid cells continuously require the transcription factor GATA-3 after commitment. Nature immunology 17, 169–178. [DOI] [PMC free article] [PubMed] [Google Scholar]
- Zhong C, Zheng M, and Zhu J (2018). Lymphoid tissue inducer-A divergent member of the ILC family. Cytokine Growth Factor Rev 42, 5–12. [DOI] [PMC free article] [PubMed] [Google Scholar]
- Zhong C, and Zhu J (2017). Transcriptional regulators dictate innate lymphoid cell fates. Protein Cell. [DOI] [PMC free article] [PubMed] [Google Scholar]
- Zhu J, Min B, Hu-Li J, Watson CJ, Grinberg A, Wang Q, Killeen N, Urban JF Jr., Guo L, and Paul WE (2004). Conditional deletion of Gata3 shows its essential function in T(H)1-T(H)2 responses. Nature immunology 5, 1157–1165. [DOI] [PubMed] [Google Scholar]
- Zook EC, and Kee BL (2016). Development of innate lymphoid cells. Nature immunology 17, 775–782. [DOI] [PubMed] [Google Scholar]
Associated Data
This section collects any data citations, data availability statements, or supplementary materials included in this article.
Supplementary Materials
Supplemental Figures S1-S7 in a PDF file
Supplemental Table S1 in an Excel spreadsheet (related to Figure 6): List of genes that are differentially expressed by bone marrow LTi progenitors and mature LTi cells from siLP.
Data Availability Statement
RNA-Seq datasets are available in the Gene Expression Omnibus (GEO) database (http://www.ncbi.nlm.nih.gov/gds) under the accession number GSE93863.