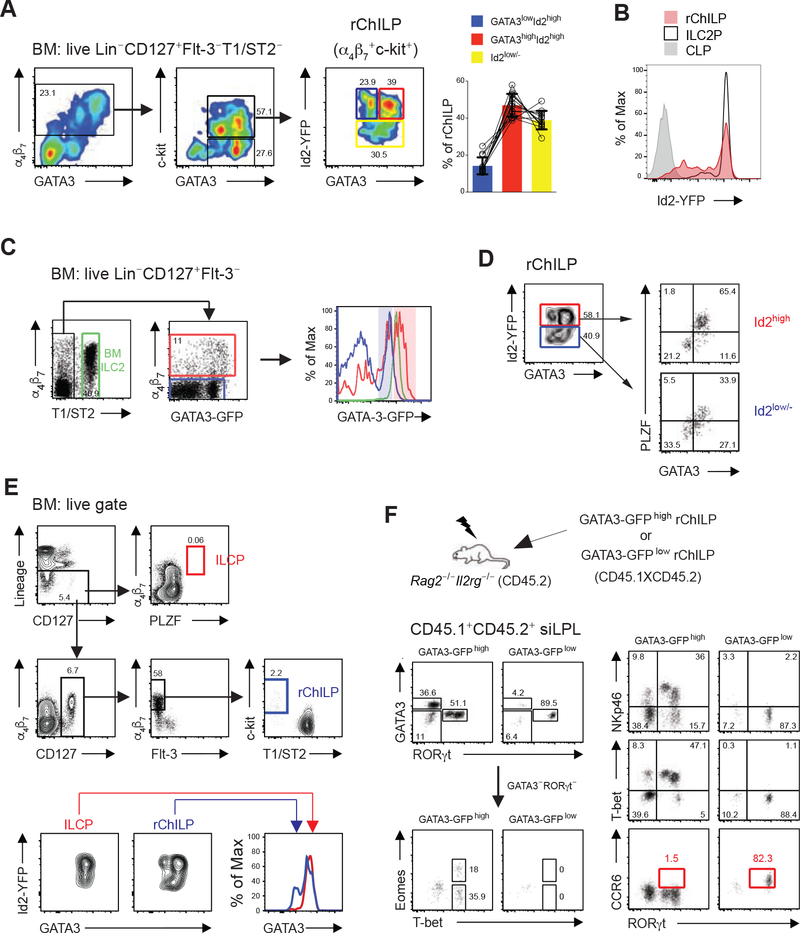
Figure 3. Heterogeneity of Refined ChILP Cells Separated by the Differential Expression of GATA3 and Id2.
(A) A refined ChILP (rChILP) population in the BM was defined as the live Lin−CD127+Flt-3−T1/ST2−α4β7+c-Kit+ cells. The expression of GATA3 and Id2, and the proportions of three subsets with different GATA3 and Id2 expression among the rChILP cells were analyzed.
(B) Differential Id2-YFP expression in CLPs (live Lin−CD127+Flt-3+α4β7−Sca1+c-Kit+), rChILPs (live Lin−CD127+Flt-3−T1/ST2−α4β7+c-Kit+) and ILC2Ps (live Lin−CD127+Flt-3−α4β7+T1/ST2+) in the bone marrow.
(C) The GATA3 expression difference among the Lin−CD127+Flt-3−T1/ST2−α4β7+ including the rChILPs (red gate and red line) was further confirmed with a GATA3-GFP reporter mouse. Within the live Lin−CD127+Flt-3− BM cells, GATA3 level in the T1/ST2+ BM ILC2s (green gate and line) and the α4β7− cells (blue gate and line) were used as references for the GATA3 high- and negative/low- expression. The pink and blue shadows indicated the high and low amounts of GATA3-GFP.
(D) Id2high and Id2low/− rChILP cells were further analyzed for their expression association between GATA3 and PLZF.
(E) The previously defined Lin−PLZF+ ILC progenitors (ILCPs) (red gate and line) were compared with the rChILP cells (blue gate and line) in the same sample for Id2 and GATA3 expression.
(F) The GATA3high and GATA3low rChILP subsets were isolated from the GATA3-GFP reporter mice bearing a congenic marker (CD45.1XCD45.2) by cell sorting (see also Figure S3H), and were subsequently transferred into sublethally irradiated Rag2−/−Il2rg−/− recipients (CD45.2). After 4–6 weeks, the repopulated progenies derived from the CD45.1+CD45.2+ donor cells were analyzed in the siLPL of recipients. GATA3, RORγt, NKp46, T-bet, Eomes and CCR6 were used to distinguish distinct innate lymphoid populations, among which the CCR6+ cells (red gate) represent the LTi/LTi-like cells.
Data are representative of three (A-E) and two (F) independent experiments.
See also Figure S3.

