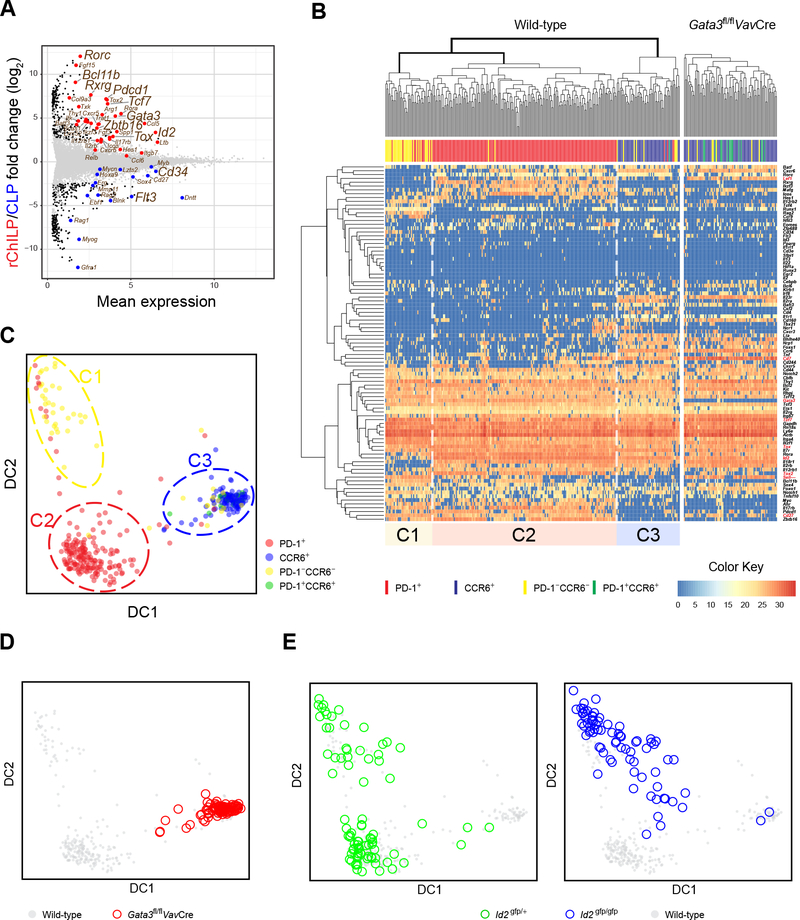
Figure 5. Single-Cell Gene Expression Analyses Confirm an Essential but Different Role of Id2 and GATA3 during ILC Lineage Specification.
(A) The rChILP and CLP cells were isolated by cell sorting. Their gene expression were analyzed by RNA-Seq and compared with an MA plot.
(B) The rChILP cells from C57BL/6 WT mice (left) and the Gata3fl/flVavCre mice (right) were index sorted. Their PD-1 and CCR6 expression based on the flow cytometric record is indicated by distinct colors. The expression of 92 selected genes and the 18sRNA in the sorted cells together with three spike RNAs were analyzed with single cell RT-qPCR on the Fludigm’s 96.96 chips. Based on the gene expression pattern, the WT rChILP cells were clustered into three subsets, C1, C2, and C3. C1 enriched for Id2low/− progenitors, while C2 and C3 represent PD-1-expressing non-LTi progenitors and CCR6-expressing LTi progenitors, respectively.
(C) Clustering of the rChILP cells based on the gene expression analyses at the single cell level shown in (B) was also displayed via a diffusion map algorithm. Each dot represents a single cell and its color indicates the expression of PD-1 and CCR6 from the flow cytometric data.
(D) The clustering analysis of the rChILP cells in (C) was applied to the rChILP cells from the Gata3fl/flVavCre mice.
(E) The rChILPs were sorted from the Id2gfp/+ and Id2gfp/gfp mice respectively, followed by single cell RT-qPCR gene expression analysis shown in (B). The cell clustering analysis in (C) was then applied to assess the effect of Id2 deficiency on rChILP subset development.
Data are from two biological duplicates (A) and pooled from two (B-E) independent experiments.
See also Figure S5.

