Abstract
The Fontan procedure for univentricular heart defects creates a nonphysiologic circulation where systemic venous blood drains directly into the pulmonary arteries, leading to multiorgan dysfunction secondary to chronic low-shear nonpulsatile pulmonary blood flow and central venous hypertension. Although blood viscosity increases exponentially in this low-shear environment, the role of shear-dependent (“non-Newtonian”) blood viscosity in this pathophysiology is unclear. We studied three-dimensional (3D)-printed Fontan models in an in vitro flow loop with a Philips 3-T magnetic resonance imaging (MRI) scanner. A 4D flow phase-contrast sequence was used to acquire a time-varying 3D velocity field for each experimental condition. On the basis of blood viscosity of a cohort of patients who had undergone the Fontan procedure, it was decided to use 0.04% xanthan gum as a non-Newtonian blood analog; 45% glycerol was used as a Newtonian control fluid. MRI data were analyzed using GTFlow and MATLAB software. The primary outcome, power loss, was significantly higher with the Newtonian fluid [14.8 (13.3, 16.4) vs. 8.1 (6.4, 9.8)%, medians with 95% confidence interval, P < 0.0001]. The Newtonian fluid also demonstrated marginally higher right pulmonary artery flow, marginally lower shear stress, and a trend toward higher caval flow mixing. Outcomes were modulated by Fontan model complexity, cardiac output, and caval flow ratio. Vortexes, helical flow, and stagnant flow were more prevalent with the non-Newtonian fluid. Our data demonstrate that shear-dependent viscosity significantly alters qualitative flow patterns, power loss, pulmonary flow distribution, shear stress, and caval flow mixing in synthetic models of the Fontan circulation. Potential clinical implications include effects on exercise capacity, ventilation-perfusion matching, risk of pulmonary arteriovenous malformations, and risk of thromboembolism.
NEW & NOTEWORTHY Although blood viscosity increases exponentially in low-shear environments, the role of shear-dependent (“non-Newtonian”) blood viscosity in the pathophysiology of the low-shear Fontan circulation is unclear. We demonstrate that shear-dependent viscosity significantly alters qualitative flow patterns, power loss, pulmonary flow distribution, shear stress, and caval flow mixing in synthetic models of the Fontan circulation. Potential clinical implications include effects on exercise capacity, ventilation-perfusion matching, risk of pulmonary arteriovenous malformations, and risk of thromboembolism.
Keywords: cardiac magnetic resonance imaging, fluid dynamics, Fontan procedure, rheology, single ventricle
INTRODUCTION
The Fontan procedure, the final stage of surgical palliation for children born with univentricular heart defects, creates a nonphysiologic circulation where systemic venous blood bypasses the heart and drains directly into the pulmonary arteries (24). Although the procedure has markedly improved long-term survival in these patients, nearly half of patients who have undergone the Fontan procedure develop significant comorbidities such as ventricular dysfunction, reduced exercise performance, arrhythmia, thromboembolism, and protein-losing enteropathy (4, 37). Furthermore, in the modern surgical era there is still an estimated 20% mortality at 20 yr in those who survive the Fontan surgery (32).
In completing the total cavopulmonary connection (TCPC), the Fontan procedure by its very design results in low-shear nonpulsatile pulmonary blood flow and central venous hypertension (18). Interestingly, although all patients have the same fundamentally abnormal circulation, the variability in timing and presentation of Fontan failure is currently unexplained (9). Many patient-specific factors such as blood vessel sizes, position and shape of surgical anastomoses, and pulmonary blood flow distribution affect the energetic efficiency of the circulation (36). Conceptually patients with elevated pulmonary vascular resistance (PVR) should also have worse outcomes, since high PVR should limit flow through the passive Fontan circuit. According to Poiseuille’s law, resistance to blood flow through a blood vessel is determined by
where η is blood viscosity, l is the blood vessel length, and r is the blood vessel radius (33). Although clinicians recognize the importance of eliminating stenoses (i.e., increasing blood vessel radius) in the Fontan circuit to ensure adequate pulmonary blood flow, the impact of blood viscosity on flow through the Fontan circuit has largely been ignored.
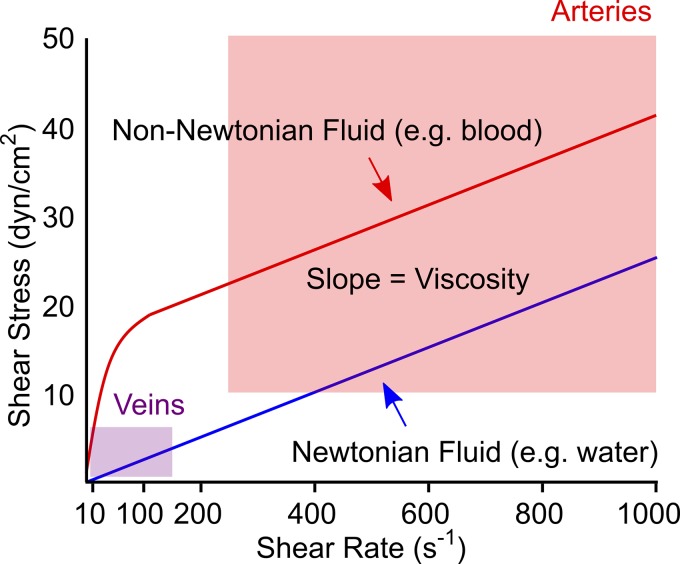
Patient-specific computational fluid dynamic modeling has provided some insights into the pathophysiology of Fontan failure. Studies by Yoganathan, Fogel, and colleagues demonstrated that power loss across the Fontan circuit is a primary contributor to decreased exercise capacity and that power loss increases with cardiac output and somatic growth (25, 34). For simplification, computational and experimental models of the Fontan circulation have assumed blood to be a Newtonian fluid with constant viscosity that is independent of shear rate (40, 42). However, blood is a non-Newtonian fluid with viscosity that increases exponentially at shear rates <100 s−1 (Fig. 1; 6). Since shear rates in large veins are typically ~10 s−1 (8), non-Newtonian behavior should be critically important in the Fontan circulation, where the pulmonary arteries are directly supplied by central veins.
Fig. 1.
Relationship between viscosity, shear rate, and shear stress for a Newtonian fluid vs. a shear-thinning non-Newtonian fluid with the same asymptotic viscosity. Blood viscosity increases exponentially at shear rates <100 s−1 and is essentially constant (Newtonian) at shear rates above 100–200 s−1 (6). Shaded boxes indicate typical ranges of mean shear stress and shear rate in veins and arteries (8, 27, 31).
We previously demonstrated that non-Newtonian behavior negatively impacts pulmonary blood flow in children with Glenn and Fontan circulations (11) and alters power loss, flows, and wall shear stress in a simplified synthetic model of the Fontan circulation (10). Expanding upon these observations, the goal of this study was to use four-dimensional (4D) flow magnetic resonance imaging (MRI) to evaluate how realistic non-Newtonian viscosity affects flow in patient-specific experimental models of the Fontan circulation. We hypothesized that compared with a Newtonian fluid, a non-Newtonian fluid would demonstrate different flow profiles, increased power loss, decreased mixing of inlet flow streams, and higher shear stress.
METHODS
Fluids
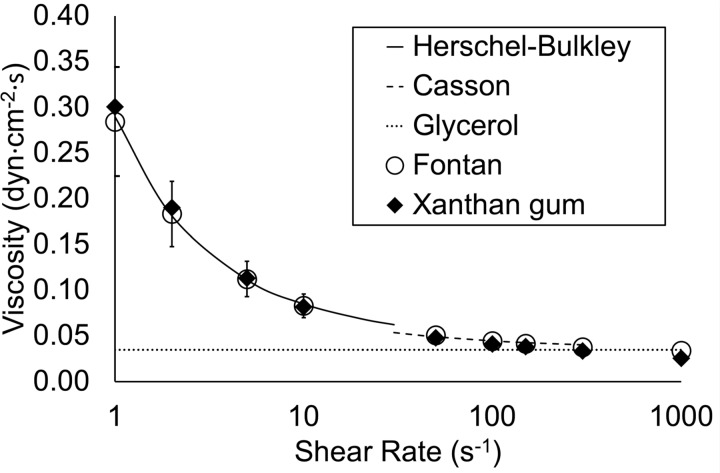
In our prior work, we determined that a solution of 0.04% by weight xanthan gum in water has viscosity characteristics similar to those of the blood of a typical patient who had undergone the Fontan procedure (11). We used this solution as an experimental non-Newtonian fluid for this study. Using a DV2T cone/plate viscometer (Brookfield AMETEK, Middleboro, MA), we measured dynamic viscosity at 37°C at 12 shear rates in the range of 1–1,000 s−1. For interpolation between data points we used a Herschel–Bulkley fluid model for shear rates of 0–30 s−1 and a Casson fluid model for shear rates of 30–300 s−1 (41). For shear rates >300 s−1, we assumed a constant Newtonian viscosity of 3.5 cP (41). The density of the xanthan gum solution was 913.3 kg/m3. We used a solution of 45% glycerol by volume in water as a control Newtonian fluid with constant viscosity of 3.5 cP. The density of the glycerol solution was 1,099.3 kg/m3. The viscosity curves of the solutions are illustrated in Fig. 2. Gadobutrol (1 mL/L, Gadavist; Bayer Healthcare, Whippany, NJ) was added to each solution as an MRI contrast agent; the addition of contrast at this low concentration had no detectable effect on viscosity.
Fig. 2.
Viscosity characteristics of the experimental (xanthan gum) and control (glycerol) fluids. Herschel-Bulkley and Casson fluid models were used to interpolate between data points for xanthan gum. Standard deviation bars are shown for the Fontan cohort.
Fontan Circuit Model
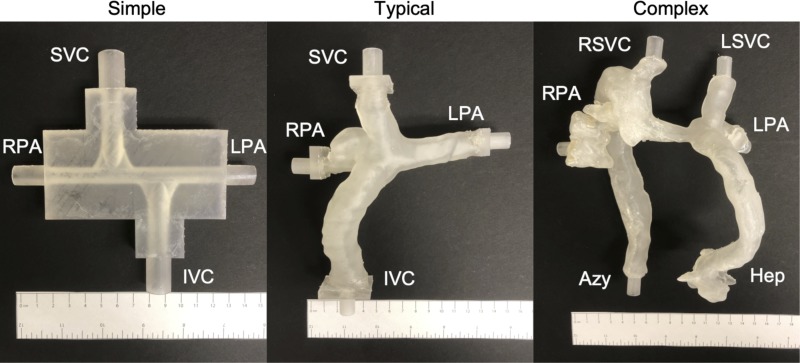
We evaluated three different models of the TCPC (which includes the Glenn shunt, Fontan conduit, and pulmonary arteries) as shown in Fig. 3. We designed a simplified symmetric model (“simple”) using computer-aided design software (Tinkercad, Autodesk, San Rafael, CA). We segmented two patient-specific models, one of a typical patient who had undergone the Fontan procedure (“typical”) and one of a patient with heterotaxy syndrome who had undergone the Fontan procedure (“complex”), from cardiac MRI studies using 3D Slicer 4.6 (https://www.slicer.org/; 17) and Meshmixer 11.0 (Autodesk) software. We then used a 3D printer (Form 2; Formlabs, Somerville, MA) to build the models from translucent rigid photopolymer resin.
Fig. 3.
Three-dimensional printed models of the total cavopulmonary connection. The superior vena cava [SVC, right superior vena cava (RSVC), and left superior vena cava (LSVC)], inferior vena cava (IVC), azygous vein (Azy), and hepatic veins (Hep) are inlets. The right and left pulmonary arteries (RPA and LPA, respectively) are outlets.
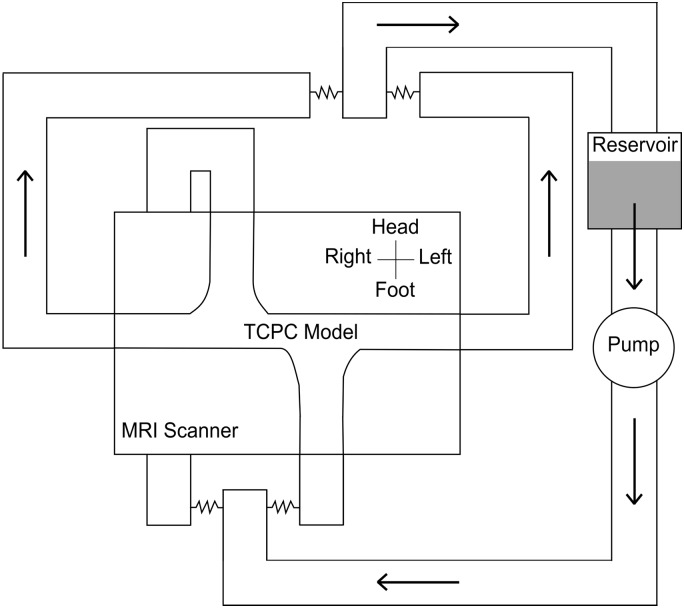
We placed each model into a circulatory flow loop made from flexible polyvinyl chloride tubing (Fig. 4). A centrifugal pump (S-MOT100; Orqis Medical, Lake Forest, CA) supplied steady nonpulsatile flow from a fluid reservoir into the flow loop. Using adjustable external clamps, we adjusted the resistance of the inlet limbs to change the flow ratio on the basis of the experimental condition. The resistances of the outlet limbs, the right and left pulmonary arteries (RPA and LPA, respectively), were equal. We monitored pressure at each inlet and outlet with fiber-optic sensors (LifeSens with OPP-M; OpSens Solutions, Quebec, QC, Canada).
Fig. 4.
Schematic of circulatory flow loop. MRI, magnetic resonance imaging; TCPC, total cavopulmonary connection.
We set total flow rate into the circuit at either 1.5 L/min (low) or 3.5 L/min (high). We adjusted the resistance of the inlet limbs with external clamps to achieve a flow split between the inferior vena cava (IVC) and superior vena cava (SVC) of either 50:50 or 60:40 [60:40 split between the lower body (hepatic and azygous veins) and upper body (right and left SVC) in the case of the complex model]. This yielded 4 experimental conditions per model and a total of 12 experimental conditions.
Cardiac MRI
We scanned the TCPC models with a 3-T Philips Achieva MRI system (Philips Healthcare, Best, The Netherlands). A simulated ECG signal was used to generate a cardiac cycle length of 1,000 ms (60 beats/min). First, a 2D phase-contrast sequence was used to measure flow at each inlet and outlet. On the basis of these flow measurements, we adjusted the pump speed to achieve the target flow rate. Next, a 4D flow phase-contrast sequence was performed to obtain a time-varying 3D velocity field of the entire TCPC model. Scan parameters for the 4D flow sequence were spatial resolution 0.8 mm3, temporal resolution 33 ms, echo time 2.5 ms, repetition time 4.5 ms, flip angle 15°, sensitivity encoding factor 2–3, and velocity encoding 150 cm/s. Acquisition time ranged from 15 to 20 min per experimental condition. The 2D phase-contrast sequence parameters were similar except that temporal resolution was 20 ms.
We postprocessed the 4D flow data using GTFlow 3.1.3 software (Gyrotools, Zurich, Switzerland), first masking areas outside of the region of interest and correcting for eddy current-induced phase offsets. We used pathline analysis to observe qualitative differences in flow patterns between the two fluids, in particular noting areas of recirculation or vortexes. We placed contours at each inlet and outlet to measure flow and velocity through each vessel and to perform particle-tracking experiments to quantify mixing of inlet flow streams. For the particle-tracking experiments, 10,000 particles were emitted from each inlet at five time points throughout the cardiac cycle, and the numbers of particles arriving at each outlet were tabulated.
Outcomes
Our primary outcome was power loss. Power loss was first calculated as
where p, ρ, v, and Q are hydrostatic pressure, blood density, mean velocity, and flow rate across the vessel cross section, respectively (25). For each experimental condition, we performed 50 independent pressure and velocity measurements. Since the 4D phase-contrast velocity and flow measurements tended to underestimate measurements made by 2D phase contrast, we used the 2D phase-contrast measurements in the power loss calculations and pulmonary flow calculations described below. Since power loss is dependent on flow rate and fluid density, we then calculated a flow-independent indexed power loss as
where ρ is fluid density and Qs is total systemic blood flow (25). We also calculated power loss as a percentage as an alternative means of accounting for these differences.
Our secondary outcomes were pulmonary flow distribution, caval flow mixing, and mean shear stress. Pulmonary flow distribution was quantified as indexed RPA flow (RPA flow divided by SVC flow) and RPA flow percentage. Since our models only had two outlets, LPA flows could easily be inferred from RPA flows. Caval flow mixing was defined as the number of particles crossing from each inlet to the contralateral outlet divided by the total number of particles emitted. To calculate shear stress, we used in-house MATLAB code (The MathWorks, Natick, MA) to first calculate shear rate (˙γ) at each voxel by
where u, v, and w are velocities in the x, y, and z directions, respectively (19). We used a finite difference approximation to calculate each differential quantity. Viscosity was calculated at each voxel using the shear rate and the xanthan gum viscosity curve in Fig. 2. We then calculated shear stress at each voxel as the product of viscosity and shear rate. Finally, we averaged shear stress over the entire TCPC model and the cardiac cycle.
Statistical Analysis
We utilized Somers’ D with confidence intervals to assess the difference in median in outcomes between the two fluids. To evaluate the difference in outcomes between the two fluids under individual experimental conditions, we used Mood’s median test and then the Bonferroni method for multiple comparisons to calculate adjusted P values. For caval flow mixing, since there was 0% mixing observed in several conditions, the Bonferroni method did not yield a converging solution for this analysis. Therefore, as an alternative means of correcting for multiple comparisons, we adjusted the threshold for significance by the number of experimental conditions (i.e., P values < 0.05/12 = 0.0042 were considered significant for this analysis).
We then used quantile regression analysis to further examine whether the effect of the fluid type on each outcome was dependent on the model complexity, flow rate, and flow split. Statistical significance was set at the 5% level throughout the analyses with the exception of the caval flow mixing analysis described above. We performed all statistical computations with Stata/SE 15.1 (StataCorp, College Station, TX).
RESULTS
Qualitative Flow Patterns
Figures 5–7 demonstrate qualitative differences in flow patterns between the experimental non-Newtonian fluid (xanthan gum) and control Newtonian fluid (glycerol). The flow patterns are illustrated by pathlines, which are lines that dye or particles injected into the velocity field would follow over time.
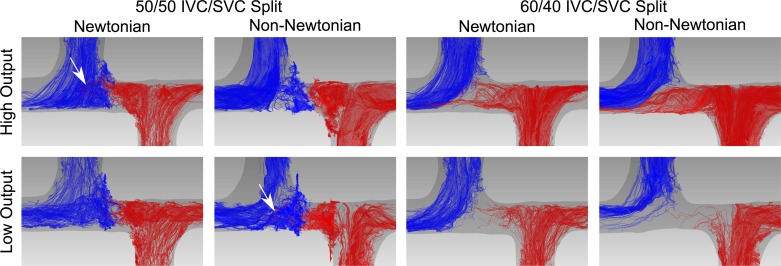
Fig. 5.
Flow patterns in the simplified symmetric total cavopulmonary connection model (simple model). Flow is illustrated by pathlines, lines that dye or particles injected into the velocity field would follow over time. Red pathlines originate from the inferior vena cava. Blue pathlines originate from the superior vena cava. Arrows indicate inferior vena cava pathlines crossing midline to the right pulmonary artery. Flow patterns of the Newtonian and non-Newtonian fluid are not significantly different under any of the experimental conditions. IVC, inferior vena cava; SVC, superior vena cava.
Fig. 7.
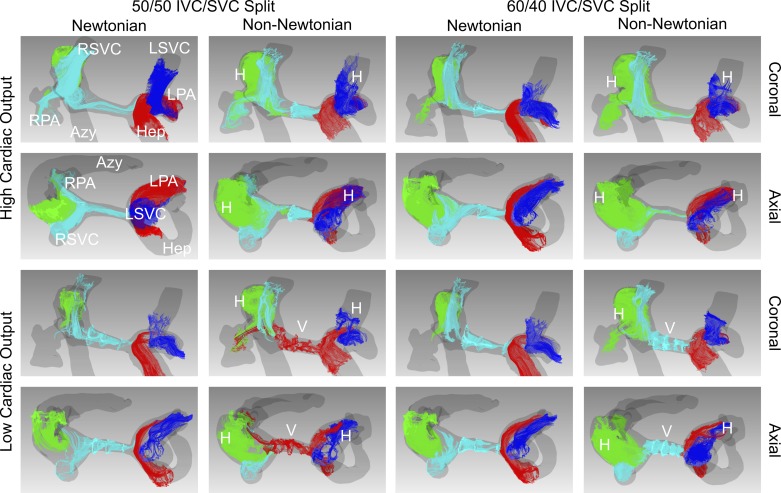
Flow patterns in the total cavopulmonary connection model of a patient with heterotaxy syndrome who had undergone the Fontan procedure (complex model). Flow is illustrated by pathlines, lines that dye or particles injected into the velocity field would follow over time. Red pathlines originate from the hepatic veins. Green pathlines originate from the azygous vein. Aqua pathlines originate from the right superior vena cava. Blue pathlines originate from the left superior vena cava. Under all experimental conditions, helical secondary flows are seen with the non-Newtonian fluid but not with the Newtonian fluid. Vortexes are also present in the mid-pulmonary artery segment in both low-cardiac output conditions with the non-Newtonian fluid but not with the Newtonian fluid. Azy, azygous vein; H, helical flow; Hep, conduit from hepatic veins; IVC, inferior vena cava; LPA, left pulmonary artery; LSVC, left superior vena cava; RPA, right pulmonary artery; RSVC, right superior vena cava; SVC, superior vena cava; V, vortex.
In the simple model, the flow patterns of the Newtonian and non-Newtonian fluid were not significantly different under any of the experimental conditions (Fig. 5). In the two 50:50 split conditions, two vortexes formed in between the SVC and IVC, which impeded mixing between the inlet flow streams. Although a small number of pathlines crossed from the IVC to RPA with only the Newtonian fluid at high cardiac output and with only the non-Newtonian fluid at low cardiac output, this was likely due to small variations in the balance between the SVC and IVC flows over time (Fig. 5, arrows).
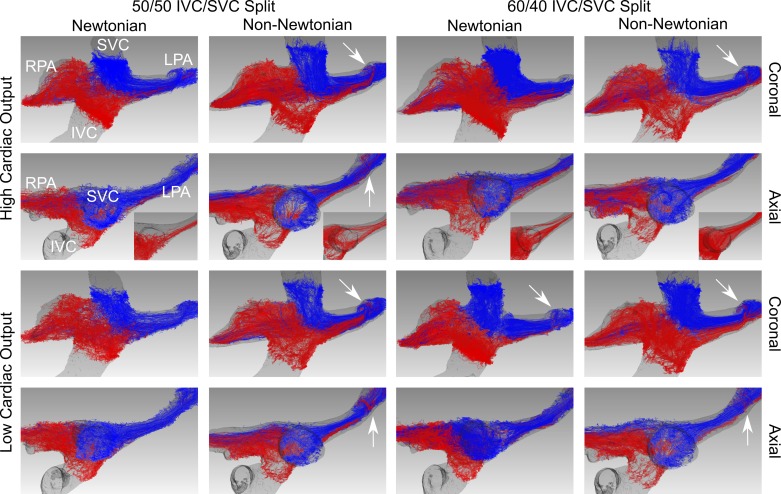
In the typical model, the overall flow patterns were also similar between the two fluids under all conditions (Fig. 6). Although the primary flow patterns were similar between the two fluids, subtle secondary flow patterns were different. First, with the non-Newtonian fluid a helical secondary flow developed at an acute turn in the LPA, resulting in IVC pathlines interleaving with SVC pathlines under all conditions (Fig. 6, arrows). This phenomenon occurred only in the 60:40 Low (60 Low) condition with the Newtonian fluid and was less prominent than with the non-Newtonian fluid. Second, under both high-cardiac output conditions, more IVC pathlines wrapped posterior to the SVC to flow into the LPA with the non-Newtonian fluid than with the Newtonian fluid (Fig. 6, insets).
Fig. 6.
Flow patterns in the total cavopulmonary connection model of a typical patient who had undergone the Fontan procedure (typical model). Flow is illustrated by pathlines, lines that dye or particles injected into the velocity field would follow over time. Red pathlines originate from the inferior vena cava. Blue pathlines originate from the superior vena cava. Overall flow patterns are similar between the two fluids under all conditions; however, insets highlight differences in the inferior vena cava flow patterns between the two solutions. Arrows indicate helical secondary flow seen only with the non-Newtonian fluid in the left pulmonary artery. IVC, inferior vena cava; LPA, left pulmonary artery; RPA, right pulmonary artery; SVC, superior vena cava.
In the complex model, more prominent differences emerged between the two fluids (Fig. 7). Under all experimental conditions, helical secondary flows developed in the azygous vein, left SVC, and LPA with the non-Newtonian fluid but not with the Newtonian fluid. Vortexes also developed in the mid-pulmonary artery segment in both low-cardiac output conditions with the non-Newtonian fluid but not with the Newtonian fluid, causing flow in this region to be almost stagnant. In the 50 Low condition, flow across this segment was also in the opposite direction between the two fluids: right SVC to LPA with the Newtonian fluid (Supplemental Video S1; see https://doi.org/10.6084/m9.figshare.8141960) and Fontan conduit to RPA with the non-Newtonian fluid (Supplemental Video S2; see https://doi.org/10.6084/m9.figshare.8141963).
Quantitative Analysis
Table 1 summarizes the difference in outcomes between the Newtonian and non-Newtonian fluids.
Table 1.
Summary of outcomes
| Newtonian Fluid | Non-Newtonian Fluid | Difference | P Value | |
|---|---|---|---|---|
| Power loss, % | 14.8 (13.3, 16.4) | 8.1 (6.4, 9.8) | −6.7 (−9, −4.4) | <0.0001 |
| Indexed power loss | 0.019 (0.018, 0.019) | 0.0179 (0.015, 0.020) | −0.0008 (−0.003, 0.0017) | 0.521 |
| RPA flow, % | 51.1 (50.9, 51.4) | 49.3 (49, 49.6) | −1.8 (−2.3, −1.4) | <0.0001 |
| Indexed RPA flow | 1.059 (1.047, 1.070) | 0.979 (0.967, 0.991) | −0.080 (−0.096, −0.063) | <0.0001 |
| Caval flow mixing, % | 7 (3, 11.1) | 2.8 (0, 5.9) | −4.2 (−9.4, 0.9) | 0.104 |
| Shear stress, dyn/cm2 | 2.649 (2.375, 2.922) | 2.935 (2.926, 2.944) | 0.286 (0.013, 0.560) | 0.040 |
Values are medians with 95% confidence interval in parentheses; n = 600 samples for %power loss, indexed power loss, %right pulmonary artery (RPA) flow, and indexed RPA flow; n = 60 samples for %caval flow mixing; and n = 360 samples for shear stress. Statistical analysis was by Somers’ D.
Power loss.
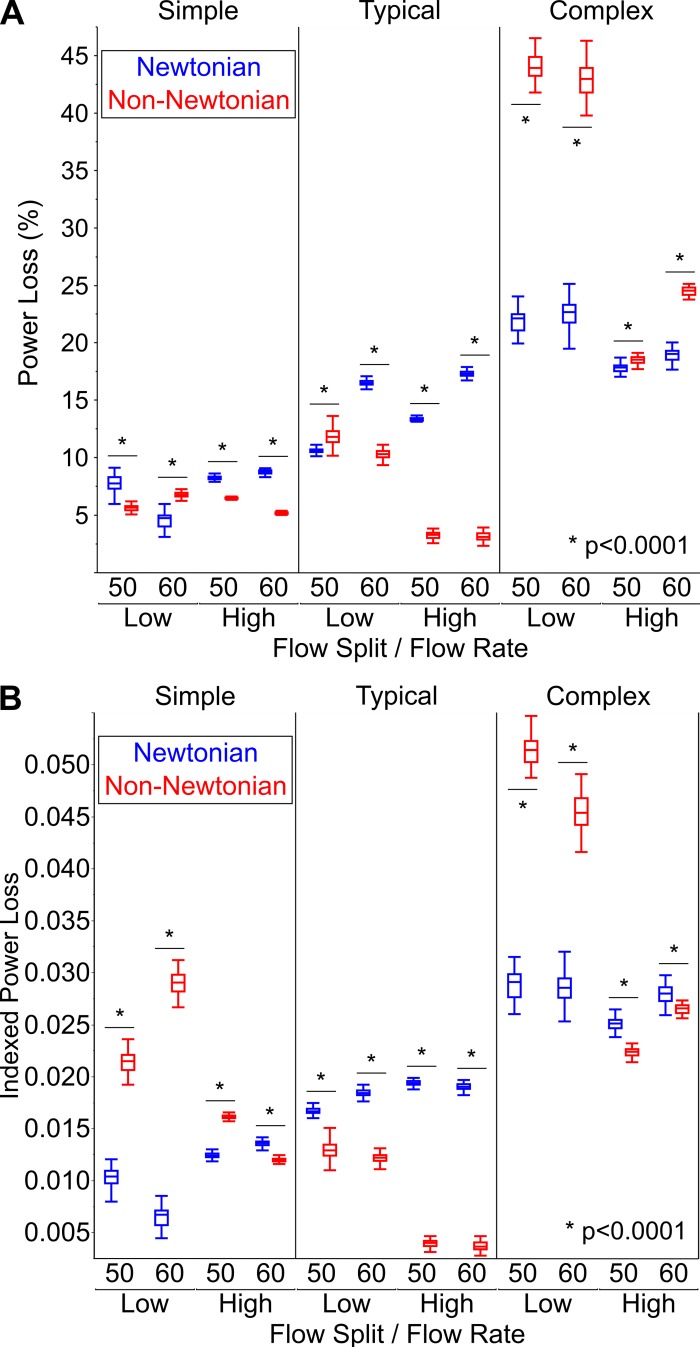
The primary outcome of power loss, when viewed as a percentage, was significantly higher with the Newtonian fluid than with the non-Newtonian fluid (14.8 vs. 8.1%, P < 0.0001). When considering all of the experimental conditions together, indexed power loss was not significantly different between the Newtonian and non-Newtonian fluids (0.019 vs. 0.0179, P = 0.521). However, when considering the experimental conditions individually, there were marked differences between the fluids in both indexed power loss and percent power loss as shown in Fig. 8.
Fig. 8.
Comparison of power loss between the Newtonian and non-Newtonian fluids. A: percent power loss. B: indexed power loss. Here, n = 50 samples for each experimental condition. Data are shown as medians with interquartile range (whiskers extend to 1.5 times interquartile range). Statistical analysis was by Mood’s median test followed by Bonferroni multiple comparison test.
Supplemental Table S1 (all Supplemental Tables are available at https://doi.org/10.6084/m9.figshare.8142014) describes the dependency of power loss on fluid type, TCPC model complexity, flow rate, and flow split using quantile regression analysis. Indexed power loss was significantly different between the two fluids (P < 0.0001), and the dependence of indexed power loss on fluid type was modulated by TCPC model complexity, flow rate, and flow split. The interactions between fluid type with model complexity and flow rate were highly significant (P < 0.0001), whereas the interaction between fluid type and flow split was more modest (P = 0.039). Percent power loss was not significantly different between the two fluids independent of the other experimental parameters (P = 0.281). However, there was a highly significant difference in percent power loss between the two fluids when considering the interactions between fluid type with model complexity, flow rate, and flow split (P < 0.0001 for all).
Pulmonary flow distribution.
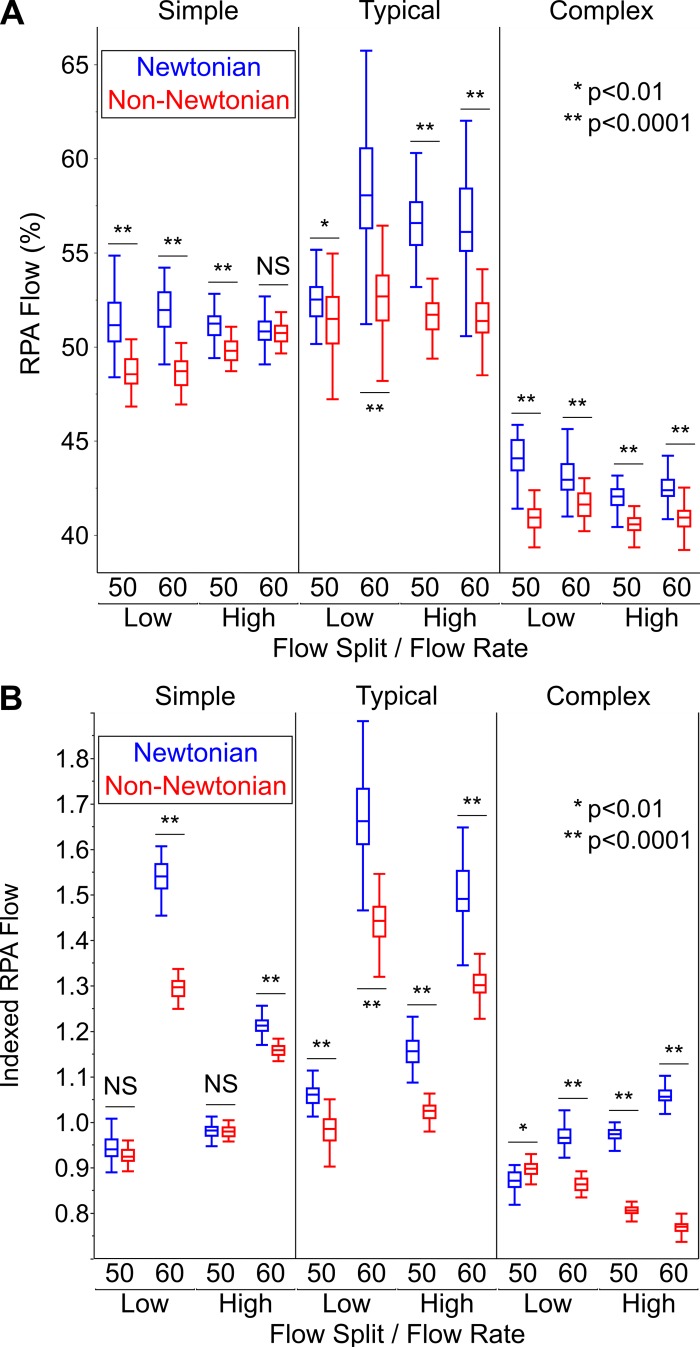
RPA flow was also significantly higher with the Newtonian fluid than with the non-Newtonian fluid. The magnitude of these differences was larger when RPA flow was calculated as an index (1.059 vs. 0.979, P < 0.0001) rather than a percentage (51.1 vs. 49.3%, P < 0.0001). As with power loss, there was large variation between experimental conditions (Fig. 9).
Fig. 9.
Comparison of right pulmonary artery (RPA) flow between the Newtonian and non-Newtonian fluids. A: percent RPA flow. B: indexed RPA flow. Here, n = 50 samples for each experimental condition. Data are shown as medians with interquartile range (whiskers extend to 1.5 times interquartile range). Statistical analysis was by Mood’s median test followed by Bonferroni multiple comparison test. NS, nonsignificant P value (>0.05).
Supplemental Table S2 describes the dependency of RPA flow on fluid type, model complexity, flow rate, and flow split using quantile regression analysis. Percent RPA flow was significantly different between the two fluids (P < 0.0001). The dependence of percent RPA flow on fluid type was modulated by TCPC model complexity (P < 0.0001) and flow rate (P = 0.001), but not flow split (P = 0.656). Indexed RPA flow was also significantly different between the two fluids (P = 0.003), but this dependence was only affected by model complexity (P < 0.0001) and not flow rate (P = 0.152) or flow split (P = 0.076).
Caval flow mixing.
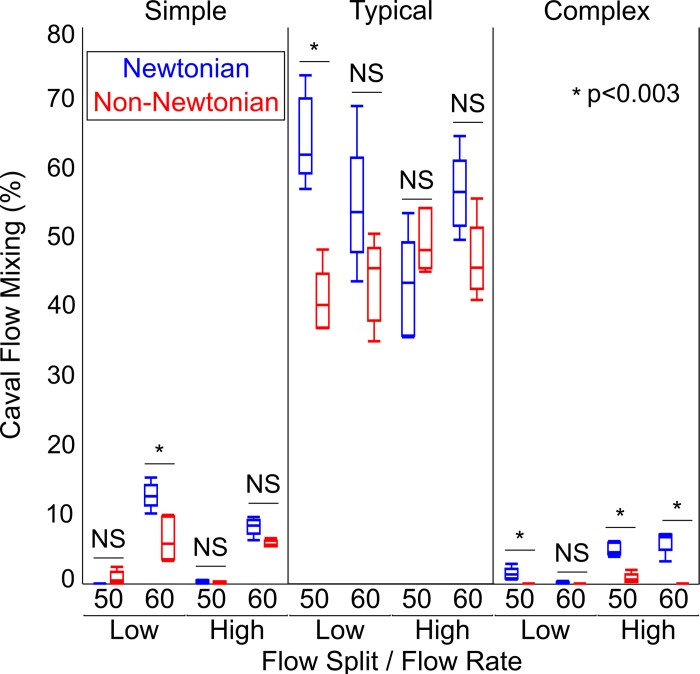
There was a trend toward significant difference in caval flow mixing between the Newtonian and non-Newtonian fluids (7 vs. 2.8%, P = 0.104). As with the other outcome parameters there was marked variation with experimental condition (Fig. 10), the difference in mixing between the fluids ranging from <1 to 23%.
Fig. 10.
Comparison of caval flow mixing between the Newtonian and non-Newtonian fluids. Here, n = 5 samples for each experimental condition. Data are shown as medians with interquartile range (whiskers extend to 1.5 times interquartile range). Statistical analysis was by Mood’s median test. The Bonferroni method did not yield a converging solution for this analysis. Therefore, as an alternative means of correcting for multiple comparisons, we adjusted the threshold for significance by the number of experimental conditions (i.e., P values < 0.05/12 = 0.0042 were considered significant for this analysis). NS, nonsignificant P value.
Supplemental Table S3 describes the dependency of caval flow mixing on fluid type, model complexity, flow rate, and flow split using quantile regression analysis. Mixing was significantly different between the two fluids (P = 0.002). The dependence of mixing on fluid type was modulated by model complexity (P < 0.0001) and to a lesser degree by flow split (P = 0.032). However, the interaction between fluid type and flow rate was not significant (P = 0.518).
As mentioned above, there were differences in secondary flow patterns such as vortexes that affected mixing in a subset of experimental conditions. Since the TCPC models only included the portion of the pulmonary arteries proximal to the lobar branches, we could not evaluate the effect of these secondary flow patterns on mixing in the distal lung vasculature.
Shear stress.
Shear stress was significantly lower with the Newtonian fluid than with the non-Newtonian fluid (2.649 vs. 2.935 dyn/cm2, P = 0.04). Supplemental Table S4 describes the dependency of shear stress on fluid type, model complexity, flow rate, and flow split using quantile regression analysis. Shear stress was significantly different between the two fluids (P < 0.0001) and modulated by TCPC model complexity, flow rate, and flow split. The interactions between fluid type with model complexity and flow split were highly significant (P < 0.0001), whereas the interaction between fluid type and flow rate was less pronounced (P = 0.031).
DISCUSSION
Modeling blood as a Newtonian fluid with shear-independent viscosity is a standard assumption in computational and experimental cardiovascular applications, since blood behaves as a Newtonian fluid in large arteries (29). However, non-Newtonian behavior (i.e., increases in blood viscosity at low shear rates) has a significant influence in smaller blood vessels, the microvasculature, and other settings where low-shear flow is more prevalent such as in coronary arteries, cerebral aneurysms, and ventricular assist devices (1, 5, 22, 38, 41). In these settings, wall shear stress and areas of increased thrombotic potential may be characterized inaccurately when using a Newtonian fluid assumption. Expanding upon our prior clinical and experimental observations (10, 11), we similarly demonstrate in the present study that non-Newtonian behavior affects power loss, pulmonary flow distribution, caval flow mixing, and shear stress in patient-derived synthetic models of the low-shear Fontan circulation. Since each of these factors can affect the long-term sequelae of the Fontan circulation, accurate measurements that incorporate non-Newtonian behavior (i.e., using 4D flow MRI in conjunction with computational fluid dynamic modeling) are necessary to properly risk stratify these patients.
Our primary outcome of power loss was significantly different between the Newtonian and non-Newtonian fluids and modulated by TCPC model complexity and cardiac output. With the Newtonian fluid, power loss increased monotonically with circuit complexity and, to a lesser degree, cardiac output. In contrast, with the non-Newtonian fluid there was a nonlinear relationship between power loss, circuit complexity, and cardiac output. This erratic behavior may have been in part due to changes in flow and vessel geometry altering low-shear regions where viscosity changes nonlinearly (rises exponentially), which in turn could either increase resistance through fluid frictional effects or lower resistance by preventing transition to turbulence (effectively “organizing” flow). The formation and loss of vortexes was also likely a key component of these abrupt changes in power loss. Focusing on the effect of cardiac output, we noted that power loss decreased at high cardiac output with the non-Newtonian fluid in all three TCPC models. If this finding were reproducible in vivo, one could posit that increased physical activity is energetically more favorable for patients who had undergone the Fontan procedure. However, increased physical activity would not address the relatively higher power loss expected during sleep and periods of daytime inactivity. Additionally, in these quiescent states, lower cardiac output could amplify regions of low shear, increasing the potential for non-Newtonian-mediated thrombus formation and adverse vascular remodeling as described below. These chronic changes at rest could then in turn negatively impact exertional power loss over time.
As previously mentioned, power loss across the Fontan circuit is a primary contributor to decreased exercise capacity and increases with somatic growth (25, 34). Based on these observations, interest has grown in developing an “optimal” Fontan conduit that minimizes power loss and promotes symmetric pulmonary blood flow. Unfortunately, to date, the clinical success of these grafts has been limited (40, 42). Given the effect of non-Newtonian blood viscosity on power loss, modeling blood viscosity more realistically would likely yield a more accurate assessment of the performance of these novel Fontan conduits.
We observed both qualitative and quantitative differences in flow patterns between the Newtonian and non-Newtonian fluids. Although primary flow patterns were not significantly different among all conditions, the formation of secondary flow patterns such as vortexes and helixes was more common with the non-Newtonian fluid in the two patient-specific TCPC models. These secondary flows were not associated with increased power loss in the small number of experimental conditions that we studied, but a larger-scale study would be necessary to further evaluate this association. More notably, in the complex TCPC model under both low-cardiac output conditions, the flow pattern in the pulmonary artery segment between the right and left SVC was markedly different between the two fluids. With the non-Newtonian fluid there were several small vortexes and stagnant flow, whereas with the Newtonian fluid there was laminar unidirectional flow. In the 50 Low condition, flow across this segment was also in the opposite direction between the two fluids.
An area of stagnation such as this has several important implications for a patient with the Fontan circulation. First, blood stasis can lead to formation of thromboemboli, which are a common and potentially lethal complication of the Fontan circulation (15). Second, stagnant flow can prevent symmetric distribution of hepatic blood to both lungs, which is necessary to suppress the development of pulmonary arteriovenous malformations (16). These abnormal intrapulmonary shunts allow blood to pass through the lungs without being oxygenated, causing progressive cyanosis and increased risk of mortality, and are particularly common in complex patients with heterotaxy such as those in our study (7). Third, stagnant flow in this area implies low wall shear stress, which promotes concentric remodeling and vessel stenosis (27). This type of remodeling commonly occurs in the Fontan conduit with a mean reduction in conduit diameter of 14–18% within the first 3 yr after the Fontan procedure (3, 26). Interestingly, patients who have bilateral Glenn anastomoses are at increased risk for all of these complications compared with patients who have only a unilateral Glenn anastomosis (23).
Although the difference in caval flow mixing percentage was not significant between the fluids in this study when considering all experimental conditions together, there were marked differences in a subset of conditions. In 5 out of 12 experimental conditions, the Newtonian fluid demonstrated more mixing than the non-Newtonian fluid. The difference in mixing was as large as 23% higher with the Newtonian fluid. As such, a computational model using a Newtonian fluid would very likely underestimate the risk of pulmonary arteriovenous malformations in this scenario.
We observed a small but significant difference in pulmonary flow distribution between the Newtonian and non-Newtonian fluids, with RPA flow being higher with the Newtonian fluid. This difference was also modulated by the other experimental variables but was inconsistent between the two measures of RPA flow (percentage vs. index). Patients who had undergone the Fontan procedure are at increased risk of maldistribution of pulmonary blood flow, which in turn is associated with decreased exercise capacity (2, 13, 28). Impaired lung function, including restrictive lung disease, air trapping, and reduced diffusing capacity are also common and likely compound exercise impairment (20).
Shear stress was significantly lower with the Newtonian fluid versus the non-Newtonian fluid. Decreased wall shear stress has been linked to endothelial dysfunction, adverse pulmonary vascular remodeling, and thrombus formation in patients who had undergone the Fontan procedure (21, 30, 35). However, since pulmonary blood flow is globally low shear in all patients who had undergone the Fontan procedure, it is difficult to infer how a mean difference of this magnitude would manifest physiologically. Local differences in shear stress would provide more insight into focal areas of particular concern (e.g., Fontan conduits that are more likely to form thrombi).
Of note, our experiments were performed using a non-Newtonian fluid designed to match the average blood viscosity characteristics of a small cohort of patients who had undergone the Fontan procedure. As adult patients who had undergone the Fontan procedure may have elevated hemoglobin and hematocrit independent of oxygen saturation and iron deficiency (39), or anemia in the setting of ventricular and renal dysfunction (14), they may have abnormally elevated or decreased blood viscosity. Since patients who had undergone the Fontan procedure are prone to developing protein-losing enteropathy (4), low albumin levels may also decrease their blood viscosity. Thus, evaluation of blood viscosity in a larger cohort of patients who had undergone the Fontan procedure is warranted to determine the degree to which interpatient variability affects non-Newtonian behavior in this circulation.
Our findings have several important clinical implications. As computational fluid dynamics (CFD) modeling continues to become more widely utilized for development of novel Fontan conduits and assist devices, incorporation of non-Newtonian behavior into these models will be essential to properly evaluate the optimal configuration of these conduits and devices. Since the effect of non-Newtonian behavior on performance metrics is highly dependent on patient-specific variables such as blood vessel geometry and cardiac output, determining an “optimal” conduit design for each patient will likely require personalized CFD modeling with either a generalized non-Newtonian blood viscosity model (e.g., Herschel-Bulkley) or patient-specific blood viscosity analysis. More broadly, since our data demonstrate that non-Newtonian behavior affects many different components of Fontan circulation performance, perturbations in blood viscosity may play a role in the pathophysiology of Fontan failure. A large multicenter longitudinal study would be necessary to assess for this association.
Limitations
Since the design of our circulatory flow loop was relatively simple, we could not evaluate how other physiologic variables such as blood vessel elasticity and lung compliance would affect non-Newtonian behavior. The relative positions of the SVC and IVC connections to the pulmonary arteries depend on many surgical factors. In retrospect, the position of the IVC in our typical model was more rightward than usual; more commonly, the IVC inserts leftward of the SVC. This limits the generalizability of our observations to other patients with this type of TCPC anatomy. In general, decreasing the offset between the SVC and IVC facilitates mixing, whereas increasing the offset increases hemodynamic efficiency. We did not systematically explore the relationship between this offset and our outcome variables in this study. Since our TCPC models only included the portion of the pulmonary arteries proximal to the lobar branches, we also could not evaluate how the differences that we observed between the two fluids would manifest in the distal lung vasculature. For example, small differences in pulmonary flow distribution and caval flow mixing centrally could lead to more noticeable differences in ventilation-perfusion mismatch or hepatic factor maldistribution in distal lung segments.
As mentioned in discussion, the non-Newtonian fluid demonstrated a striking nonlinear relationship between power loss, circuit complexity, and cardiac output that was not observed with the Newtonian fluid. This resulted in significant heterogeneity in power loss as shown in Fig. 8. Although this complicates generalization to clinical outcomes, it provides compelling evidence that incorporation of non-Newtonian behavior is critical for proper physiological modeling of the Fontan circulation.
MRI scanning inherently involves a trade-off between acquisition time, spatial resolution, and signal-to-noise ratio. We were able to acquire MRI images with a spatial resolution higher than what is typically achievable in clinical imaging with only a modest increase in acquisition time because the field of view needed to cover the TCPC models was relatively small. Signal-to-noise ratio was maintained by adding gadobutrol contrast to the two fluids. To achieve a similar spatial resolution without a significant increase in acquisition time in vivo would likely require use of novel acceleration techniques in conjunction with a blood pool contrast agent to maintain adequate signal-to-noise ratio (12). Although the spatial resolution of our MRI images was higher than what is typically used for clinical imaging, it was still relatively coarse for the purposes of evaluating flow patterns and shear stress at the vessel walls.
Conclusion
In both simplified and patient-specific models of the Fontan circulation, a non-Newtonian fluid with shear-dependent viscosity significantly alters qualitative flow patterns, power loss, pulmonary flow distribution, and caval flow mixing compared to a Newtonian fluid with shear-independent viscosity. These effects are modulated by vessel geometry, cardiac output, and asymmetry of caval flow in a complex and highly nonlinear manner. Moreover, the observed differences are each associated with a clinically impactful outcome. Future studies could be performed using computational fluid dynamics to evaluate the effects of non-Newtonian blood viscosity more systematically, since blood vessel geometry, viscosity, and vascular compliance could be adjusted more easily. However, since computational simulations require assumptions about physiologic parameters such as vascular compliance and resistance, in vivo 4D flow MRI data would still be a necessary adjunct to calibrate the models.
GRANTS
A. L. Cheng was supported by National Institutes of Health K12 Grant 4 K12-HD-052954-10 and Children’s Hospital Los Angeles (Pediatrician-Scientist and The Saban Research Institute Research Career Development awards) and University of Southern California (Wright Foundation pilot grant) intramural grants.
DISCLOSURES
No conflicts of interest, financial or otherwise, are declared by the authors.
AUTHOR CONTRIBUTIONS
A.L.C. conceived and designed research; A.L.C. performed experiments; A.L.C., C.P.W., and J.C.W. analyzed data; A.L.C., C.P.W., N.M.P., and J.C.W. interpreted results of experiments; A.L.C. prepared figures; A.L.C. drafted manuscript; A.L.C., C.P.W., N.M.P., and J.C.W. edited and revised manuscript; A.L.C., C.P.W., N.M.P., and J.C.W. approved final version of manuscript.
REFERENCES
- 1.Al-Azawy MG, Turan A, Revell A. Investigating the impact of non-Newtonian blood models within a heart pump. Int J Numer Methods Biomed Eng 33: e2780, 2017. doi: 10.1002/cnm.2780. [DOI] [PubMed] [Google Scholar]
- 2.Alsaied T, Sleeper LA, Masci M, Ghelani SJ, Azcue N, Geva T, Powell AJ, Rathod RH. Maldistribution of pulmonary blood flow in patients after the Fontan operation is associated with worse exercise capacity. J Cardiovasc Magn Reson 20: 85, 2018. doi: 10.1186/s12968-018-0505-4. [DOI] [PMC free article] [PubMed] [Google Scholar]
- 3.Amodeo A, Galletti L, Marianeschi S, Picardo S, Giannico S, Di Renzi P, Marcelletti C, Bailey LL, Reddy VM. Extracardiac Fontan operation for complex cardiac anomalies: seven years’ experience. J Thorac Cardiovasc Surg 114: 1020–1030, 1997. doi: 10.1016/S0022-5223(97)70016-3. [DOI] [PubMed] [Google Scholar]
- 4.Atz AM, Zak V, Mahony L, Uzark K, D’agincourt N, Goldberg DJ, Williams RV, Breitbart RE, Colan SD, Burns KM, Margossian R, Henderson HT, Korsin R, Marino BS, Daniels K, McCrindle BW; Pediatric Heart Network Investigators . Longitudinal outcomes of patients with single ventricle after the Fontan procedure. J Am Coll Cardiol 69: 2735–2744, 2017. doi: 10.1016/j.jacc.2017.03.582. [DOI] [PMC free article] [PubMed] [Google Scholar]
- 5.Bachmann C, Hugo G, Rosenberg G, Deutsch S, Fontaine A, Tarbell JM. Fluid dynamics of a pediatric ventricular assist device. Artif Organs 24: 362–372, 2000. doi: 10.1046/j.1525-1594.2000.06536.x. [DOI] [PubMed] [Google Scholar]
- 6.Baskurt OK, Meiselman HJ. Blood rheology and hemodynamics. Semin Thromb Hemost 29: 435–450, 2003. doi: 10.1055/s-2003-44551. [DOI] [PubMed] [Google Scholar]
- 7.Burstein DS, Mavroudis C, Puchalski MD, Stewart RD, Blanco CJ, Jacobs ML. Pulmonary arteriovenous malformations in heterotaxy syndrome: the case for early, direct hepatic vein-to-azygos vein connection. World J Pediatr Congenit Heart Surg 2: 119–128, 2011. doi: 10.1177/2150135110387310. [DOI] [PubMed] [Google Scholar]
- 8.Casa LD, Deaton DH, Ku DN. Role of high shear rate in thrombosis. J Vasc Surg 61: 1068–1080, 2015. doi: 10.1016/j.jvs.2014.12.050. [DOI] [PubMed] [Google Scholar]
- 9.Chen JM, Canter CE, Hsu DT, Kindel SJ, Law YM, Mckeever JE, Pahl E, Schumacher KR. Current topics and controversies in pediatric heart transplantation: Proceedings of the Pediatric Heart Transplantation Summit 2017. World J Pediatr Congenit Hear Surg 9: 575–581, 2018. doi: 10.1177/2150135118782895. [DOI] [PubMed] [Google Scholar]
- 10.Cheng AL, Pahlevan NM, Rinderknecht DG, Wood JC, Gharib M. Experimental investigation of the effect of non-Newtonian behavior of blood flow in the Fontan circulation. Eur J Mech BFluids 68: 184–192, 2018. doi: 10.1016/j.euromechflu.2017.12.009. [DOI] [PMC free article] [PubMed] [Google Scholar]
- 11.Cheng AL, Takao CM, Wenby RB, Meiselman HJ, Wood JC, Detterich JA. Elevated low-shear blood viscosity is associated with decreased pulmonary blood flow in children with univentricular heart defects. Pediatr Cardiol 37: 789–801, 2016. doi: 10.1007/s00246-016-1352-4. [DOI] [PMC free article] [PubMed] [Google Scholar]
- 12.Cheng JY, Hanneman K, Zhang T, Alley MT, Lai P, Tamir JI, Uecker M, Pauly JM, Lustig M, Vasanawala SS. Comprehensive motion-compensated highly accelerated 4D flow MRI with ferumoxytol enhancement for pediatric congenital heart disease. J Magn Reson Imaging 43: 1355–1368, 2016. doi: 10.1002/jmri.25106. [DOI] [PMC free article] [PubMed] [Google Scholar]
- 13.Cloutier A, Ash JM, Smallhorn JF, Williams WG, Trusler GA, Rowe RD, Rabinovitch M. Abnormal distribution of pulmonary blood flow after the Glenn shunt or Fontan procedure: risk of development of arteriovenous fistulae. Circulation 72: 471–479, 1985. doi: 10.1161/01.CIR.72.3.471. [DOI] [PubMed] [Google Scholar]
- 14.Collins N, Piran S, Harrison J, Azevedo E, Oechslin E, Silversides CK. Prevalence and determinants of anemia in adults with complex congenital heart disease and ventricular dysfunction (subaortic right ventricle and single ventricle physiology). Am J Cardiol 102: 625–628, 2008. doi: 10.1016/j.amjcard.2008.04.034. [DOI] [PubMed] [Google Scholar]
- 15.Coon PD, Rychik J, Novello RT, Ro PS, Gaynor JW, Spray TL. Thrombus formation after the Fontan operation. Ann Thorac Surg 71: 1990–1994, 2001. doi: 10.1016/S0003-4975(01)02472-9. [DOI] [PubMed] [Google Scholar]
- 16.Duncan BW, Desai S. Pulmonary arteriovenous malformations after cavopulmonary anastomosis. Ann Thorac Surg 76: 1759–1766, 2003. doi: 10.1016/S0003-4975(03)00450-8. [DOI] [PubMed] [Google Scholar]
- 17.Fedorov A, Beichel R, Kalpathy-Cramer J, Finet J, Fillion-Robin JC, Pujol S, Bauer C, Jennings D, Fennessy F, Sonka M, Buatti J, Aylward S, Miller JV, Pieper S, Kikinis R. 3D Slicer as an image computing platform for the Quantitative Imaging Network. Magn Reson Imaging 30: 1323–1341, 2012. doi: 10.1016/j.mri.2012.05.001. [DOI] [PMC free article] [PubMed] [Google Scholar]
- 18.Gewillig M, Brown SC. The Fontan circulation after 45 years: update in physiology. Heart 102: 1081–1086, 2016. doi: 10.1136/heartjnl-2015-307467. [DOI] [PMC free article] [PubMed] [Google Scholar]
- 19.Hamedi H, Rahimian MH. Numerical simulation of non-Newtonian pseudo-plastic fluid in a micro-channel using the lattice Boltzmann method. World J Mech 01: 231–242, 2011. doi: 10.4236/wjm.2011.15029. [DOI] [Google Scholar]
- 20.Hedlund ER, Ljungberg H, Söderström L, Lundell B, Sjöberg G. Impaired lung function in children and adolescents with Fontan circulation may improve after endurance training. Cardiol Young 28: 1115–1122, 2018. doi: 10.1017/S1047951118000902. [DOI] [PubMed] [Google Scholar]
- 21.Henaine R, Vergnat M, Bacha EA, Baudet B, Lambert V, Belli E, Serraf A. Effects of lack of pulsatility on pulmonary endothelial function in the Fontan circulation. J Thorac Cardiovasc Surg 146: 522–529, 2013. doi: 10.1016/j.jtcvs.2012.11.031. [DOI] [PubMed] [Google Scholar]
- 22.Kabinejadian F, Ghista DN. Compliant model of a coupled sequential coronary arterial bypass graft: effects of vessel wall elasticity and non-Newtonian rheology on blood flow regime and hemodynamic parameters distribution. Med Eng Phys 34: 860–872, 2012. doi: 10.1016/j.medengphy.2011.10.001. [DOI] [PubMed] [Google Scholar]
- 23.Keizman E, Tejman-Yarden S, Mishali D, Levine S, Borik S, Pollak U, Katz U, Serraf AE. The bilateral bidirectional Glenn operation as a risk factor prior to fontan completion in complex congenital heart disease patients. World J Pediatr Congenit Heart Surg 10: 174–181, 2019. doi: 10.1177/2150135118819997. [DOI] [PubMed] [Google Scholar]
- 24.Khairy P, Poirier N, Mercier LA. Univentricular heart. Circulation 115: 800–812, 2007. doi: 10.1161/CIRCULATIONAHA.105.592378. [DOI] [PubMed] [Google Scholar]
- 25.Khiabani RH, Whitehead KK, Han D, Restrepo M, Tang E, Bethel J, Paridon SM, Fogel MA, Yoganathan AP. Exercise capacity in single-ventricle patients after Fontan correlates with haemodynamic energy loss in TCPC. Heart 101: 139–143, 2015. doi: 10.1136/heartjnl-2014-306337. [DOI] [PubMed] [Google Scholar]
- 26.Lee C, Lee CH, Hwang SW, Lim HG, Kim SJ, Lee JY, Shim WS, Kim WH. Midterm follow-up of the status of Gore-Tex graft after extracardiac conduit Fontan procedure. Eur J Cardiothoracic Surg 31: 1008–1012, 2007. doi: 10.1016/j.ejcts.2007.03.013. [DOI] [PubMed] [Google Scholar]
- 27.Malek AM, Alper SL, Izumo S. Hemodynamic shear stress and its role in atherosclerosis. JAMA 282: 2035–2042, 1999. doi: 10.1001/jama.282.21.2035. [DOI] [PubMed] [Google Scholar]
- 28.Matsushita T, Matsuda H, Ogawa M, Ohno K, Sano T, Nakano S, Shimazaki Y, Nakahara K, Arisawa J, Kozuka T, Kawashima Y, Yabuuchi H. Assessment of the intrapulmonary ventilation-perfusion distribution after the Fontan procedure for complex cardiac anomalies: relation to pulmonary hemodynamics. J Am Coll Cardiol 15: 842–848, 1990. doi: 10.1016/0735-1097(90)90284-V. [DOI] [PubMed] [Google Scholar]
- 29.Morris PD, Narracott A, von Tengg-Kobligk H, Silva Soto DA, Hsiao S, Lungu A, Evans P, Bressloff NW, Lawford PV, Hose DR, Gunn JP. Computational fluid dynamics modelling in cardiovascular medicine. Heart 102: 18–28, 2016. doi: 10.1136/heartjnl-2015-308044. [DOI] [PMC free article] [PubMed] [Google Scholar]
- 30.Ovroutski S, Ewert P, Alexi-Meskishvili V, Hölscher K, Miera O, Peters B, Hetzer R, Berger F. Absence of pulmonary artery growth after fontan operation and its possible impact on late outcome. Ann Thorac Surg 87: 826–831, 2009. doi: 10.1016/j.athoracsur.2008.10.075. [DOI] [PubMed] [Google Scholar]
- 31.Papaioannou TG, Stefanadis C. Vascular wall shear stress: basic principles and methods. Hellenic J Cardiol 46: 9–15, 2005. http://www.ncbi.nlm.nih.gov/pubmed/15807389. [PubMed] [Google Scholar]
- 32.Poh CL, D’Udekem Y. Life after surviving Fontan surgery: a meta-analysis of the incidence and predictors of late death. Heart Lung Circ 27: 552–559, 2018. doi: 10.1016/j.hlc.2017.11.007. [DOI] [PubMed] [Google Scholar]
- 33.Pontiga F, Gaytán SP. An experimental approach to the fundamental principles of hemodynamics. Adv Physiol Educ 29: 165–171, 2005. doi: 10.1152/advan.00009.2005. [DOI] [PubMed] [Google Scholar]
- 34.Restrepo M, Tang E, Haggerty CM, Khiabani RH, Mirabella L, Bethel J, Valente AM, Whitehead KK, McElhinney DB, Fogel MA, Yoganathan AP. Energetic implications of vessel growth and flow changes over time in Fontan patients. Ann Thorac Surg 99: 163–170, 2015. doi: 10.1016/j.athoracsur.2014.08.046. [DOI] [PubMed] [Google Scholar]
- 35.Ridderbos FJ, Wolff D, Timmer A, van Melle JP, Ebels T, Dickinson MG, Timens W, Berger RM. Adverse pulmonary vascular remodeling in the Fontan circulation. J Heart Lung Transplant 34: 404–413, 2015. doi: 10.1016/j.healun.2015.01.005. [DOI] [PubMed] [Google Scholar]
- 36.Rijnberg FM, Hazekamp MG, Wentzel JJ, de Koning PJ, Westenberg JJ, Jongbloed MR, Blom NA, Roest AA. Energetics of blood flow in cardiovascular disease: concept and clinical implications of adverse energetics in patients with a Fontan circulation. Circulation 137: 2393–2407, 2018. doi: 10.1161/CIRCULATIONAHA.117.033359. [DOI] [PubMed] [Google Scholar]
- 37.Schilling C, Dalziel K, Nunn R, Du Plessis K, Shi WY, Celermajer D, Winlaw D, Weintraub RG, Grigg LE, Radford DJ, Bullock A, Gentles TL, Wheaton GR, Hornung T, Justo RN, d’Udekem Y. The Fontan epidemic: population projections from the Australia and New Zealand Fontan Registry. Int J Cardiol 219: 14–19, 2016. doi: 10.1016/j.ijcard.2016.05.035. [DOI] [PubMed] [Google Scholar]
- 38.Sriram K, Intaglietta M, Tartakovsky DM. Non-Newtonian flow of blood in arterioles: consequences for wall shear stress measurements. Microcirculation 21: 628–639, 2014. doi: 10.1111/micc.12141. [DOI] [PMC free article] [PubMed] [Google Scholar]
- 39.Tomkiewicz-Pajak L, Plazak W, Kolcz J, Pajak J, Kopec G, Dluzniewska N, Olszowska M, Moryl-Bujakowska A, Podolec P. Iron deficiency and hematological changes in adult patients after Fontan operation. J Cardiol 64: 384–389, 2014. doi: 10.1016/j.jjcc.2014.02.021. [DOI] [PubMed] [Google Scholar]
- 40.Trusty PM, Restrepo M, Kanter KR, Yoganathan AP, Fogel MA, Slesnick TC. A pulsatile hemodynamic evaluation of the commercially available bifurcated Y-graft Fontan modification and comparison with the lateral tunnel and extracardiac conduits. J Thorac Cardiovasc Surg 151: 1529–1536, 2016. doi: 10.1016/j.jtcvs.2016.03.019. [DOI] [PubMed] [Google Scholar]
- 41.Xiang J, Tremmel M, Kolega J, Levy EI, Natarajan SK, Meng H. Newtonian viscosity model could overestimate wall shear stress in intracranial aneurysm domes and underestimate rupture risk. J Neurointerv Surg 4: 351–357, 2012. doi: 10.1136/neurintsurg-2011-010089. [DOI] [PubMed] [Google Scholar]
- 42.Yang W, Chan FP, Reddy VM, Marsden AL, Feinstein JA. Flow simulations and validation for the first cohort of patients undergoing the Y-graft Fontan procedure. J Thorac Cardiovasc Surg 149: 247–255, 2015. doi: 10.1016/j.jtcvs.2014.08.069. [DOI] [PubMed] [Google Scholar]


