Abstract
Non-alcoholic fatty liver disease (NAFLD), a liver manifestation of metabolic syndrome, is associated with considerable health and socioeconomic burdens in many populations worldwide. Recent studies suggest that human cytomegalovirus (HCMV) infection might play a role in the pathogenesis of metabolic diseases, including NAFLD, but it is still unclear whether HCMV-encoded IE2 plays an important role in this process. Interestingly, SREBP1c was recently reported to play critical roles in the development of hepatic steatosis. In this study, we aimed to study the IE2 effect on the expression levels of SREBP1c and on lipid metabolism in the liver of UL122 genetically modified mice. First, UL122 genetically modified mice models that can steadily and continuously express IE2 protein were established. Then, the mice were divided into the experimental group (positive mice identified) and the control group (wild-type mice, n=16 per group). The establishment of UL122 genetically modified mice was identified by PCR technology. The triglyceride content in their livers was measured using a colorimetric assay and oil red O-stain. Real-time PCR and immunohistochemistry were performed to detect the expression levels of SREBP1c mRNA and protein after HCMV infection. We found that SREBP1c expression was significantly elevated in the experimental group, and its overexpression in the liver cells can promote triglyceride accumulation and hepatic steatosis. Taken together, our data collectively demonstrate that HCMV infection is highly associated with NAFLD, SREBP1c overexpression promotes hepatic steatosis, and this up-regulation is most likely mediated by IE2.
Keywords: IE2, SREBP1c, NAFLD, liver, lipid metabolism
Introduction
For decades, clinical and epidemiological investigations have shown a high rate of HCMV infection in patients with atherosclerosis (AS), which indicates that there may be a link between HCMV infection and lipid metabolism disorders [1-3]. Previous studies have also shown that HCMV infection requires the induction of lipogenesis [4]. Surprisingly, studies from our laboratory have shown that HCMV infection promotes the development of non-alcoholic fatty liver disease (NAFLD). Even though there is accumulating evidence suggesting an association between HCMV and lipid metabolism disorders, relatively little is known about the pathogenic mechanism of HCMV in various diseases, especially NAFLD.
Human cytomegalovirus (HCMV), a 240-kb double-stranded DNA genome, belongs to the beta subfamily of herpesviruses and encodes over 200 open reading frames (ORFs) [5]. HCMV can infect any population, with up to an 80% infection rate before the age of 3, and up to a 100% infection rate in adulthood. Congenital HCMV infection occurs in 1 to 2% of infants and can result in many diseases, such as microcephalus, epileptic encephalitis, pediatric severe hepatitis syndrome. Additionally, it is a wide-spread opportunistic agent in various immunosuppressed populations, and it might contribute to cardiovascular disease, cancer, immune senescence, or atherosclerosis [6].
In the process of virus infection, the expression of HCMV genes occur in a certain order, divided into the immediate early (IE), early (E) and late (L) phases. The IE gene transcript can encode IE1 and IE2 by different splicing methods [7]. IE2, a 579-amino-acid protein, is encoded by the gene UL122. The primary role of IE2 is to activate viral E gene expression, which is critical for the progression of the HCMV replication cycle, as it cannot be replaced by the activity of other viruses or cellular proteins known so far [8].
Non-alcoholic fatty liver disease (NAFLD) is a liver manifestation of metabolic syndrome, and it is estimated to affect 1 billion individuals worldwide [9]. On pathological diagnosis: Hepatic steatosis is commonly diagnosed when >5% of hepatocytes contain large lipid droplets or when intrahepatic triglyceride content is >5.6% [10]. NAFLD is characterized by overweight and/or visceral obesity, high fasting blood glucose, dyslipidemia, hypertension and other metabolic syndrome related components. Sterol regulatory element binding proteins (SREBPs) is the general term for three major nuclear transcription factors that control expression of lipogenic genes and adipocyte differentiation. Mammalian cells have two genes coding for three SREBPs isoforms: SREBP1a, SREBP1c, and SREBP2 [11]. Recent studies indicated that the increased lipid biosynthesis is mediated by the SREBP1 in the HCMV-infected cells [4,12,13]. Although SREBP1a and SREBP1c cannot be differentiated immunologically, studies using transgenic and knockout mice have shown that SREBP1a regulates gene expression for both fatty acid and cholesterol synthesis, but SREBP1c activates only genes in fatty acid synthesis. Furthermore, SREBP1c plays an important role in the development of hepatic steatosis [14,15].
In this study, we aimed to observe the changes in the signs of UL122 genetically modified mice and the effect of IE2 on the expression of SREBP1c and explore the mechanism of lipid metabolism in liver. Due to the highly species-specific nature of HCMV, our laboratory established a UL122 genetically modified mice model. The establishment of the UL122 genetically modified mice model overcame species specificity, an innovation which will contribute to understanding the mechanisms of IE2 inducing diseases, as well as providing a theoretical basis for the prevention and treatment of some diseases.
Materials and methods
Animals
Four UL122 genetically modified mice (two males and two females, C57BL/6) that can persistently and steadily express IE2 in an organismic internal environment were obtained from the Laboratory of Pathogenic Biology of Qingdao University. All animal experiments were authorized by the Animal Experiments Committee of Qingdao University. Four C57BL/6 wild-type breeding mice (two males and two females) mated with the UL122 genetically modified mice randomly, and four pairs were divided respectively into four cages kept in an SPF environment. We extracted the DNA of the mice and used PCR technology to identify the UL122 genetically modified mice. The genotyping was performed after weaning at 4-6 weeks, and the male littermates were divided into two groups: UL122 positive mice and UL122 negative mice. Finally, the test mice studies included sixteen, 12 to 16 week-old male UL122 positive mice as the experimental group and sixteen male wild-type mice of the same age as the control group that were in an SPF environment.
DNA extraction and RT-PCR
DNA extraction was prepared from each rat tail by using a CWBIO Universal Genomic DNA Kit (lot: 50223) and the RT-PCR amplification of HCMV IE2 gene [5’-GCAATTCTTTGAGGCTCCAC-3’ and 5’-CCGCAAGAACAAGAGCAAAC-3’, 470 bp]. The mixture was incubated at 94°C for 5 min and then 35 cycles of 94°C, 30 sec; 60°C, 35 sec; 72°C, 1 min, and a further 72°C for 10 min. The PCR products were identified by restriction enzyme and sequence analysis.
Clinical and metabolic characteristics
General data including age, physical examination (body weight [g] measured weekly up to 36 weeks), and biochemical indicators, including TC, TG, HDL-C, LDL-C, and FPG, were recorded. All the mice were put on an overnight fast for over 12 h, and a 1 ml blood sample was analyzed in the clinical laboratory of Qingdao University Affiliated Hospital. TC (CHOD-PAP method), TG (GPO-PAP method), HDL-L (IRC method), LDL-L (CAT method) and FPG (glucose oxidase method) were measured on an analyzer (Hitachi 7600-020, Hitachi, Tokyo, Japan).
Triglyceride quantification in the liver
Triglyceride (TG) content was measured using a colorimetric assay (Applygen, Beijing, China). All samples were determined in duplicate, and the triglyceride values were expressed as mg of triglycerides/g of protein.
Real-time PCR assay
After 36 weeks, we sacrificed all the mice and removed the livers, and we processed the relevant experiments. Total RNA was extracted from the hepatocyte using an RNA isolation kit (TIANGEN) and reverse transcribed using a reverse transcription kit (Roche). 5 ul of the reverse transcripts was added to a 15 ul PCR mixture (FastStart Essential DNA Green Master) for 40 cycles with a BIO-Rad iQ™5 Instrument. The primers were as follows: 5’-GCGCTACCGGTCTTCTATCA-3’ and 5’-GGATGTAGTCGATGGCCTTG-3’ (SREBP1c, 113 bp); 5’-GTGCTATGTTGCTCTCTAGACTTGG-3’ and 5’-ATGCCACAGGATTCCATACC-3’ (β-actin, 174 bp).
HE staining and oil red o-stained of mice liver
Approximately 3 μm paraffin sections from the liver tissues were stained with H&E and examined by a lighted microscope (from Olympus, Japan). 5 μm frozen sections of the liver tissue were stained with saturated Oil Red O staining solution (G1260, Solarbio).
Immunohistochemistry
The livers of all the mice were isolated, fixed with 4% Citromint and embedded in paraffin, cut into 3 μm sections, and immunostained. 3 μm liver sections were put on the charged slides, baked at 60°C for 40 min, then deparaffinized, rehydrated, and placed in boiling water for 2 min, then we performed antigen retrieval with a sodium citrate buffer (pH 6.0) for 40 min. After they cooled to room temperature, the sections were washed by distilled water and PBS for 15 min. Endogenous catalase was inactivated with 3% hydrogen peroxide. The sections were then incubated with the primary antibody in the incubator at 37°C for 1 hour. (the SREBP1 antibodies were diluted at 1:50, Cloud-Clone Corp.; the anti-IE2 antibody was diluted at 1:25, Millipore, USA). After being washed with distilled water and PBS, the sections were incubated with secondary antibodies for 40 min. Then the tissue sections were exposed to DAB for 1 min; and hematoxylin for 50 seconds; a differentiate solution for 1 second, and then they were observed after the neutral gum seal.
Statistical analyses
Statistical analyses were conducted using SPSS 24.0 (SPSS Inc., Chicago, IL, USA). Data were given as the mean ± SEM or median (interquartile range). The differences between the two groups were compared by independent two-tailed Student’s t test for normally distributed data, otherwise by Mann-Whitney U tests. The statistics of space exploration trials, immunohistochemistry and real-time PCR were analyzed using Student’s-t test. All P values were 2-tailed, with a significance level of 0.05.
Results
Results of the identification of UL122 genetically modified mice
The product of the PCR was electrophoresed with 1.2% agarose gel (GenGreen from Super GelRed, 1000× in water). PCR product size: 470 bp. The results are shown in Figure 1. According to the expression of the UL122 gene in the picture, the mice were divided into groups of UL122 positive mice and UL122 negative mice. Meanwhile, the UL122 positive mice were treated as the experimental group and the wild-type mice as the control group.
Figure 1.
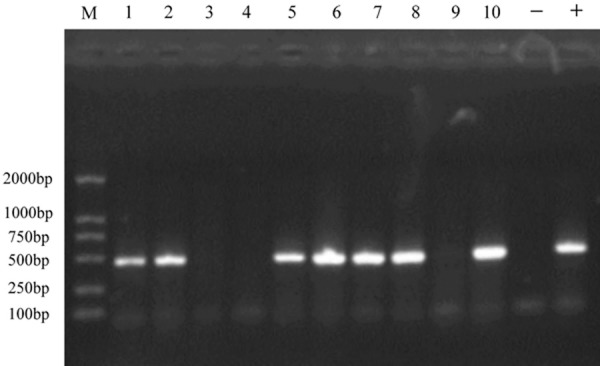
Identification of the UL122 positive and negative mice by PCR. (Lanes 1-2, 5-8,10) positive mice, the UL122 gene was extracted from the mice tails. (Lanes 3-4, 9) the negative mice, in which UL122 gene was not extracted from the tails. (Lanes -, +) the water control and positive. PCR product size: 470 bp.
Subject characteristics
Clinical characteristics of the subjects are shown in Table 1. All mice involved in the experiment were weighed once a week for up to 36 weeks, and there was a statistical difference (P<0.05) in body weight from 30 weeks (Figure 2A). Meanwhile, all mice were bled from an orbit once a week from 30 to 36 weeks. The measured data were statistically analyzed using SPSS. The FPG and TG concentrations and the weight in the experimental group were significantly higher than in the control group. There was no significant difference in age, TC, LDL, or HDL between the experimental group and the control group. In addition, hepatic triglyceride levels were significantly increased in the experimental group (Figure 2B).
Table 1.
Serum biochemical indexes of 36-week-old mice
| Experimental group (male) | Control group (male) | P value | |
|---|---|---|---|
| Number of mice | 16 | 16 | |
| Age (weeks) | 36 | 36 | |
| Weight (g) | 35.01 (30.5-38.7) | 30.42 (29.4-31.5)** | <0.01 |
| FPG (mmol/L) | 11.49 (9.6-14.1) | 10.01 (8.4-11.9)*** | <0.001 |
| TG (mmol/L) | 0.49 (0.26-0.62) | 0.32 (0.17-0.50)* | <0.05 |
| T-CHO (mmol/L) | 2.31 (1.89-2.78) | 2.04 (1.49-2.57) | 0.076 |
| HDL-C (mmol/L) | 1.36 (0.78-1.99) | 1.57 (0.84-2.21) | 0.318 |
| LDL-C (mmol/L) | 0.34 (0.27-0.43) | 0.39 (0.30-0.52) | 0.094 |
P<0.05;
P<0.01;
P<0.001.
Figure 2.
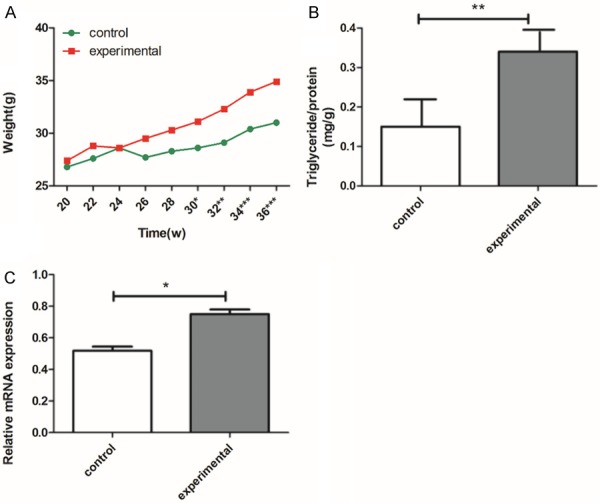
Weight increase, and total triglyceride levels were detected from liver tissue and mRNA expression of SREBP1c in different groups. A. Weight increases of the experimental group and the control group were monitored once every two weeks from 20 to 36 weeks; there was a difference (P<0.05) in body weight from 30 weeks. B. Total triglyceride levels were detected from the liver tissue. The figure shows that TG levels were markedly increased in the experimental group compared to the control group. C. Human cytomegalovirus (HCMV) up-regulated the mRNA expression of SREBP1c. Expression levels of SREBP1c assayed by real time-PCR. The experimental group is the UL122 positive group; the control group is wild-type mice group. Means ± SEM, n=16 mice per group, *P<0.05; **P<0.01; ***P<0.001 vs. control group.
HCMV infection up-regulated the mRNA of SREBP1c in liver
Real-time-PCR was used to evaluate the mRNA of SREBP1 after HCMV infection. As shown in Figure 2C, compared to control group, the mRNA of SREBP1 was significantly up-regulated in the experimental group, while there was no change in the control group.
HE staining and oil red o-staining
H&E staining and Oil Red O staining showed that hepatic lipid droplets increased in the 36-week-old UL122 positive mice (Figure 3A-D). Under the microscope, vacuoles of various sizes appeared in the denatured hepatocyte cytoplasm and were more densely distributed throughout the cytoplasm in the experimental group.
Figure 3.
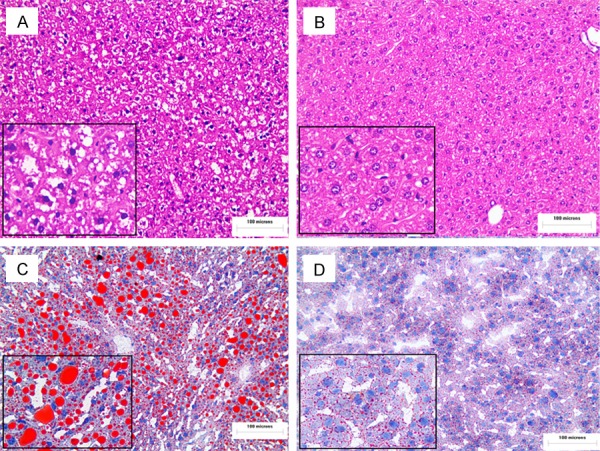
Increased lipid droplets in fatty liver in UL122 positive mice. Sections of the liver from the experimental group and the control mice were subjected to H&E staining and analysis using an OLYMPUS FSX100 microscope with a 200× objective lens (A, B). Oil red O-stained liver sections (X200) (C, D). As the picture shows, there was hepatic steatosis in the experimental group (A, C) vs. the control group (B, D). The experimental group is the UL122 positive group; the control group is wild-type mice group.
Immunohistochemistry
The expression of the IE2 level in the experimental group was positive (Figure 4A). Figure 4B, shows the control group, and the nuclear staining was all negative. In addition, a relative increase in SREBP1c expression in the experimental group livers was also evident in the immunohistochemistry liver sections (Figure 5A, 5B). The results indicated that the SREBP1c expression level was dramatically higher in the experimental group than in the control group (Figure 5C).
Figure 4.
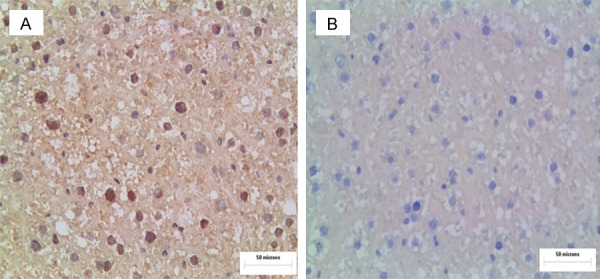
IE2 immunohistochemistry in the livers of experimental group and the control group mice. Immunohistochemistry for IE2 in the liver of mice (A, B). In the experimental group, nuclear staining was strongly positive (A). The experimental group is the UL122 positive mice group; the control group is the wild-type mice group.
Figure 5.
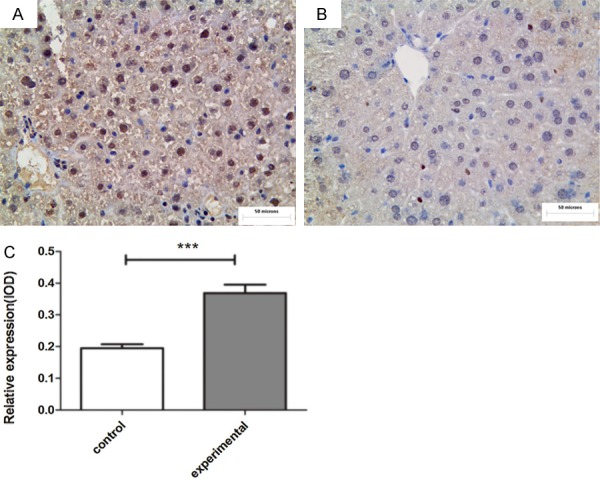
SREBP1c immunohistochemistry in the livers of the experimental and control groups (A, B). Compared with control group (B), the expression of SREBP1c in the experimental group (A) was obviously increased. The staining localization was in the nuclei and/or the cytoplasm. Relative expression of SREBP1c in the livers (C). The experimental group is the UL122 positive mice group, the control group is wild-type mice group. (n=16 per group; **P<0.01: significantly different from the control group; the bars indicate the means ± SEM). Bar: 400 μm.
Discussion
For decades, the study of the mechanism of abnormal lipid metabolism was mostly performed at the level of extracellular HCMV infection cells and was rarely studied in vivo. Due to the highly species-specific nature of HCMV, the study of IE2 is limited to in vitro models of infection and to the study of animal CMVs that coevolved with the species. The establishment of UL122 genetically modified mice overcame the species specificity hurdle and provides an effective way to study the influence of IE2 on NAFLD.
Many earlier studies have provided compelling evidence that HCMV infection is a major effector of lipid metabolism disorders, such as atherosclerosis and coronary heart disease [6,16]. HCMV can be activated and induce a disseminated infection damaging to a wide range of tissues and organs. Interestingly, our findings showed that HCMV infection can increase serum triglyceride levels and triglyceride content in hepatocyte and promote hepatic steatosis as well. These results indicate that HCMV infection may be one of the initiating factors of NAFLD. Additionally, our study concludes that IE2 up-regulated the expression of SREBP1c. SREBP1c expression was highly increased in our UL122 positive mice. High SREBP1c expression resulted in significantly increased hepatic lipid accumulation [17,18]. In conclusion, our data show that HCMV-mediated infection can induce NAFLD by increasing the expression of SREBP1c.
In normal cells, lipid synthesis is diminished, since lipid requirements are low. In contrast, HCMV-infected cells, like tumor cells, require a high rate of de novo lipid synthesis for cell membrane production and lipid-based posttranslational protein modification [4]. The activation of fatty acid synthesis results in the accumulation of enlarged lipid droplets in the cytoplasm of cells in the infected cultures.
Clinical data showed that obesity and liver injury patients with HCMV infection usually had an abnormal lipid metabolism. However, the molecular mechanism of HCMV infection on the body’s lipid metabolism disorders remains unknown. As an enveloped virus, HCMV requires fatty acids to form a membrane [4,19]. Meanwhile, HCMV infection can induce dramatic changes in glucose and glutamine metabolism [20,21]. The increased glucose flux is not used for energy production; instead, a large amount of glucose-derived carbon supports lipid biosynthesis [12]. A series of studies showed that HCMV induces the expression of glucose transporter 4 and its translocation to the cell surface, resulting in the accumulation of cytoplasmic glucose and increased fatty acid biosynthesis [22].
Hepatic lipid accumulation in the context of NAFLD is often associated with hepatic insulin resistance [23], and NAFLD is considered an important risk factor for type 2 diabetes [24]. In addition, the clinical data suggest that HCMV infection is associated with type 2 diabetes [25]. However, no conclusions as to the role of this virus in the pathogenesis of type 2 diabetes can be drawn at present [26,27]. Horton et al. have shown that SREBP1c is the dominant insulin-stimulated isoform in the liver responsible for inducing lipogenic gene expression and promoting fatty acid synthesis [18]. Insulin activates the SREBP1c transcription factor to promote hepatic lipogenesis [15]. Simultaneously, we observed weight gain, hyperglycemia, and dyslipidemia in our UL122 positive mice (Table 1). The FBG concentrations in UL122 positive mice were significantly higher than in the UL122 negative mice (P<0.001). Viewing all of the data available, we note that HCMV infection can promote the development of NAFLD, and this relationship may be related to insulin resistance.
Based on the evidence obtained from previous studies, we hypothesized that HCMV infection can induce hepatic insulin resistance in the body. Due to the body’s insulin resistance, the body will show a series of glycolipid metabolism disorder symptoms, such as obesity, diabetes, and hepatic steatosis.
Therefore, in our next study, we will examine the molecular mechanisms of HCMV infection on the body’s glycolipid disorders from the path of insulin resistance. In summary, this study revealed the role of HCMV infection in the development and progression of NAFLD, elucidated the biological functional relationship between HCMV and NAFLD, and provided a new perspective for exploring the pathogenesis of NAFLD.
Acknowledgements
The authors are grateful to the individuals who helped to make this study possible. This work was supported by the National Natural Science Foundation of China (81471958).
Disclosure of conflict of interest
None.
References
- 1.Li L, Li Y, Dai Z, Liu M, Wang B, Liu S, Wang L, Chen L, Tan Y, Wu G. Lipid metabolism in vascular smooth muscle cells infuenced by HCMV infection. Cell Physiol Biochem. 2016;39:1804–1812. doi: 10.1159/000447880. [DOI] [PubMed] [Google Scholar]
- 2.Purdy JG, Shenk T, Rabinowitz JD. Fatty acid elongase 7 catalyzes lipidome remodeling essential for human cytomegalovirus replication. Cell Rep. 2015;10:1375–85. doi: 10.1016/j.celrep.2015.02.003. [DOI] [PMC free article] [PubMed] [Google Scholar]
- 3.Grahame-Clarke C. Human cytomegalovirus, endothelial function and atherosclerosis. Herpes. 2005;12:42–5. [PubMed] [Google Scholar]
- 4.Yu Y, Maguire TG, Alwine JC. Human cytomegalovirus infection induces adipocyte-like lipogenesis through activation of sterol regulatory element binding protein 1. J Virol. 2012;86:2942–9. doi: 10.1128/JVI.06467-11. [DOI] [PMC free article] [PubMed] [Google Scholar]
- 5.Murphy E, Rigoutsos I, Shibuya T, Shenk TE. Reevaluation of human cytomegalovirus coding potential. Proc Natl Acad Sci U S A. 2003;100:13585–90. doi: 10.1073/pnas.1735466100. [DOI] [PMC free article] [PubMed] [Google Scholar]
- 6.Du Y, Zhang G, Liu Z. Human cytomegalovirus infection and coronary heart disease: a systematic review. Virol J. 2018;15:31. doi: 10.1186/s12985-018-0937-3. [DOI] [PMC free article] [PubMed] [Google Scholar]
- 7.Stenberg RM, Depto AS, Fortney J, Nelson JA. Regulated expression of early and late RNAs and proteins from the human cytomegalovirus immediate-early gene region. J Virol. 1989;63:2699–708. doi: 10.1128/jvi.63.6.2699-2708.1989. [DOI] [PMC free article] [PubMed] [Google Scholar]
- 8.Stinski MF, Petrik DT. Functional roles of the human cytomegalovirus essential IE86 protein. Curr Top Microbiol Immunol. 2008;325:133–52. doi: 10.1007/978-3-540-77349-8_8. [DOI] [PubMed] [Google Scholar]
- 9.Loomba R, Sanyal AJ. The global NAFLD epidemic. Nat Rev Gastroenterol Hepatol. 2013;10:686–90. doi: 10.1038/nrgastro.2013.171. [DOI] [PubMed] [Google Scholar]
- 10.Szczepaniak LS, Nurenberg P, Leonard D, Browning JD, Reingold JS, Grundy S, Hobbs HH, Dobbins RL. Magnetic resonance spectroscopy to measure hepatic triglyceride content: prevalence of hepatic steatosis in the general population. Am J Physiol Endocrinol Metab. 2005;288:E462–8. doi: 10.1152/ajpendo.00064.2004. [DOI] [PubMed] [Google Scholar]
- 11.Eberle D, Hegarty B, Bossard P, Ferré P, Foufelle F. SREBP transcription factors: master regulators of lipid homeostasis. Biochimie. 2004;86:839–48. doi: 10.1016/j.biochi.2004.09.018. [DOI] [PubMed] [Google Scholar]
- 12.Yu Y, Maguire TG, Alwine JC. ChREBP, a glucose-responsive transcriptional factor, enhances glucose metabolism to support biosynthesis in human cytomegalovirus-infected cells. Proc Natl Acad Sci U S A. 2014;111:1951–6. doi: 10.1073/pnas.1310779111. [DOI] [PMC free article] [PubMed] [Google Scholar]
- 13.Yu Y, Pierciey FJ Jr, Maguire TG, Alwine JC. PKR-like endoplasmic reticulum kinase is necessary for lipogenic activation during HCMV infection. PLoS Pathog. 2013;9:e1003266. doi: 10.1371/journal.ppat.1003266. [DOI] [PMC free article] [PubMed] [Google Scholar]
- 14.Martinez R, Kapravelou G, Donaire A, Lopez-Chaves C, Arrebola F, Galisteo M, Cantarero S, Aranda P, Porres JM, López-Jurado M. Effects of a combined intervention with a lentil protein hydrolysate and a mixed training protocol on the lipid metabolism and hepatic markers of NAFLD in zucker rats. Food Funct. 2018;9:830–850. doi: 10.1039/c7fo01790a. [DOI] [PubMed] [Google Scholar]
- 15.Yecies JL, Zhang HH, Menon S, Liu S, Yecies D, Lipovsky AI, Gorgun C, Kwiatkowski DJ, Hotamisligil GS, Lee CH, Manning BD. Akt stimulates hepatic SREBP1c and lipogenesis through parallel mTORC1-dependent and independent pathways. Cell Metab. 2011;14:21–32. doi: 10.1016/j.cmet.2011.06.002. [DOI] [PMC free article] [PubMed] [Google Scholar]
- 16.Guo N, Zhang N, Yan L, Cao X, Lv F, Wang J, Wang Y, Cong H. Down-regulation of single-stranded DNA-binding protein 1 expression induced by HCMV infection promotes lipid accumulation in cells. Braz J Med Biol Res. 2017;50:e6389. doi: 10.1590/1414-431X20176389. [DOI] [PMC free article] [PubMed] [Google Scholar]
- 17.He Q, Diao Y, Zhao T, Hou B, Ngokana LD, Liang H, Nie J, Tan P, Huang H, Li Y, Qi L, Zhao Y, Liu Y, Gao X, Zhou L. SREBP1c mediates the effect of acetaldehyde on cidea expression in alcoholic fatty liver Mice. Sci Rep. 2018:8. doi: 10.1038/s41598-018-19466-z. [DOI] [PMC free article] [PubMed] [Google Scholar]
- 18.Horton JD, Goldstein JL, Brown MS. SREBPs: activators of the complete program of cholesterol and fatty acid synthesis in the liver. J Clin Invest. 2002;109:1125–31. doi: 10.1172/JCI15593. [DOI] [PMC free article] [PubMed] [Google Scholar]
- 19.Spencer CM, Schafer XL, Moorman NJ, Munger J. Human cytomegalovirus induces the activity and expression of acetyl-coenzyme a carboxylase, a fatty acid biosynthetic enzyme whose inhibition attenuates viral replication. J Virol. 2011;85:5814–24. doi: 10.1128/JVI.02630-10. [DOI] [PMC free article] [PubMed] [Google Scholar]
- 20.Chambers JW, Maguire TG, Alwine JC. Glutamine metabolism is essential for human cytomegalovirus infection. J Virol. 2010;84:1867–73. doi: 10.1128/JVI.02123-09. [DOI] [PMC free article] [PubMed] [Google Scholar]
- 21.Munger J, Bennett BD, Parikh A, Feng XJ, McArdle J, Rabitz HA, Shenk T, Rabinowitz JD. Systems-level metabolic flux profiling identifies fatty acid synthesis as a target for antiviral therapy. Nat Biotechnol. 2008;26:1179–86. doi: 10.1038/nbt.1500. [DOI] [PMC free article] [PubMed] [Google Scholar]
- 22.Yu Y, Maguire TG, Alwine JC. Human cytomegalovirus activates glucose transporter 4 expression to increase glucose uptake during infection. J Virol. 2011;85:1573–80. doi: 10.1128/JVI.01967-10. [DOI] [PMC free article] [PubMed] [Google Scholar]
- 23.Bugianesi E, Gastaldelli A, Vanni E, Gambino R, Cassader M, Baldi S, Ponti V, Pagano G, Ferrannini E, Rizzetto M. Insulin resistance in non-diabetic patients with non-alcoholic fatty liver disease: sites and mechanisms. Diabetologia. 2005;48:634–42. doi: 10.1007/s00125-005-1682-x. [DOI] [PubMed] [Google Scholar]
- 24.Anstee QM, Targher G, Day CP. Progression of NAFLD to diabetes mellitus, cardiovascular disease or cirrhosis. Nat Rev Gastroenterol Hepatol. 2013;10:330–44. doi: 10.1038/nrgastro.2013.41. [DOI] [PubMed] [Google Scholar]
- 25.Zhang J, Liu YY, Sun HL, Li S, Xiong HR, Yang ZQ, Xiang GD, Jiang XJ. High human cytomegalovirus IgG level is associated with increased incidence of diabetic atherosclerosis in type 2 diabetes mellitus patients. Med Sci Monit. 2015;21:4102–10. doi: 10.12659/MSM.896071. [DOI] [PMC free article] [PubMed] [Google Scholar]
- 26.Liang H, Liang YZ, Chen H, Yu ZQ, Su JH, Wu ZB, Qin JY. [Role of cytomegalovirus infection in the pathogenesis of type 2 diabetes mellitus] . Zhonghua Shi Yan He Lin Chuang Bing Du Xue Za Zhi. 2003;17:351–3. [PubMed] [Google Scholar]
- 27.Lohr M, Bergstrome B, Maekawa R, Oldstone MB, Klöppel G. Human cytomegalovirus in the pancreas of patients with type 2 diabetes: is there a relation to clinical features, mRNA and protein expression of insulin, somatostatin, and MHC class II? Virchows Arch A Pathol Anat Histopathol. 1992;421:371–8. doi: 10.1007/BF01606908. [DOI] [PMC free article] [PubMed] [Google Scholar]


