

Abstract
Previous studies have demonstrated that oncogenes, tumor suppressor genes, and hypoxic factors are involved in the pathogenesis, development, and progression of head and neck cancer. In this study, we investigated the expression of HIF-1α, GLUT-1, and beclin-1 in head and neck cancers and analyzed the relationship between these markers and clinicopathologic factors. 44 paraffin-embedded samples of head and neck cancer specimens were collected. The expression of HIF-1α, GLUT-1, Ki 67, and beclin-1 was detected by immunohistochemical technique. The expression of HIF-1α, GLUT-1, Ki 67, and beclin-1 in head and neck cancers were higher than those for the corresponding paracancerous tissues. Stratification analysis revealed a significant difference between GLUT-1 expression in older patients with laryngeal/hypopharyngeal SCC and younger patients with laryngeal/hypopharyngeal SCC. No significant differences in GLUT-1 or beclin-1 or HIF-1α or Ki 67 expression were found between clinicopathologic characteristics, including lymph node metastasis, T stage, clinical stage, and location, for any of the cancer types studied. Pearson analysis revealed that there was a negative correlation between beclin-1 and HIF-1α (r=0.482, P=0.001), and between beclin-1 and Ki-67 (r=-0.366, P=0.0151). Whether beclin-1 plays a role in carcinogenesis in head and neck cancers should be further studied.
Keywords: Head and neck cancer, HIF-1α, GLUT-1, Ki 67, beclin-1
Introduction
Head and neck cancers are common malignant tumors that result in low survival rates and poor quality of life [1]. However, the pathogenesis, mechanisms of development and progression, and optimal treatments for head and neck cancers are unknown [1]. Previous studies have demonstrated that oncogenes [2], tumor suppressor genes [3], and hypoxic factors [4-7] are involved in the pathogenesis, development, and progression of head and neck cancers as in other malignant tumors.
Chemo-radiotherapy resistance in head and neck cancers results from the interaction of multiple factors [1]. Previous studies have shown that hypoxia inducible factor-1α (HIF-1α) is associated with poor prognosis, lymph node metastasis, and T stage in head and neck cancers [5-7]. HIF-1α is a key transcription factor that, under hypoxic conditions, can cause increased cancer cell invasion, distant metastasis, and chemoradiotherapy resistance [8]. Upregulated HIF-1α increases the expression of related genes that control tumor angiogenesis through factors such as vascular endothelial growth factor (VEGF), and it regulates the expression of a series of enzymes involved in glycolysis, including glucose transporter (GLUT) proteins [9]. Increases in GLUT-1, the main glucose transporter, meet the energy supply of malignant tumor cells due to the Warburg effect [10]. Increased levels of GLUT-1 expression are associated with a range of carcinomas, including head and neck cancers [10,11]. High-level GLUT-1 expression is also associated with a poor prognosis and radioresistance [10,12,13]. A significant relationship between HIF-1α and GLUT-1 in head and neck cancers has been demonstrated in several studies to date [5,14,15]. Several previous studies have demonstrated that the inhibition of GLUT-1 or HIF-1α expression can enhance radiosensitivity [12,13,15]. However, the mechanism underlying the effect of HIF-1α and GLUT-1 expression on radioresistance is unclear.
Recently, autophagy has become a major focus in cancer research. Autophagy has been demonstrated to be associated with carcinogenesis and progression in several cancers [16-18] including laryngeal [17] and hypopharyngeal squamous cell carcinoma (SCC) [18]. Autophagy is considered a double-edged sword in cancer progression because a base level of autophagy leads to cell survival, but prolonged activation of autophagy may cause cell death [19,20]. Under hypoxic conditions, HIF-1α has been shown to play a role in autophagy induction. HIF-1α can regulate the expression of autophagy-associated genes (ATG) [19,20]. Beclin-1 is a mammalian ortholog of yeast Atg6/vps 30 and has been mapped to a tumor susceptibility locus ~150 kb centromeric to BRCA1 on human chromosome 17q21 [21]. Beclin-1 is considered a candidate tumor suppressor gene, and its decreased expression or loss can lead to progression [22-26], an unfavorable prognosis, and chemo-radioresistance, [27-29] in multiple human cancers, including laryngeal carcinoma [17,30]. However, there is disagreement on the effect of high beclin-1 expression. Some studies have shown that high beclin-1 expression is associated with a favorable prognosis [31,32], while other studies have shown that high expression is associated with an unfavorable prognosis [33,34]. The reason for this discrepancy may be differences in the intrinsic properties of different tumors [26]. HIF-1α or GLUT-1 is associated with beclin-1 expression in some solid tumors. However, to our knowledge, no studies have evaluated the relationship between HIF-1α, GLUT-1, and beclin-1 in human solid cancers.
In this study, we investigated the expression of HIF-1α, GLUT-1, and beclin-1 in head and neck cancers and analyzed the relationship between these markers and clinicopathologic factors.
Materials and methods
Tissue specimens and patients
In total, 44 paraffin-embedded samples of head and neck cancer specimens (including 12 laryngeal SCC specimens, 17 hypopharyngeal SCC specimens, 15 papillary thyroid carcinomas) and 10 adjacent paracarcinoma tissue specimens (5 laryngeal adjacent paracarcinoma tissues at a distance of 0.5 mm from the tumor, 5 hypopharyngeal paracarcinoma tissues at a distance of 2 cm from the tumor, and 5 normal adjacent thyroid tissues) were collected between November 2013 and November 2014 for immunohistochemical analysis. All tissue samples were collected prior to chemotherapy and/or radiotherapy. All samples were confirmed as SCC by surgery or biopsy. This study was approved by the institutional review board (IRB no. 2017) of The First Affiliated Hospital, College of Medicine, Zhejiang University (Hangzhou, China); informed consent was obtained from all patients.
Demographic data and tumor staging
Data on each patient’s age; smoking history; drinking history; tumor, node, and metastasis (TNM) stage; clinical stage; primary site; degree of differentiation; surgical margins; lymph node metastasis; recurrence; and survival were obtained. Patients were also evaluated with respect to age <60 years and ≥60 years. TNM stage was determined according to the International Union Against Cancer 2002 system (Tis/T1/T2, T3/T4), clinical stage (early: 0/I/II, late: III/IV), and degree of tumor differentiation according to the pathological results (high-medium, moderate, low-medium, and low).
Follow-up
A follow-up examination was performed every month during the first year, every 3 months during the second year, and every 6 months during the third to fifth years. Follow-up consisted of a regular physical examination, dynamic laryngoscopy, chest X-ray, or computed tomography (CT) of the lung, abdominal ultrasound, and tumor primary site examination, by CT, magnetic resonance imaging, or 18F-fluorodeoxyglucose positron emission tomography/CT (FDG-PET/CT). The last follow-up was March 2, 2017. Survival time was calculated from the date of patient discharge or end of radiation therapy to the patient’s death or the date of the last follow-up.
Immunohistochemistry
The 4-µm-thick sections were rehydrated in xylene twice for 5 min each, then in a mixed solution of xylene and ethanol for 2 min, followed by 100% ethanol, 95% ethanol, 85% ethanol, and 75% ethanol for 5 min each, and finally hydrated in ethanol and distilled water for 2 min. The sections were then washed three times for 3 min each in phosphate-buffered saline (PBS, pH 7.4). Endogenous peroxidase was blocked by placing a drop of 3% hydrogen peroxide on each section, followed by a 10-min incubation at room temperature and three washes with PBS for 3 min each. The sections were then incubated with normal serum for 20 min at 37°C and then with primary antibodies for 60 min at 37°C. After three washes with PBS for 5 min each, a drop of polymer enhancer (reagent A) was added for 20 min at 37°C and the sections were washed three times with PBS for 3 min. Then, the sections were incubated with 1:50 beclin-1 (Proteintech, Chicago, IL, USA), 1:50 GLUT-1 (Proteintech), 1:50 HIF-1α (Proteintech), and 1:50 Ki-67 (Proteintech) for 60 min at room temperature. Next, the sections were incubated with Streptavidin-horseradish peroxidase (Boster, Wuhan, China) for 30 min at room temperature. After three washes with PBS, two drops of the freshly prepared 3,3’-diaminobenzidine (DAB) or aminoethyl carbazole (AEC) were added, and the colorimetric reaction was visualized through a microscope for 3-10 min. Positive sections were brown (DAB) or red (AEC). The sections were then washed with distilled water before immersing in methanol, 0.1% hydrochloric acid, and then water. After additional PBS washes, the sections were counterstained with hematoxylin and eosin, dehydrated, and examined under a light microscope. Photos were taken using a microscopic imaging system.
Optical density measurement
The immunohistochemistry images were analyzed using ImagePro-Plus software (Media Cybernetics, Inc., Rockville, MD, USA). Briefly, the optical density was calibrated and the parameter measurements were designed. Positive regions were extracted and separated from the surrounding tissue. The positive color segmentation threshold was determined using the hue, saturation, and brightness model. The configurations of the image segmentation document were saved and the segmentation adjustment for all images was consistent. After image segmentation, an eight-bit gray-scale picture was transferred to directly measure the integral optical density (IOD). The area was selected and measured. The IOD/Area (sum) was calculated and the data were input into Excel.
Statistical analysis
All statistical analyses were performed using SPSS for Windows (ver. 20.0; IBM Corp., Armonk, NY, USA). A t-test was used to analyze the expression of beclin-1, GLUT-1, and HIF-1α in different tissues. The Pearson test was used for correlation analysis. A P-value less than 0.05 was regarded as significant.
Results
Patient characteristics
Of the 44 samples, 12 (27.3%) were laryngeal SCCs, 17 (38.6%) were hypopharyngeal SCCs, and 15 (34.1%) were papillary thyroid carcinomas. Of the patients, 12 were female and 34 were male. The average age of the patients was 56.4 years (range: 29-79). Of the 12 cases of laryngeal cancer, 10 (83.3%) were located in the glottic area and 2 (16.7%) were found in the supraglottic area. Of the 17 cases of hypopharyngeal cancer, 15 (88.2%) were located in the pyriform sinus, 1 (5.9%) was located in the posterior pharyngeal wall, and 1 (5.9%) was located in the postcricoid region. TNM classification revealed nine T1N0M0 cases, four T1N1M0 cases, three T2N0M0 cases, one T1N2M0 case, eight T2N1M0 cases, two T2N2M0 cases, one T3N0M0 case, three T3N2M0 cases, four T3N1M0 cases, one T4N0M0 case, three T4N1M0 cases, four T4N2M0 cases, and one T4N1bM1 case. There were 14 stage I (31.2%) cases, 3 stage II cases (6.8 %), 11 stage III cases (25.0%), and 16 stage IV cases (36.4%) (Table 1).
Table 1.
Clinicopathological features, beclin-1, GLUT-1, HIF-1α, and Ki-67 in patients with head and neck cancer
| Characteristic | N | Beclin-1 | p | GLUT-1 | p | HIF-1α | p | Ki-67 | p |
|---|---|---|---|---|---|---|---|---|---|
| Gender | |||||||||
| Male | 32 | 0.0109±0.0087 | 0.643 | 0.0263±0.0175 | 0.232 | 0.0287±0.0132 | 0.116 | 0.0051±0.0031 | 0.114 |
| Female | 12 | 0.0096±0.0072 | 0.0198±0.0106 | 0.0210±0.0104 | 0.0036±0.0004 | ||||
| Age | |||||||||
| <60 | 25 | 0.0112±0.0068 | 0.571 | 0.0206±0.0126 | 0.060 | 0.0261±0.0127 | 0.937 | 0.0043±0.0022 | 0.338 |
| ≥60 | 19 | 0.0098±0.0100 | 0.0298±0.0190 | 0.0257±0.0132 | 0.0052±0.0034 | ||||
| Locations | |||||||||
| Larynx | 12 | 0.0117±0.0120 | 0.608 | 0.237±0.0166 | 0.648 | 0.0314±0.0160 | 0.154 | 0.0062±0.0039 | 0.172 |
| Hypopharynx | 17 | 0.0099±0.0065 | 0.0281±0.0195 | 0.0241±0.0110 | 0.0045±0.0024 | ||||
| Thyroid | 15 | 0.0104±0.0069 | 0.0212±0.0107 | 0.00236±0.0110 | 0.0037±0.0016 | ||||
| T stage | |||||||||
| T1+T2 | 27 | 0.0107±0.0090 | 0.932 | 0.0259±0.0171 | 0.487 | 0.260±0.0142 | 0.940 | 0.0052±0.0032 | 0.112 |
| T3+T4 | 17 | 0.0104±0.0072 | 0.0224±0.0146 | 0.0257±0.0105 | 0.0039±0.0018 | ||||
| N stage | |||||||||
| N0 | 20 | 0.0120±0.0108 | 0.318 | 0.0214±0.0113 | 0.241 | 0.0269±0.0140 | 0.0631 | 0.0050±0.0034 | 0.539 |
| N1 | 24 | 0.0094±0.0053 | 0.0272±0.0191 | 0.0251±0.0118 | 0.0045±0.0022 | ||||
| Clinical stage | |||||||||
| I+II | 17 | 0.0135±0.0103 | 0.067 | 0.0224±0.0121 | 0.484 | 0.0269±0.01556 | 0.0053±0.0037 | 0.289 | |
| III+IV | 27 | 0.0088±0.0062 | 0.0253±0.0109 | 0.681 | 0.0043±0.0020 |
Abbreviations: HIF-1α: hypoxia inducible factor-1α; VEGF: vascular endothelial growth factor; GLUT: glucose transporter; GLUT-1: glucose transporter-1; SCC: squamous cell carcinoma; ATG: autophagy-associated genes; DAB: diaminobenzidine; AEC: aminoethyl carbazole; IOD: integral optical density; LI: labeling index.
Correlation between beclin-1, GLUT-1, HIF-1α, and Ki-67 expression and our clinicopathologic findings
Beclin-1 expression was found in the cytoplasm and membrane (Figure 1). The average optical density of beclin-1 was 0.0321±0.0101 and 0.0106±0.0082 in paracancerous tissues and in head and neck cancer tissues, respectively. The expression of beclin-1 in head and neck cancer tissues was significantly decreased compared to paracancerous tissues (t=8.330, P<0.001). In stratification analysis, the average beclin-1 expression levels in laryngeal/hypopharyngeal carcinoma, laryngeal carcinoma, hypopharyngeal carcinoma, and thyroid cancer were 0.0107±0.0017, 0.0117±0.0035, 0.0099±0.0016, and 0.0104±0.0069, respectively. These values are significantly lower than those for the corresponding paracancerous tissues [0.0345±0.0036 (t=6.743, P<0.001), 0.0397±0.0046 (t=4.565, P<0.001), 0.0292±0.0048 (t=5.031, P<0.001), and 0.0275±0.0054 (t=5.003, P<0.001), respectively] (Table 1). In the stratification analysis, no significant differences in beclin-1 or HIF-1α expression were found between clinicopathologic characteristics, including age, lymph node metastasis, T stage, clinical stage, and location, for any of the cancer types studied (Table 1).
Figure 1.
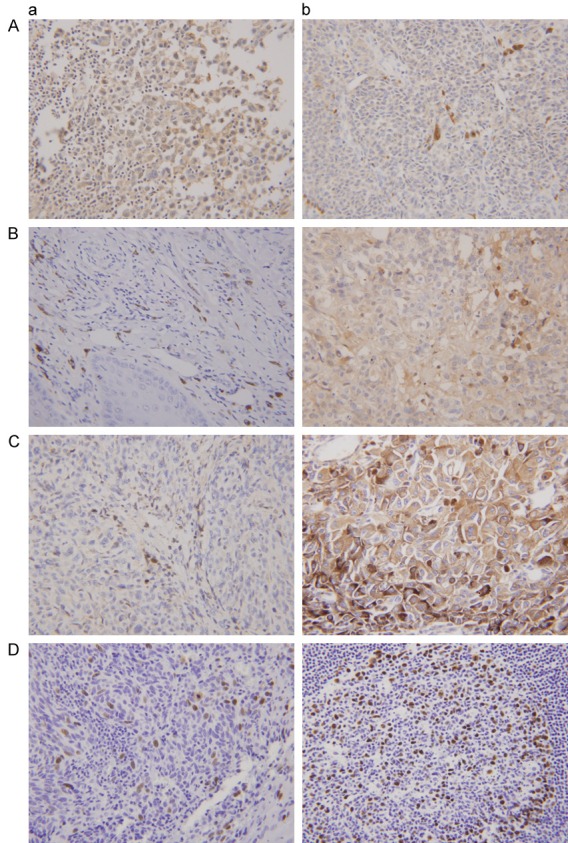
Expression of beclin-1, GLUT-1, HIF-1α, and Ki-67 of the patients with head and neck cancer by immunohistochemical methods. A: Beclin-1 (a: Paracancerous tissue; b: Head and neck cancer); B: GLUT-1 (a: Paracancerous tissue; b: Head and neck cancer); C: HIF-1α (a: Paracancerous tissue; b: Head and neck cancer); D: Ki-67 (a: Paracancerous tissue; b: Head and neck cancer).
The average optical density of GLUT-1 in paracancerous tissues was 0.0123±0.0075 compared to 0.0250±0.0162 in head and neck cancer tissues. The expression of GLUT-1 in head and neck cancers was significantly higher than in the corresponding paracancerous tissue (t=2.921, P=0.005). In the stratification analysis, the average GLUT-1 expression in laryngeal/hypopharyngeal carcinoma and thyroid cancer were 0.0273±0.0034 and 0.0212±0.0107, respectively. These values were significantly lower than in the corresponding paracancerous tissue [0.0147±0.0023 (t=2.083, P=0.044) and 0.0074±0.0055 (t=-2.732, P=0.014), respectively]. However, there was no difference between GLUT-1 expression in laryngeal/hypopharyngeal carcinoma compared to the corresponding paracancerous tissue (P=0.258 and 0.086, respectively) (Table 1). The stratification analysis revealed a significant difference between GLUT-1 expression in older patients with laryngeal/hypopharyngeal SCC and younger patients with laryngeal/hypopharyngeal SCC. However, there was no significant difference between GLUT-1 expression in laryngeal/hypopharyngeal SCC between clinicopathologic characteristics, including lymph node metastasis, T stage, clinical stage, and location. In addition, there were no significant differences in GLUT-1 expression between lymph node metastasis, T stage, clinical stage, or location in the thyroid cancer samples.
The average optical density of HIF-1α in paracancerous and head and neck cancer tissues was 0.0124±0.0038 and 0.0265±0.0132, respectively. The expression of HIF-1α in head and neck cancer tissues was significantly higher than in the corresponding paracancerous tissues (t=-4.070, P<0.001). The stratification analysis revealed that the average HIF-1α expression in laryngeal/hypopharyngeal carcinoma, hypopharyngeal carcinoma, and thyroid cancer was 0.0271±0.0025, 0.0119±0.0014, and 0.0223±0.0145, respectively. These expression values are significantly higher than those in corresponding paracancerous tissues [0.0120±0.0012 (t=3.441, P=0.001), 0.0119±0.0014 (t=2.680, P=0.014), and 0.0040±0.0049 (t=2.741, P=0.013), respectively]. However, there were no differences in HIF-1α expression in laryngeal carcinoma (0.0123±0.0024) compared with the corresponding paracancerous tissue [0.0271±0.0025 (t=1.994, P=0.068)] (Table 1).
The expression of Ki-67 in head and neck cancers (0.0061±0.0034) was significantly higher than in corresponding paracancerous tissues (0.0023±0.0023; t=-2.366, P=0.029). However, there were no differences in Ki-67 expression (average: 0.0041±0.0025) between laryngeal/hypopharyngeal SCC (0.0052±0.0031) or hypopharyngeal carcinoma (0.0042±0.0024) compared to the corresponding paracancerous tissues [(0.0047±0.0027 (t=-0.758, P=0.452), 0.0035±0.0029 (t=-1.493, P=0.144), and 0.0047±0.0038 (t=-0.331, P=0.744), respectively].
The correlation between beclin-1, GLUT-1, HIF-1α, and Ki-67 expression
Pearson analysis revealed that there was a negative correlation between beclin-1 and HIF-1α (r=0.482, P=0.001), and between beclin-1 and Ki-67 (r=-0.366, P=0.0151). There was no significant relationship between the other factors.
Discussion
Beclin-1 plays an important role in the initial stage of autophagy, and is an important regulator of autophagy formation. The human beclin 1 gene is located on chromosome 17q21 and is considered a candidate tumor suppressor gene [21]. Several studies have also found that low-level expression of beclin-1 is associated with carcinogenesis, progression, poor prognosis, and chemo-radioresistance in human solid tumors [22-32]. However, the mechanism of beclin-1 regulation is unclear. Some studies have revealed that hypoxia may affect the expression of beclin-1 in cancers [19,20]. HIF-1α and GLUT-1 are two important hypoxic markers [5,15]. In addition, several studies have shown that GLUT-1 is associated with carcinogenesis, progression, poor prognosis, and chemo-radioresistance in head and neck cancers. The main reason for this may be that GLUT-1 plays an important role in the Warburg effect in human solid malignant tumors. Several studies have also found that beclin-1 expression is associated with GLUT-1 expression in non-small cell lung cancer and breast cancer [36].
HIF-1α is a key transcriptional regulator of various genes related to cellular adaptive responses to hypoxia [5-7]. High-level expression of HIF-1α may lead to increased cancer cell invasion, distant metastasis, and resistance to chemo-radiotherapy [8]. High-level expression of HIF-1α may also induce increased expression of tumor angiogenesis genes such as VEGF and induce the expression of glycolytic factors such as GLUT-1 [9]. In hypoxic microenvironments, these genes, in synergy with HIF-1α, result in tumor invasion, progression, metastasis, resistance to treatment, and a poor prognosis. Previously, we found that GLUT-1 expression was associated with HIF-1α expression in head and neck malignant tumors and with a poor prognosis in laryngeal carcinoma [5,6,11]. Some studies have suggested that HIF-1α may mediate the expression of autophagy-related genes such as beclin-1 in malignant tumors [19,20,35-41]. Elevated beclin-1 expression correlates with HIF-1α expression, and is associated with invasion, metastasis, and a poor prognosis [19,20,35-41]. However, some studies have reported contradictory results about the relationship between beclin-1 expression and HIF-1α expression. Low-level expression of beclin-1 and upregulation of HIF-1α have been shown to be associated with distant metastasis risk and a poor prognosis [36,39,40]. Therefore, the relationship between beclin-1 and HIF-1α and the biologic behavior of cancer cells should be examined further.
To the best of our knowledge, no studies have examined the relationship between beclin-1 and HIF-1α, GLUT-1, or Ki-67. In this study, we found that the expression of beclin-1 in head and neck cancers was significantly decreased compared to corresponding paracancerous tissues (0.0106±0.0082 vs. 0.0321±0.0101, P<0.001). The stratification analysis revealed that beclin-1 expression in laryngeal/hypopharyngeal carcinoma, laryngeal carcinoma, hypopharyngeal carcinoma, and thyroid cancer was significantly lower than in corresponding paracancerous tissues. However, we found no relationship between beclin-1 and clinicopathological factors such as age, sex, location, lymph node metastasis, T stage, and clinical stage. These results are different from those of previous studies. Huang et al. [17] found that the expression of beclin-1 in 80 patients with laryngeal carcinoma was lower than in non-tumor tissues (P=0.035). These authors also showed that negative expression of beclin-1 was associated with increased lymphatic invasion (P=0.035) and a poor prognosis (P=0.005) [17]. In hypopharyngeal carcinoma tissues, Wang et al. [20] found that beclin-1 expression in 82 patients was lower than in adjacent non-cancerous tissues (42.75 vs. 79.6%, P<0.001). Low-level expression of beclin-1 was also found to correlate with tumor stage, lymph node metastasis, and a poor prognosis, and a multivariate analysis showed that beclin-1 expression was an independent prognostic factor. Sakakura et al. [42] showed that the expression rate of beclin-1 was 36.5% in 74 cases of oral SCC, and that beclin-1 expression was associated with lymphatic invasion (P=0.003) and differentiation at peripheral sites (P=0.006). However, other studies have shown that beclin-1 expression is elevated in some human solid malignant tumors [20,43,44]. A meta-analysis that included six studies on beclin-1 expression in colorectal cancer showed that elevated beclin-1 expression was associated with tumor metastasis and a poor prognosis [43]. Therefore, beclin-1 may serve as an efficient prognostic indicator in colorectal cancer. Li et al. [44] found that beclin-1 expression was positive in 76 out of 86 cases of papillary thyroid cancer, and that expression was negative or weak in non-cancerous tissues and normal tissues. High expression of beclin-1 was also associated with lymph node metastasis of papillary thyroid cancer [44]. The authors also suggested that autophagy maintains the energy supply to guarantee thyroid cancer cell survival under extreme conditions, especially in regions of rapid growth such as the front area of cancer nests [44]. Wan et al. [20] also found that high expression of beclin-1 was associated with poor overall, progression-free, and distant metastasis-free survival. Our results show that beclin-1 expression was higher in head and neck cancer tissues compared with paracancerous tissues. Possible reasons for the differences in these results include: 1) different cancer locations, different TNM, and different cancer cell behavior; 2) a limited number of samples; and 3) differences in the methods used (optical density testing is more suitable for detecting biomarkers in the cell membrane or cytoplasm, whereas rate testing is more suitable for detecting biomarkers in the cell nucleus). Thus, the real role of autophagy in cancer remains unclear.
We also found that the expression of GLUT-1, HIF-1α, and Ki-67 in 45 head and neck cancers was higher than in paracancerous tissues. Beclin-1 expression was associated with HIF-1α (P=0.001) and Ki-67 (P=0.015) expression, but was not correlated with GLUT-1 expression. As mentioned above, the relationship between beclin-1 and HIF-1α is unknown. The HIF-1α fold expression is significantly and negatively correlated with beclin-1 expression in acute leukemia [24], breast cancer [39], and hepatocellular carcinoma [26]. The results of our study are similar to those of a study on nasopharyngeal carcinoma, which also showed that high-level beclin-1 expression was positively correlated with elevated HIF-1α expression [20]. One possible explanation for this relationship is that HIF-1α induces mitochondrial autophagy and constitutive beclin-1 expression, which may be an adaptive response to prevent increased levels of reactive oxygen species and cell death. In addition, the prognostic value of beclin-1 may depend on the intrinsic properties of the tumor type [20].
Ki-67 is a nuclear protein expressed in proliferating cells that has been used as a marker of mitosis (the Ki-67 labeling index [LI]). In addition, the LI has been shown to be higher in aggressive tumors and is a marker of poor prognosis [43,45]. However, in the present study, Ki-67 expression was not associated with clinicopathologic factors, but Ki-67 was associated with beclin-1 expression. These results are similar to results reported by Li et al. [46] and Yeşil et al. [47] In breast cancer, Ueno et al. [48] also showed that positive beclin-1 expression was associated with a higher Ki-67 LI. The result indicated that high beclin-1 expression may lead to proliferation [48]. However, some studies have failed to find a relationship between a loss of beclin-1 expression and the Ki-67 LI [25].
In non-small cell lung cancer, beclin-1 expression was strongly expressed in carcinomas with a lack of necrosis, and strong GLUT-1 expression was found in advanced carcinomas. The expression of beclin-1 was also found to be positively correlated with the expression of GLUT-1. These authors also suggested that non-small cell lung cancers with high expression of GLUT-1 and beclin-1 respond better to local environmental energy needs under hypoxic conditions [49]. In breast cancer, high expression of GLUT-1 is associated with a higher histological grade (P<0.001) [36]. High expression of GLUT-1, as well as CAIX and MCT-4, may reflect higher metabolic activity [50]. The expression of beclin-1 in breast cancer differs between cancer subtypes, and the relationship between beclin-1 and GLUT-1 expression is dependent on the type of breast cancer [50]. However, our study shows that beclin-1 expression in head and neck cancers was not associated with GLUT-1 expression. Thus, additional large-scale studies are needed to explain the significance of GLUT-1, HIF-1α, and beclin-1 expression in head and neck cancers.
Conclusion
HIF-1α, GLUT-1, Ki 67, and beclin-1 had high expression in head and neck cancers. The role of beclin-1 in carcinogenesis in head and neck cancers should be further studied.
Acknowledgements
This work was supported by Science and Technology Department of Zhejiang Province, China (No. 2015KYB141 and No. 2016C33144).
Disclosure of conflict of interest
None.
References
- 1.Lo Nigro C, Denaro N, Merlotti A, Merlano M. Head and neck cancer: improving outcomes with a multidisciplinary approach. Cancer Manag Res. 2017;9:363–371. doi: 10.2147/CMAR.S115761. [DOI] [PMC free article] [PubMed] [Google Scholar]
- 2.Shen Z, Zhou C, Li J, Deng H, Li Q, Wang J. The association, clinicopathological significance, and diagnostic value of CDH1 promoter methylation in head and neck squamous cell carcinoma: a meta-analysis of 23 studies. Onco Targets Ther. 2016;9:6763–6773. doi: 10.2147/OTT.S117453. [DOI] [PMC free article] [PubMed] [Google Scholar]
- 3.Eun YG, Lee D, Lee YC, Sohn BH, Kim EH, Yim SY, Kwon KH, Lee JS. Clinical significance of YAP1 activation in head and neck squamous cell carcinoma. Oncotarget. 2017;8:111130–111143. doi: 10.18632/oncotarget.22666. [DOI] [PMC free article] [PubMed] [Google Scholar]
- 4.Ou D, Garberis I, Adam J, Blanchard P, Nguyen F, Levy A, Casiraghi O, Gorphe P, Breuskin I, Janot F, Temam S, Scoazec JY, Deutsch E, Tao Y. Prognostic value of tissue necrosis, hypoxia-related markers and correlation with HPV status in head and neck cancer patients treated with bio- or chemo-radiotherapy. Radiother Oncol. 2018;126:116–124. doi: 10.1016/j.radonc.2017.10.007. [DOI] [PubMed] [Google Scholar]
- 5.Wu XH, Chen SP, Mao JY, Ji XX, Yao HT, Zhou SH. Expression and significance of hypoxia-inducible factor-1α and glucose transporter-1 in laryngeal carcinoma. Oncol Lett. 2013;5:261–266. doi: 10.3892/ol.2012.941. [DOI] [PMC free article] [PubMed] [Google Scholar]
- 6.Fang J, Luo XM, Yao HT, Zhou SH, Ruan LX, Yan SX. Expression of glucose transporter-1, hypoxia-inducible factor-1α, phosphatidylinositol 3-kinase and protein kinase B (Akt) in relation to [(18) F] fluorodeoxyglucose uptake in nasopharyngeal diffuse large B-cell lymphoma: a case report and literature review. J Int Med Res. 2010;38:2160–2168. doi: 10.1177/147323001003800632. [DOI] [PubMed] [Google Scholar]
- 7.Wu XH, Lu YF, Hu XD, Mao JY, Ji XX, Yao HT, Zhou SH. Expression of hypoxia inducible factor-1α and its significance in laryngeal carcinoma. J Int Med Res. 2010;38:2040–2046. doi: 10.1177/147323001003800618. [DOI] [PubMed] [Google Scholar]
- 8.Koukourakis MI, Giatromanolaki A, Sivridis E, Simopoulos C, Turley H, Talks K, Gatter KC, Harris AL. Hypoxia-inducible factor (HIF1A and HIF2A), angiogenesis, and chemoradiotherapy outcome of squamous cell head-and-neck cancer. Int J Radiat Oncol Biol Phys. 2002;53:1192–1202. doi: 10.1016/s0360-3016(02)02848-1. [DOI] [PubMed] [Google Scholar]
- 9.Masoud GN, Li W. HIF-1α pathway: role, regulation and intervention for cancer therapy. Acta Pharm Sin B. 2015;5:378–389. doi: 10.1016/j.apsb.2015.05.007. [DOI] [PMC free article] [PubMed] [Google Scholar]
- 10.Luo XM, Zhou SH, Fan J. Glucose transporter-1 as a new therapeutic target in laryngeal carcinoma. J Int Med Res. 2010;38:1885–1892. doi: 10.1177/147323001003800601. [DOI] [PubMed] [Google Scholar]
- 11.Yu M, Yongzhi H, Chen S, Luo X, Lin Y, Zhou Y, Jin H, Hou B, Deng Y, Tu L, Jian Z. The prognostic value of GLUT1 in cancers: a systematic review and meta-analysis. Oncotarget. 2017;8:43356–43367. doi: 10.18632/oncotarget.17445. [DOI] [PMC free article] [PubMed] [Google Scholar]
- 12.Luo XM, Xu B, Zhou ML, Bao YY, Zhou SH, Fan J, Lu ZJ. Co-inhibition of GLUT-1 expression and the PI3K/Akt signaling pathway to enhance the radiosensitivity of laryngeal carcinoma xenografts in vivo. PLoS One. 2015;10:e0143306. doi: 10.1371/journal.pone.0143306. [DOI] [PMC free article] [PubMed] [Google Scholar]
- 13.Bao YY, Zhou SH, Lu ZJ, Fan J, Huang YP. Inhibiting GLUT-1 expression and PI3K/Akt signaling using apigenin improves the radiosensitivity of laryngeal carcinoma in vivo. Oncol Rep. 2015;34:1805–1814. doi: 10.3892/or.2015.4158. [DOI] [PubMed] [Google Scholar]
- 14.Chai L, Ying HF, Wu TT, Zhou SH, Bao YY, Yao HT, You QH. Clinical features and hypoxic marker expression of primary sinonasal and laryngeal small-cell neuroendocrine carcinoma: a small case series. World J Surg Oncol. 2014;12:199. doi: 10.1186/1477-7819-12-199. [DOI] [PMC free article] [PubMed] [Google Scholar]
- 15.Bredell MG, Ernst J, El-Kochairi I, Dahlem Y, Ikenberg K, Schumann DM. Current relevance of hypoxia in head and neck cancer. Oncotarget. 2016;7:50781–50804. doi: 10.18632/oncotarget.9549. [DOI] [PMC free article] [PubMed] [Google Scholar]
- 16.Fan Q, Yang L, Zhang X, Ma Y, Li Y, Dong L, Zong Z, Hua X, Su D, Li H, Liu J. Autophagy promotes metastasis and glycolysis by upregulating MCT1 expression and Wnt/β-catenin signaling pathway activation in hepatocellular carcinoma cells. J Exp Clin Cancer Res. 2018;37:9. doi: 10.1186/s13046-018-0673-y. [DOI] [PMC free article] [PubMed] [Google Scholar]
- 17.Huang L, Wang S, Li SS, Yang XM. Prognostic significance of Beclin-1 expression in laryngeal squamous cell carcinoma. Pathol Oncol Res. 2013;19:771–777. doi: 10.1007/s12253-013-9642-0. [DOI] [PubMed] [Google Scholar]
- 18.Wang J, Pan XL, Ding LJ, Liu DY, Da-Peng Lei, Jin T. Aberrant expression of Beclin-1 and LC3 correlates with poor prognosis of human hypopharyngeal squamous cell carcinoma. PLoS One. 2013;8:e69038. doi: 10.1371/journal.pone.0069038. [DOI] [PMC free article] [PubMed] [Google Scholar]
- 19.Sannigrahi MK, Singh V, Sharma R, Panda NK, Khullar M. Role of autophagy in head and neck cancer and therapeutic resistance. Oral Dis. 2015;21:283–291. doi: 10.1111/odi.12254. [DOI] [PubMed] [Google Scholar]
- 20.Wan XB, Fan XJ, Chen MY, Xiang J, Huang PY, Guo L, Wu XY, Xu J, Long ZJ, Zhao Y, Zhou WH, Mai HQ, Liu Q, Hong MH. Elevated Beclin 1 expression is correlated with HIF-1alpha in predicting poor prognosis of nasopharyngeal carcinoma. Autophagy. 2010;6:395–404. doi: 10.4161/auto.6.3.11303. [DOI] [PubMed] [Google Scholar]
- 21.Aita VM, Liang XH, Murty VV, Pincus DL, Yu W, Cayanis E, Kalachikov S, Gilliam TC, Levine B. Cloning and genomic organization of beclin 1, a candidate tumor suppressor gene on chromosome 17q21. Genomics. 1999;59:59–65. doi: 10.1006/geno.1999.5851. [DOI] [PubMed] [Google Scholar]
- 22.Yu S, Li G, Wang Z, Wang Z, Chen C, Cai S, He Y. Low expression of MAP1LC3B, associated with low Beclin-1, predicts lymph node metastasis and poor prognosis of gastric cancer. Tumour Biol. 2016;37:15007–15017. doi: 10.1007/s13277-016-5383-5. [DOI] [PubMed] [Google Scholar]
- 23.Hu Z, Zhong Z, Huang S, Wen H, Chen X, Chu H, Li Q, Sun C. Decreased expression of Beclin-1 is significantly associated with a poor prognosis in oral tongue squamous cell carcinoma. Mol Med Rep. 2016;14:1567–1573. doi: 10.3892/mmr.2016.5437. [DOI] [PMC free article] [PubMed] [Google Scholar]
- 24.Radwan SM, Hamdy NM, Hegab HM, El-Mesallamy HO. Beclin-1 and hypoxia-inducible factor-1α genes expression: potential biomarkers in acute leukemia patients. Cancer Biomark. 2016;16:619–626. doi: 10.3233/CBM-160603. [DOI] [PubMed] [Google Scholar]
- 25.Katagiri H, Nakayama K, Razia S, Nakamura K, Sato E, Ishibashi T, Ishikawa M, Iida K, Ishikawa N, Otsuki Y, Nakayama S, Kyo S. Loss of autophagy-related protein Beclin 1 may define poor prognosis in ovarian clear cell carcinomas. Int J Oncol. 2015;47:2037–2044. doi: 10.3892/ijo.2015.3191. [DOI] [PMC free article] [PubMed] [Google Scholar]
- 26.Osman NA, Abd El-Rehim DM, Kamal IM. Defective Beclin-1 and elevated hypoxia-inducible factor (HIF)-1α expression are closely linked to tumorigenesis, differentiation, and progression of hepatocellular carcinoma. Tumour Biol. 2015;36:4293–4299. doi: 10.1007/s13277-015-3068-0. [DOI] [PubMed] [Google Scholar]
- 27.Zhang X, Shi H, Lin S, Ba M, Cui S. MicroRNA-216a enhances the radiosensitivity of pancreatic cancer cells by inhibiting beclin-1-mediated autophagy. Oncol Rep. 2015;34:1557–1564. doi: 10.3892/or.2015.4078. [DOI] [PubMed] [Google Scholar]
- 28.Zou YM, Hu GY, Zhao XQ, Lu T, Zhu F, Yu SY, Xiong H. Hypoxia-induced autophagy contributes to radioresistance via c-Jun-mediated Beclin1 expression in lung cancer cells. J Huazhong Univ Sci Technolog Med Sci. 2014;34:761–767. doi: 10.1007/s11596-014-1349-2. [DOI] [PubMed] [Google Scholar]
- 29.Belounis A, Nyalendo C, Le Gall R, Imbriglio TV, Mahma M, Teira P, Beaunoyer M, Cournoyer S, Haddad E, Vassal G, Sartelet H. Autophagy is associated with chemoresistance in neuroblastoma. BMC Cancer. 2016;16:891. doi: 10.1186/s12885-016-2906-9. [DOI] [PMC free article] [PubMed] [Google Scholar]
- 30.Kang R, Wang ZH, Wang BQ, Zhang CM, Gao W, Feng Y, Bai T, Zhang HL, Huang-Pu H, Wen SX. Inhibition of autophagy-potentiated chemosensitivity to cisplatin in laryngeal cancer Hep-2 cells. Am J Otolaryngol. 2012;33:678–684. doi: 10.1016/j.amjoto.2012.05.005. [DOI] [PubMed] [Google Scholar]
- 31.Qiu G, Li X, Wei C, Che X, He S, Lu J, Wang S, Pang K, Fan L. The prognostic role of SIRT1-autophagy axis in gastric cancer. Dis Markers. 2016;2016:6869415. doi: 10.1155/2016/6869415. [DOI] [PMC free article] [PubMed] [Google Scholar]
- 32.Wang X, Du Z, Li L, Shi M, Yu Y. Beclin 1 and p62 expression in non-small cell lung cancer: relation with malignant behaviors and clinical outcome. Int J Clin Exp Pathol. 2015;8:10644–10652. [PMC free article] [PubMed] [Google Scholar]
- 33.Yang Z, Ghoorun RA, Fan X, Wu P, Bai Y, Li J, Chen H, Wang L, Wang J. High expression of Beclin-1 predicts favorable prognosis for patients with colorectal cancer. Clin Res Hepatol Gastroenterol. 2015;39:98–106. doi: 10.1016/j.clinre.2014.06.014. [DOI] [PubMed] [Google Scholar]
- 34.Cai M, Hu Z, Liu J, Gao J, Liu C, Liu D, Tan M, Zhang D, Lin B. Beclin 1 expression in ovarian tissues and its effects on ovarian cancer prognosis. Int J Mol Sci. 2014;15:5292–5303. doi: 10.3390/ijms15045292. [DOI] [PMC free article] [PubMed] [Google Scholar]
- 35.Radwan SM, Hamdy NM, Hegab HM, El-Mesallamy HO. Beclin-1 and hypoxia-inducible factor-1α genes expression: potential biomarkers in acute leukemia patients. Cancer Biomark. 2016;16:619–626. doi: 10.3233/CBM-160603. [DOI] [PubMed] [Google Scholar]
- 36.Qin W, Li C, Zheng W, Guo Q, Zhang Y, Kang M, Zhang B, Yang B, Li B, Yang H, Wu Y. Inhibition of autophagy promotes metastasis and glycolysis by inducing ROS in gastric cancer cells. Oncotarget. 2015;6:39839–39854. doi: 10.18632/oncotarget.5674. [DOI] [PMC free article] [PubMed] [Google Scholar]
- 37.Wu H, Huang S, Chen Z, Liu W, Zhou X, Zhang D. Hypoxia-induced autophagy contributes to the invasion of salivary adenoid cystic carcinoma through the HIF-1α/BNIP3 signaling pathway. Mol Med Rep. 2015;12:6467–6474. doi: 10.3892/mmr.2015.4255. [DOI] [PMC free article] [PubMed] [Google Scholar]
- 38.Zhu H, Wang D, Zhang L, Xie X, Wu Y, Liu Y, Shao G, Su Z. Upregulation of autophagy by hypoxia-inducible factor-1α promotes EMT and metastatic ability of CD133+ pancreatic cancer stem-like cells during intermittent hypoxia. Oncol Rep. 2014;32:935–942. doi: 10.3892/or.2014.3298. [DOI] [PubMed] [Google Scholar]
- 39.Dong M, Wan XB, Yuan ZY, Wei L, Fan XJ, Wang TT, Lv YC, Li X, Chen ZH, Chen J, Lin Q, Wen JY, Ma XK, Liu Q, Wu XY. Low expression of Beclin 1 and elevated expression of HIF-1α refine distant metastasis risk and predict poor prognosis of ER-positive, HER2-negative breast cancer. Med Oncol. 2013;30:355. doi: 10.1007/s12032-012-0355-0. [DOI] [PubMed] [Google Scholar]
- 40.Lee SJ, Kim HP, Jin Y, Choi AM, Ryter SW. Beclin 1 deficiency is associated with increased hypoxia-induced angiogenesis. Autophagy. 2011;7:829–839. doi: 10.4161/auto.7.8.15598. [DOI] [PMC free article] [PubMed] [Google Scholar]
- 41.Chen Y, Lu Y, Lu C, Zhang L. Beclin-1 expression is a predictor of clinical outcome in patients with esophageal squamous cell carcinoma and correlated to hypoxia-inducible factor (HIF)-1alpha expression. Pathol Oncol Res. 2009;15:487–493. doi: 10.1007/s12253-008-9143-8. [DOI] [PMC free article] [PubMed] [Google Scholar]
- 42.Sakakura K, Takahashi H, Kaira K, Toyoda M, Oyama T, Chikamatsu K. Immunological significance of the accumulation of autophagy components in oral squamous cell carcinoma. Cancer Sci. 2015;106:1–8. doi: 10.1111/cas.12559. [DOI] [PMC free article] [PubMed] [Google Scholar]
- 43.Luo G, Hu Y, Zhang Z, Wang P, Luo Z, Lin J, Cheng C, Yang Y. Clinicopathologic significance and prognostic value of Ki-67 expression in patients with gastric cancer: a meta-analysis. Oncotarget. 2017;8:50273–50283. doi: 10.18632/oncotarget.17305. [DOI] [PMC free article] [PubMed] [Google Scholar]
- 44.Li X, Xu H, Ma H. Beclin 1 is highly expressed in papillary thyroid carcinoma and correlates with lymph node metastasis. Acta Chir Belg. 2013;113:175–181. doi: 10.1080/00015458.2013.11680907. [DOI] [PubMed] [Google Scholar]
- 45.Zhao Y, Shen L, Huang X, Jing D, Huang D, Fu J, Li Z, Zhang G, Shen L. High expression of Ki-67 acts a poor prognosis indicator in locally advanced nasopharyngeal carcinoma. Biochem Biophys Res Commun. 2017;494:390–396. doi: 10.1016/j.bbrc.2017.09.118. [DOI] [PubMed] [Google Scholar]
- 46.Li RF, Chen G, Zhao Y, Zhao YF, Liu B. Increased expression of autophagy-related proteins in keratocystic odontogenic tumours: its possible association with growth potential. Br J Oral Maxillofac Surg. 2014;52:551–556. doi: 10.1016/j.bjoms.2014.03.009. [DOI] [PubMed] [Google Scholar]
- 47.Yeşil C, Kandemir O, Haksever H, Dabakoğlu T. Is BECLIN-1 immunoreactivity more effective than HBME-1 in diagnosis of papillary thyroid cancer? Acta Chir Belg. 2015;115:299–305. doi: 10.1080/00015458.2015.11681116. [DOI] [PubMed] [Google Scholar]
- 48.Ueno T, Saji S, Sugimoto M, Masuda N, Kuroi K, Sato N, Takei H, Yamamoto Y, Ohno S, Yamashita H, Hisamatsu K, Aogi K, Iwata H, Imoto S, Sasano H, Toi M. Clinical significance of the expression of autophagy-associated marker, beclin 1, in breast cancer patients who received neoadjuvant endocrine therapy. BMC Cancer. 2016;16:230. doi: 10.1186/s12885-016-2270-9. [DOI] [PMC free article] [PubMed] [Google Scholar]
- 49.Karpathiou G, Sivridis E, Koukourakis M, Mikroulis D, Bouros D, Froudarakis M, Bougioukas G, Maltezos E, Giatromanolaki A. Autophagy and Bcl-2/BNIP3 death regulatory pathway in non-small cell lung carcinomas. APMIS. 2013;121:592–604. doi: 10.1111/apm.12026. [DOI] [PubMed] [Google Scholar]
- 50.Choi J, Kim DH, Jung WH, Koo JS. Metabolic interaction between cancer cells and stromal cells according to breast cancer molecular subtype. Breast Cancer Res. 2013;15:R78. doi: 10.1186/bcr3472. [DOI] [PMC free article] [PubMed] [Google Scholar]