Abstract
Pancreatic cancer (PC) is an aggressive malignancy with one of the worst mortality rates in the world. Multiple factors, including a complex and poorly understood pathophysiology and difficulty in early detection and diagnosis make successful treatment of pancreatic cancer extremely challenging. In this study, we first detected the expressions of eight selected miRNAs which are predicted repress GLUT1 expression by targeting 3’UTR. We found miR-148a had a significantly down regulated expression and miR-148a level has an inverse correlation with the expression of GLUT1 in PC tissues. Subsequently, examined by dual-luciferase assay and western blot, we confirmed that miR-148a suppressed GLUT1 expression by directly targeting 3’UTR of GLUT1 mRNA. Finally, biological study in two pancreatic cancer cell lines indicates that miR-148a function as a tumor suppressor gene through repressing pancreatic cancer cell proliferation, migration and invasion. We first identified miR-148a, which has down regulated expression in pancreatic cancer tissues, plays as a cancer inhibitor through targeting GLUT1. This study sheds light on the roles of miRNAs in the pathogenesis of pancreatic cancer and may be helpful for clinical diagnosis and treatment.
Keywords: Pancreatic cancer, miRNA, GLUT1
Introduction
Pancreatic cancer (PC) is an aggressive malignancy with one of the worst mortality rates in the world. It is the sixth leading cause of death from malignant disease in China and the fourth leading cause of cancer-related death in the United States [1]. Multiple factors, including a complex and poorly understood pathophysiology and difficulty in early detection and diagnosis make successful treatment of pancreatic cancer extremely challenging. Rapid tumor progression, late diagnosis, early and aggressive metastasis, and high resistance to conventional chemotherapy lead to exceptionally poor prognosis with an overall 5 years survival rate of less than 5% [4]. Although numerous environmental factors were confirmed to contribute to the occurrence of pancreatic cancer, the accumulation of genetic and epigenetic changes remains the fundamental mechanism.
MicroRNA (miRNA) is a kind of short non-coding RNAs that suppress post-transcriptional genes expression by complementary targeting, especially to the 3’ untranslated regions (UTRs) of messenger RNAs (mRNAs). MiRNA expression alterations are involved in the initiation, progression, and metastasis of human cancer and it is believed that miRNAs function both as tumor suppressors and promoters in cancer development [1]. Accumulating studies have shown that disturbed expression of microRNAs is involved in the process of pathogenesis and drug resistance of pancreatic carcinoma [1].
GLUT-1, a member of glucose transporter family, is a basic high-affinity glucose transporter normally expressed in erythrocytes, endothelial cells, the perineurium of peripheral nerves, germinal centers of reactive lymph nodes, renal tubules, and placenta [1]. It is also considered to be the predominantly upregulated glucose transporter in malignant epithelial tissues as well as in malignant mesothelium [1]. Meanwhile, increased GLUT-1 expressions have also proved to be related to pancreatic cancer invasiveness and poor outcome [1].
In this study, we first identified that miR-148a/b suppress GLUT-1 expression by directly targeting 3’UTR. Down-regulation of miR-148a/b is related to enhance pancreatic cancer cell proliferation, migration and invasion ability. Our results indicate that miR-148a and miR-148b play as pancreatic cancer inhibitors the expression of which is positive correlate with pancreatic cancer malignancy.
Materials and methods
Tissue samples
Pancreatic cancer and matched adjacent non-tumor tissues from 33 patients were obtained post-operatively from 2011 to 2012, from the Department of General Surgery, Renji Hospital. Three individual RNA samples were mixed into one group, and eight miRNAs expression were firstly detected in these 11 groups for a discovery study. The patients provided signed, informed consent for their tissues to be used for scientific research. Ethical approval for the study was obtained from the department of General Surgery, Renji Hospital. Diagnoses were based on pathological and/or cytological evidence. Histological features of the specimens were evaluated by two senior pathologists according to classification criteria from the WHO (World Health Organization) (1990). Tissues were obtained from patients prior to chemotherapy or radiation therapy. Specimens were immediately frozen and stored at -80°C prior to western blot and real-time PCR analyses.
Cell culture
PANC-1, MIAPaca-2 and HEK293T cells were cultured in Dulbecco’s Modified Eagle Medium containing 10% fetal bovine serum (Hyclone, Logan, UT, USA), 100 IU/ml penicillin and 10 mg/mL streptomycin. All cells were maintained at 37°C under an atmosphere of 5% CO2.
Western blotting
Protein extracts were boiled in SDS/β-mercaptoethanol sample buffer, and 25 μg samples were loaded into each lane of 10% polyacrylamide gels. The proteins were separated by electrophoresis, and the proteins in the gels were blotted onto PVDF membranes (Amersham Pharmacia Biotech, St. Albans, Herts, UK) by electrophoretic transfer. The membrane was incubated with rabbit anti-GLUT1 polyclonal antibody (Abcam, Cambridge, MA, USA), mouse anti-β-actin monoclonal antibody (Santa Cruz Biotechnology Inc., Santa Cruz, CA, USA) for 1 h at 37°C. The specific protein antibody complex was detected by using horseradish peroxidase conjugated horse anti-rabbit or rabbit anti-mouse IgG. Detection by the chemiluminescence reaction was carried using the ECL kit (Pierce, Appleton, WI, USA). The β-actin signal was used as a loading control. The band intensity was analyzed by using ImageJ software.
Quantitive RT-PCR
Quantitive RT-PCR analysis was used to determine the relative expression level of 8 selected miRNAs. Total RNA was extracted from tissues, using Trizol Reagent (Invitrogen, Carlsbad, CA, USA) according to the manufacturer’s instructions. The expression levels of candidate miRNAs were detected by TaqMan miRNA RT-Real Time PCR. Single-stranded cDNA was synthesized by using TaqMan MicroRNA Reverse Transcription Kit (Applied Biosystems, Foster City, CA, USA) and then amplified by using TaqMan Universal PCR Master Mix (Applied Biosystems, Foster City, CA, USA) together with miRNA-specific TaqMan MGB probes (Applied Biosystems, Foster City, CA, USA). The U6 snRNA was used for normalization. Each sample in each group was measured in triplicate and the experiment was repeated at least three times.
Dual-luciferase reporter assays
To generate 3’-UTR luciferase reporter, a segment of 112 bp of GLUT1 3’-UTR, which contains putative miR-148a target region, was cloned into the downstream of the renilla luciferase gene in pRL-TK Vector (Promega, Madison, WI USA). MiRNA mimics and inhibitor were synthesized by GenePharma Co., Ltd (Shanghai, China). The pGL3 control vector containing firefly luciferase was co-transfected for data normalization. For luciferase reporter assays, HEK293T cells were seeded in 48-well plates. Luciferase reporter vectors were co-transfected with one of the miRNA mimics by using lipofectamine 2000 (Invitrogen, Carlsbad, CA USA). Two days after tranfection, cells were harvested and assayed with the Dual-Luciferase Assay system (Promega, Madison, WI USA). Each treatment was performed in triplicate in three independent experiments. The results were expressed as relative luciferase activity (Renilla LUC/Firefly LUC). To identify the binding site of miR-148a, plasmid with four nucleotides mutant in the predicted miR-148a binding site was used.
Cell proliferation assay
PANC-1 and MIAPaca-2 cells were seeded in 96-well plates at low density (5×10³) in DMEM culture, and allowed to attach overnight. The cells were then transfected with miR-148a mimic or inhibitor, with sequence scrambled single strand or double strand short RNA as control. Twenty microliters MTT (5 mg/ml) (Sigma, St. Louis, MO, USA) were added into each well 48 h after transfection, and the cells were incubated for further 4 h. The absorbance was recorded at A570 nm with a 96-well plate reader after the DMSO addition.
Cell migration and invasion assays
PANC-1 and MIAPaca-2 cells were transfected with miR-148a mimcs or inhibitor plus scramble miRNA control. The transfected cells were harvested and subjected to the following assays, 48 h after transfection. For migration assays, the transfected cells (0.5×10⁶ cells/ml) were seeded in the top of an 8.0-mm-pore membrane chamber (Corning Costar Corp., Cambridge, MA, USA). Following a 12 h incubation period, cells that passed through the membrane to attach to the bottom of membrane were fixed and stained with hematoxylin and eosin (Sigma-Aldrich, St. Louis, MO, USA). Cells were scraped and removed from the top of chamber. Membranes were mounted on cover slides, and cells were counted. The cell migration was quantified by counting the amount of cells passing through the pores from five different fields per sample at 100× selected in a random manner. Cell invasion assays were carried out using modified Boyden chambers in 24-well tissue culture plates at 1×10⁵ cells per well (BD Biosciences, USA). All experiments were performed in duplicate.
Statistical analysis
Data were analyzed by using SPSS Statistical Package version 17. Results were analyses by using student t-test. P<0.05 was considered statistically significant.
Results
Expression of GLUT1 and miR-148a/b in the PC patients
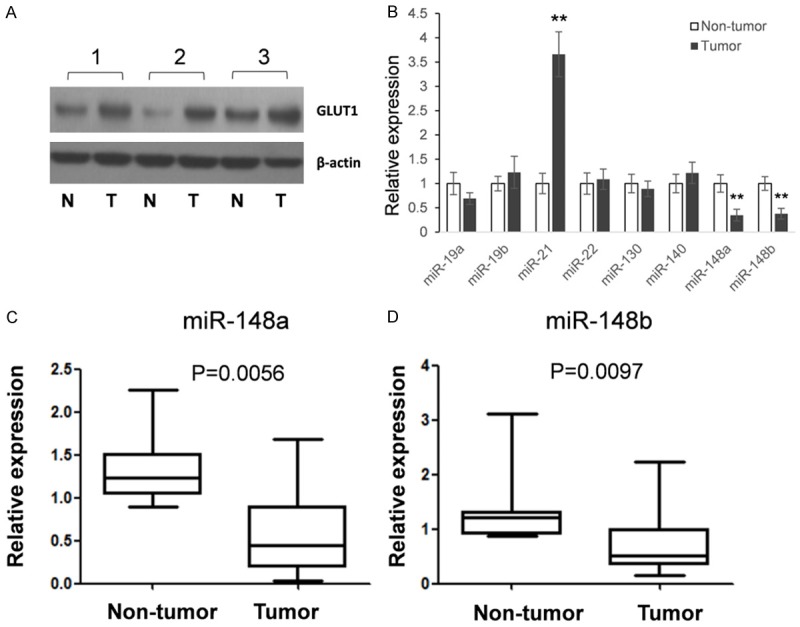
We first detect GLUT1 expression in all the 33 clinical samples by western Western blot, as shown in Figure 1A and Table 1, GLUT1 overexpression existed in 57.6% patients (19/33). Meanwhile, we detected eight selected miRNAs expression in clinical samples. Three individual RNA samples were mixed into one group and the expression of eight miRNAs, which were predicted directly targeting GLUT1, were firstly detected for a discovery study. As shown in Figure 1B, miR-148a/b have significantly down-regulated expressions in tumor tissues compared with non-tumor controls, hints an inverse relation may existed in the expression of miR-148 family members and GLUT1. We further examine the miR-148a/b expressions in every individuals and the results showed a very significant down regulated expression in tumor samples (Figure 1C, 1D) which is in accordance with Figure 1B.
Figure 1.

the expression of GLUT1 and eight selected miRNAs in PC patients. A: An example of GLUT1 expression in PC tissues and adjacent non-tumor tissues. B: The expression of eight miRNAs was detected by qRT-PCR. Tissue from thirty-three patients were randomly divided into eleven groups with three RNA samples were mixed. Stem-loop qRT-PCR was used to detect eight selected miRNAs expression. C, D: The expressions of miR-148a and miR-148b were detected by qRT-PCR in each tissue samples. The results were analyzed by student t-test and P<0.05 were considered statistically significant. *P<0.05, **P<0.01.
Table 1.
clinical characteristics of patients
| Characteristics | No. of cases | Median survival time (months) | 5-year survival rate (%) |
|---|---|---|---|
| GLUT1 expression | |||
| High | 19 | 13 | 10.2 |
| Low | 14 | 26 | 27.4 |
| miR-148a level | |||
| High | 8 | 28 | 34.5 |
| Low | 25 | 12 | 13.4 |
| Age | |||
| ≥65 years | 20 | 21 | 23.5 |
| ≤64 years | 13 | 20.3 | 28.1 |
| Vessel invasion | |||
| Positive | 22 | 12.7 | 12.8 |
| Negative | 11 | 31.6 | 34.7 |
| Neural invasion | |||
| Positive | 23 | 21.2 | 18.9 |
| Negative | 10 | 19.4 | 22.4 |
To further unveil the relation between down regulated miR-148a/b and the overexpressed GLUT1 in pancreatic cancer tissues, we did the correlation analysis. To evaluate GLUT1 expression, the relative band intensity was determined by using ImageJ software with β-actin as loading control.
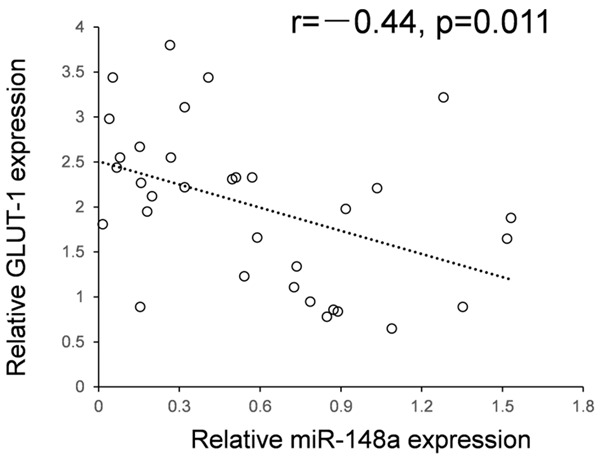
Analyzed with the expression of miR-148a and b, we found an inverse correlation between the expression level of miR-148a and GLUT1 in 33 clinical samples of pancreatic cancer. Low levels of miR-148a were associated with high GLUT1 expression (Pearson correlation, r-0.44; P=0.011; Figure 2).
Figure 2.

The negative correlation between the expression of miR-148a and GLUT1. The relationship between miR-148a and GLUT1 in 33 clinical samples of pancreatic cancer indicated an inverse correlation (Pearson correlation, r=-0.44; P=0.011).
MiR-148a suppresses GLUT1 expression by directly targeting 3’UTR
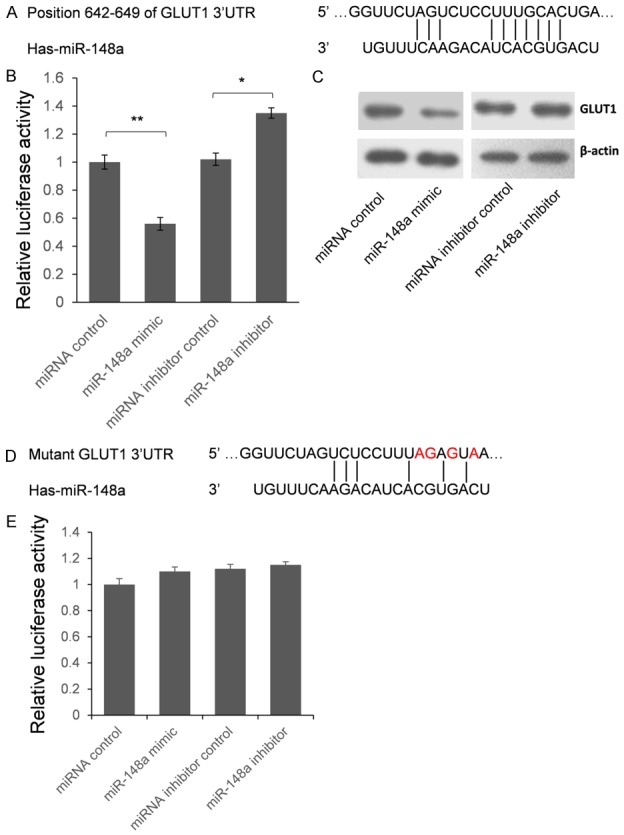
To further confirm whether GLUT1 is the target gene of miR-148a, we employed the dual luciferase assay system. As shown in Figure 3A, a segment of 112 bp of GLUT1 3’-UTR, which contains putative miR-148a target region, was cloned into the downstream of the renilla luciferase gene in pRL-TK Vector. HEK293T cells were co-transfected with pRL-TK-GLUT1 and miR-148a mimic or inhibitor. As shown in Figure 3B, compared with the miRNA control, the luciferase activity was significantly suppressed by the miR-148a, about 44.2% (P<0.01). Furthermore, the luciferase activity was significantly up-regulated by the miR-148a inhibitor compared with the miR-148a inhibitor control, about 33.7% (P<0.05). These results indicate that miR-148a targets the 3’-UTR of GLUT1, leading to the change of luciferase expression.
Figure 3.

miR-148a represses GLUT1 expression by targeting 3’UTR. A: Schematic diagram for the predicted interaction between miR-148a and GLUT1 mRNA. B: HEK293T cells were co-transfected with miRNA control, miR-148a mimic, anti-miR control or miR-148a inhibitor for dual-luciferase assay. C: GLUT1 protein levels of PANC-1 cells which transfected with miR-148a mimic or miR-148a inhibitor were detected by western blot. D: Four nucleotides mutant segment was cloned into pRL-TK to confirm the binding site of miR-148a. Red characters represent the mutant nucleotides. E: Dual luciferase assay was employed to confirm the binding site of miR-148a. The results were analyzed by student t-test and P<0.05 was considered as statistically significant. *P<0.05, **P<0.01.
Seed sequence mutation clone was also used to further confirm the binding site for miR-148a (Figure 3D). The vector contains putative miR-148a binding region in the 3’-UTR of GLUT1 with 4 mutant nucleotides was constructed. The histogram in Figure 3E showed that the enzyme activity was not significantly reduced in cells transfected with miR-control compared with miR-148a mimic (P>0.05). These data indicate that miR-148a may suppress GLUT1 expression through binding to seed sequence at the 3’-UTR of GLUT1.
To further examine whether endogenous GLUT1 expression is suppressed by miR-148a, PANC-1 cells were transfected with miR-148a mimic or inhibitor. GLUT1 protein level was detected by western blot 48 hours after transfection. Compared with corresponding control, the level of GLUT1 protein was significantly suppressed by miR-148a mimic and up-regulated by miR-148a inhibitor in PANC-1 cells (Figure 3C). These results indicated that miR-148a repressed endogenous GLUT1 expression in esophageal cancer cells by directly targeting 3’UTR, and GLUT1 is a direct target gene of miR-148a.
Effects of miR-148a disturbance on cell proliferation, migration and invasion in PC cell lines
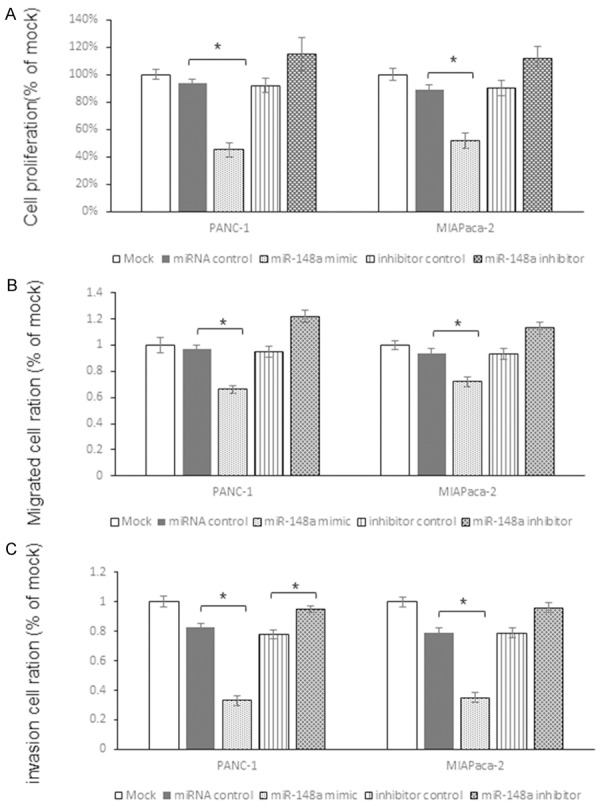
To investigate the functional role of miR-148a, we performed gain and loss of function studies using cells transfected with miR-148a mimic or inhibitor. The MTT assay demonstrated that cell proliferation was significantly inhibited in miR-148a mimic transfected cells in comparison with mock- or miRNA-control-transfected cells. Meanwhile, the cell proliferation was up regulated by miR-148a inhibitor (Figure 4A). Specifically, we observed the following growth rates, expressed as a percentage of the control: (1) PANC-1: mock, 100.0±3.4%; miRNA control, 94.4±2.3%; miR-148a, 45.2%±4.2%; miRNA inhibitor control, 92.4%±5.1%, miR-148a inhibitor, 115.1%±12.2%, and (2) MIA-Paca-2: mock, 100.0±4.4%; miRNA control, 89.4±4.5%; miR-148a, 52.2%±5.5%; miRNA inhibitor control, 90.5%±5.6%, miR-148a inhibitor, 112.4%±8.7% (Figure 4A).
Figure 4.

miR-148a suppresses pancreatic cancer cells proliferation, migration and invasion by targeting GLUT1. A: MTT assay was used to detect the function of miR-148a on proliferation of two pancreatic cancer cell lines. The growth rates expressed as a percentage of the control. B: The classic transwell assay to examine the function of miR-148a on migration of pancreatic cancer cells. C: The Matrigel invasion assay was employed to investigate the function of miR-148a on pancreatic cancer cells. The results were analyzed by student t-test and P<0.05 was considered as statistically significant. *P<0.05, **P<0.01.
The classic transwell assay demonstrated that significant inhibition of cell migration occurred in miR-148a transfected cells in comparison with mock and miR-control (Figure 4B). Specifically, we observed the following migrated cells rates, expressed as a percentage of the control: (1) PANC-1: mock, 100.0±5.6%; miRNA control, 94.2±3.1%; miR-148a, 66.2%±3.2%; miRNA inhibitor control, 93.1%±4.9%, miR-148a inhibitor, 113.2%±4.3%, and (2) MIAPaca-2: mock, 100.0±3.6%; miRNA control, 94.3±3.1%; miR-148a, 71.8%±3.1%; miRNA inhibitor control, 93.5%±5.6%, miR-148a inhibitor, 112.9%±4.3% (Figure 4B).
The Matrigel invasion assay demonstrated that the number of invading cells was significantly decreased in miR-148a transfected cells in comparison with mock and miR-control groups (Figure 4C). Specifically, we observed the following invasion rates, expressed as a percentage of the control: (1) PANC-1: mock, 100.0±3.6%; miRNA control, 83.1±3.2%; miR-148a, 33.3%±3.1%; miRNA inhibitor control, 78.4%±4.5%, miR-148a inhibitor, 94.8%±4.4%, and (2) MIAPaca-2: mock, 100.0±3.4%; miRNA control, 79.3±3.5%; miR-148a, 34.8%±3.5%; miRNA inhibitor control, 78.6%±3.9%, miR-148a inhibitor, 96.1%±4.3% (Figure 4C).
Discussion
GLUT1, also known as facilitated glucose transporter member 1 (SLC2A1), is a uniporter protein that in humans is encoded by the SLC2A1 gene. GLUT1 facilitates the transport of glucose across the plasma membranes of mammalian cells and its overexpression has been confirmed to be related to cancer malignancies. In this study, we first detected the expressions of eight selected miRNAs which are predicted repress GLUT1 expression by targeting 3’UTR. We found miR-148a had a significantly down regulated expression and miR-148a level has an inverse correlation with the expression of GLUT1 in PC tissues. Subsequently, examined by dual-luciferase assay and western blot, we confirmed that miR-148a suppressed GLUT1 expression by directly targeting 3’UTR of GLUT1 mRNA. Finally, biological study in two pancreatic cancer cell lines indicates that miR-148a function as a tumor suppressor gene through repressing pancreatic cancer cell proliferation, migration and invasion.
There are a group of research indicate that GLUT1 plays as an oncogene that is positive correlate with cancer malignancy. However, how the expression of GLUT1 regulated by posttranslational factors, especially miRNAs, was not well understood. Recently, there is a report indicates that miR-1291 inhibits renal cancer proliferation, migration and invasion through targeting GLUT1 [13]. Herein, our research shows that miR-148a plays a similar role in pancreatic cancer cells. However, since one miRNA may have tens or hundreds of target genes and its function may be tissue specific, more research have to be done to unveil the full biological function of miR-148a.
In this study, we found miR-21 has a significantly up-regulated expression in tumor tissues. We did not investigate the roles of miR-21 because the expressions of miR-21 and GLUT1 have the same tendency. The roles of miR-21 in cancers have also been fully studied relatively. One important function of miR-21 as oncogene is suppressing PTEN expression in many kinds of cancers as breast cancer, lung cancer, gastric cancer and so on.
Inclusion, we first identified miR-148a, which has down regulated expression in pancreatic cancer tissues, plays as a cancer inhibitor through targeting GLUT1. This discovery sheds light on the roles of miRNAs in the pathogenesis of pancreatic cancer and may be helpful for clinical diagnosis and treatment.
Disclosure of conflict of interest
None.
References
- 1.Li D, Xie K, Wolff R, Abbruzzese JL. Pancreatic cancer. Lancet. 2004;363:1049–1057. doi: 10.1016/S0140-6736(04)15841-8. [DOI] [PubMed] [Google Scholar]
- 2.Guo X, Cui Z. Current diagnosis and treatment of pancreatic cancer in China. Pancreas. 2005;31:13–22. doi: 10.1097/01.mpa.0000168220.97967.d1. [DOI] [PubMed] [Google Scholar]
- 3.Siegel R, Naishadham D, Jemal A. Cancer statistics, 2012. CA Cancer J Clin. 2012;62:10–29. doi: 10.3322/caac.20138. [DOI] [PubMed] [Google Scholar]
- 4.Wu WK, Lee CW, Cho CH, Fan D, Wu K, Yu J, Sung JJ. MicroRNA dysregulation in gastric cancer: a new player enters the game. Oncogene. 2010;29:5761–5771. doi: 10.1038/onc.2010.352. [DOI] [PubMed] [Google Scholar]
- 5.Nicoloso MS, Spizzo R, Shimizu M, Rossi S, Calin GA. MicroRNAs--the micro steering wheel of tumour metastases. Nat Rev Cancer. 2009;9:293–302. doi: 10.1038/nrc2619. [DOI] [PubMed] [Google Scholar]
- 6.Ikenaga N, Ohuchida K, Mizumoto K, Yu J, Kayashima T, Sakai H, Fujita H, Nakata K, Tanaka M. MicroRNA-203 expression as a new prognostic marker of pancreatic adenocarcinoma. Ann Surg Oncol. 2010;17:3120–3128. doi: 10.1245/s10434-010-1188-8. [DOI] [PubMed] [Google Scholar]
- 7.Izumchenko E, Chang X, Michailidi C, Kagohara L, Ravi R, Paz K, Brait M, Hoque MO, Ling S, Bedi A, Sidransky D. The TGFbeta-miR200-Mig6 pathway orchestrates the EMT-associated kinase switch that induces resistance to EGFR inhibitors. Cancer Res. 2014;74:3995–4005. doi: 10.1158/0008-5472.CAN-14-0110. [DOI] [PMC free article] [PubMed] [Google Scholar]
- 8.Cornford EM, Hyman S, Swartz BE. The human brain GLUT1 glucose transporter: ultrastructural localization to the blood-brain barrier endothelia. J Cereb Blood Flow Metab. 1994;14:106–112. doi: 10.1038/jcbfm.1994.15. [DOI] [PubMed] [Google Scholar]
- 9.Younes M, Brown RW, Mody DR, Fernandez L, Laucirica R. GLUT1 expression in human breast carcinoma: correlation with known prognostic markers. Anticancer Res. 1995;15:2895–2898. [PubMed] [Google Scholar]
- 10.Kato Y, Tsuta K, Seki K, Maeshima AM, Watanabe S, Suzuki K, Asamura H, Tsuchiya R, Matsuno Y. Immunohistochemical detection of GLUT-1 can discriminate between reactive mesothelium and malignant mesothelioma. Mod Pathol. 2007;20:215–220. doi: 10.1038/modpathol.3800732. [DOI] [PubMed] [Google Scholar]
- 11.Ito H, Duxbury M, Zinner MJ, Ashley SW, Whang EE. Glucose transporter-1 gene expression is associated with pancreatic cancer invasiveness and MMP-2 activity. Surgery. 2004;136:548–556. doi: 10.1016/j.surg.2004.05.032. [DOI] [PubMed] [Google Scholar]
- 12.Sung JY, Kim GY, Lim SJ, Park YK, Kim YW. Expression of the GLUT1 glucose transporter and p53 in carcinomas of the pancreatobiliary tract. Pathol Res Pract. 2010;206:24–29. doi: 10.1016/j.prp.2009.07.018. [DOI] [PubMed] [Google Scholar]
- 13.Yamasaki T, Seki N, Yoshino H, Itesako T, Yamada Y, Tatarano S, Hidaka H, Yonezawa T, Nakagawa M, Enokida H. Tumor-suppressive microRNA-1291 directly regulates glucose transporter 1 in renal cell carcinoma. Cancer Sci. 2013;104:1411–1419. doi: 10.1111/cas.12240. [DOI] [PMC free article] [PubMed] [Google Scholar]


