Abstract
Objective: This study aims to observe the pathological changes of the brain and spinal cord in an experimental allergic encephalitis (EAE) mice model in the early onset, peak and remission periods of the disease, to detect the changes in the T-cell subsets and cytokine levels, to analyze the types of immune response and related principles in the different stages of the disease. Methods: C57BL/6 mice were randomly divided into two groups: the EAE group (n = 18) and the control group (n = 18). C57BL/6 mice were immunized with myelin oligodendrocyte glycoprotein (MOG) 35-55 polypeptide/complete Freund’s adjuvant (CFA) to establish the EAE mouse model. In the control group, the mice were treated with normal saline. The weights of the mice were recorded during the experiment. Peripheral blood was collected on the 0 day, 3rd day, 7th day, 14th day and 21st day after immunization, and the levels of T-cell subsets were detected by flow cytometry. The brain and spinal cord were taken on the 7th day (early onset), 18th day (peak) and 30th day (remission) after immunization. HE staining was used to observe the infiltration of inflammatory cells, and LFB staining was used to observe the loss of the myelin sheath. The immunohistochemical method was used to detect the T cells and B cell related proteins, and an ELISA assay was used to detect the changes of IL-4, IL-6, IL-10, IL-12, IL-17, IL-23, TNF-α, IFN-γ and TGF-β in mouse brain tissue. The interactions between the T cell subsets and cytokines, the types of immune responses of the EAE mice in different stages of the disease, and their related principles were analyzed. Results: The symptoms of the EAE mice after treatment for 18 d were more severe than those at 7 d in the mice, while the symptoms were significantly relieved at 30 d. These findings coincide with the results of the weight measurement in mice. The immunohistochemical detection of T-cell and B-cell subset related factors showed that T cells accumulated in the brains of the EAE mice. In contrast, there was no obvious aggregation of B cells. The Th17 and Th2 levels in the T cell subsets in the EAE group were higher than those in the control group from the beginning of the treatment to the twenty-first day after the treatment. The level of Th1 in the EAE group was higher than it was in the control group on the seventh day after the treatment, and it was lower during the rest of the time than it was in the control group. There was no significant difference in the level of γδT between the control group and the EAE group. ELISA results showed that the cytokines in the EAE group were higher than they were in the control group on the seventh day after treatment, but the levels of IFN-γ, IL-12, TGF-β, and IL-23 in EAE group were lower than they were in the control group on the 18th day after the treatment. There was no significant difference in the levels of cytokines between the two groups on the 30th day after the treatment. Conclusions: At the different disease stages of the EAE mice, the balance between Th1 and Th2 and the balance of Th17 differentiation changed. Th17 promoted the development of the disease, and Th2 was more effective in restoring health.
Keywords: Multiple sclerosis (MS), experimental allergic encephalitis (EAE), Th1, Th2, Th17
Introduction
Multiple sclerosis (MS) is an autoimmune disease that occurs due to the genetic factors of susceptible individuals and environmental factors. It is a chronic disease of the central nervous system (CNS) characterized by a loss of motor and sensory functions that result from immune-mediated inflammation, demyelination and subsequent axonal damage. MS is one of the most common causes of neurological disability in young adults [1]. Its pathogenesis was studied by establishing experimental autoimmune encephalomyelitis (EAE) in mice [2]. CD4 + T cells play an important role in the pathogenesis of MS, and the levels of CD4 + T cells are high in the lesions and the cerebrospinal fluid (CSF) of MS patients. Moreover, target antibodies of CD4 + T cells can reduce the recurrence and limit the progression and deterioration of the disease [3].
CD4 + T cells are also known as T helper cells (Th). These cells begin to activate after receiving antigen peptides delivered by antigen presenting cells (APC) and secret cytokines to promote the proliferation and differentiation of themselves and other immune cells, which promote the development of the immune response., The cells can regulate and alleviate the immune response [4,5]. The imbalance between the subsets Th1 and Th2 has been thought to be directly related to the occurrence of MS, and the onset of EAE is initiated by Th1 cells [6]. Th1 cells mediate cellular immunity by secreting cytokines such as IL-2, TNF-α, IL-12, and IFN-γ, and they promote the occurrence of inflammation and play a destructive role. Th2 participates in immune regulation by secreting cytokines such as IL-4, IL-5, IL-10, and IL-13, and it plays a protective role and is related to the imbalance of Th17 [7]. Th17 cells also play an important role in autoimmune central nervous system diseases, and their differentiation is regulated by cytokine TGF-β and IL-6, and IL-23 promotes its proliferation [8]. Th17 cells can secrete a variety of proinflammatory cytokines such as GM-CSF, IL-17, IL-21, IL-22, and IL-23, and these cytokines are involved in blood-brain barrier damage, neuronal damage, and other pathological functions [9,10]. One clinical study used all-trans-retinoic acid to inhibit Th17 differentiation through a retinoic acid receptor, promoting Treg cell proliferation and increasing Treg/Th17 ratio to treat MS [11]. The number of γδT cells in the brain tissue and peripheral blood of MS patients increased, which suggested that the γδT cells may participate in the occurrence of MS [12,13].
In this study, we detected the pathological changes of EAE mice during the whole period of disease and analyzed the content of T-cell subsets in peripheral blood and the related cytokines in mouse brain tissues, which could improve the understanding of the pathogenicity of MS.
Materials and methods
Experimental animals and reagents
A total of 36 female C57BL/6 mice (SPF, 6~8 weeks, weight 18~20 g) were purchased from THE Experimental Animal Center of the Academy of Military Medical Sciences, PLA (Nanjing, China). They were randomly divided into 2 groups: the EAE group (n = 18) and the control group (n = 18). The EAE model was established by myelin oligodendrocyte glycoprotein (MOG) 35-55 immunization, and the mice in the control group were treated with normal saline. They were bred in the same environment.
Freund’s complete adjuvant (#SLBR3879, Sigma); Rabbit Anti-IL-4 (bs-0581R, Bioss, Beijing, China); CD3E Polyclonal Antibody; Rabbit Anti-IL-17 (bs -1183R, Bioss, Beijing, China); Rabbit Anti-IL2RA/CD25 (bs-0577R, Bioss, Beijing, China); Rabbit Anti-IFN-gamma (bs-0480R, Bioss, Beijing, China); Rabbit Anti-CD27 (bs-2491R, Bioss, Beijing, China); Rabbit Anti-Syndecan-1 (bs-1309R, Bioss, Beijing, China); Rabbit Anti-CD19 (bs-4755R, Bioss, Beijing, China); Rabbit Anti-CD4 (bs-0647R, Bioss, Beijing, China); Rabbit Anti-CD45 (bs-10599R, Bioss, Beijing, China); Anti-Plasma Cell antibody[LIV3G11](ab44876, abcam); CD4 (PE) antibody: (BD Biosciences, 561973); IFN-γ (APC) antibody: (BD Biosciences, 562017); IL-4 (APC) antibody: (BD Biosciences, 562045); IL-17 (APC) antibody: (Biolegend, 506915); CD3 (FITC) antibody: (BD Biosciences, 553061); TCRγδ (APC) (BD Biosciences, 561049); CD25 (PE/Cy7) antibody: (Biolegend, 102015); CD19 (FITC) antibody: (eBioscience, 11-0193-82); IgD (PE) antibody: (Biolegend, 405705); CD27 (PE) antibody: (Biolegend, 124209); B220 (APC) antibody: (BD Biosciences, 553092); CD138 (APC) antibody: (Biolegend, 142506); ELISA kits; Microscope (CX41, OLYMPUS).
Establishment of EAE model
C57BL/6 mice were immunized with myelin oligodendrocyte glycoprotein (MOG) 35-55 polypeptide/complete Freund’s adjuvant (CFA) to establish the EAE mouse model. The antigen MOG35-55 was diluted to 300 ug/ml using 0.01 mol/L PBS, and the equivalent CFA was added into them and mixed at the ratio of 1:1, the antigen was emulsified in a syringe by connecting the three-limb tubes. They were made into an ivory-white water-in-oil emulsion. The mice were weighed and anaesthetized by intraperitoneal injection with 0.6% pentobarbital sodium (70 mg/kg), and then a subcutaneous injection of antigen emulsion (0.2 ml) was performed on both sides of the ventral midline spinal cord. The mice were given an intraperitoneal injection of 500 ng pertussis toxin after immunization and immunization for 48 h.
Collection of mouse specimens
Peripheral blood was collected from the orbital venous plexus after immunization at 0 days, 3 days, 7 days, 14 days, 21 days, and 30 days in the EAE group (n = 3) and in the control group (n = 3), and the blood was analyzed by flow cytometry.
The brain and spinal cord samples were collected after immunization for 7 days (early onset), 18 days (peak period), and 30 days (remission period) in the EAE group (n = 3) and the control group (n = 3) respectively.
Flow cytometry detection
The collected peripheral blood was divided into 8 tubes (50 ul/tube), and then 600 ul PBS was added into each tube. The antibodies (CD3, CD4, CD19, CD25, CD27, B220, CD138) were added and incubated at room temperature for 20 min. They were centrifuged at 2300 rpm for 3 min and the supernatant was discarded. A membrane breaking agent (1 ml) was added and mixed, and then the samples were centrifuged at 2300 rpm for 3 min, and the supernatant was discarded after incubation for 13 min in the dark. They were washed with PBS and antibodies (IFN-γ, IL-4, IL-17, TCRγδ and IgD) were added and incubated at room temperature for 20 min. Th1 (CD4, IFN-γ), Th2 (CD4, IL-4), Th17 (CD4, IL-17), Treg (CD4, CD25), γδT cells (CD3, TCRγ/δ+), initial mature B cells CD19+IgD+, memory B cells CD19+CD27+B220+ and plasma cells CD19-CD138+ were detected by flow cytometry.
HE staining of the brain and spinal cord of mice
The samples were fixed with formalin and embedded with paraffin, and they were cut into 4 um slices. The paraffin slices were roasted, then they underwent dewaxing and hydration. They were stained with Hematoxylin-Eosin and observed under a microscope.
Luxol fast blue (LFB) staining of the brain and spinal cord of mice
The slices were put into an ethanol-chloroform solution (1:1) for 5 min and 95% ethanol for 5 min. They were incubated with 0.1% LFB solution at 56°C overnight. Then they were put into 95% ethanol for 5 min and 70% ethanol for 3 min. They were washed with double distilled water for 3 min and differentiated with a lithium carbonate solution for 1~5 min, and then 70% ethanol for 30 sec. Whether the demarcation of gray and white matter of the spinal cord was clear was observed under the microscope. They were stained with eosin and cresyl violet when the demarcation was clear, and then the myelin sheath changes were observed under a lighted microscope.
Immunohistochemical detection of brain and spinal cord in mice
Briefly, the paraffin slices were dewaxed with xylene and dehydrated with gradient alcohol. Antigen retrieval was performed using a citrate buffer (pH 6.0) at 121°C for 2 min. After serial blocking with hydrogen peroxide and normal horse serum (Gibco; Thermo Fisher Scientific, Inc), they were incubated with primary antibodies (CD4, IFN-γ, IL-4, IL-17, CD25, CD3, CD19, IgD, CD27, B220 and CD138) at 4°C overnight. Then they were incubated with a second antibody at 37°C for 30 min and developed with DAB for 5-10 min, and then they were observed under a microscope and analyzed using ImagePro plus 6.0 software.
ELISA assay
The concentration of IL-4, IL-6, IL-10, IL-12, IL-17, IL-23, TNF-α, IFN-γ and TGF-β in brain samples were detected using ELISA kit (R&D Systems, USA) respectively. They were conducted according to the kit’s manual. The OD450 values were detected using a micro-plate reader (Thermo Fisher, USA).
Statistical analysis
All analyses were conducted using SPSS 17.0 software (SPSS Inc., Chicago, USA). The data were expressed as x̅±s. The differences among the groups were analyzed by t-test. P values <0.05 were considered to be statistically significant.
Results
Weight of mice
The mice weighing results showed that the EAE mice were lighter in weight than those in the control group, and the weight gap gradually increased, until it reached the peak value at around 20 days, and then the gap narrowed (Data not shown).
Flow cytometry detection of peripheral blood
Flow cytometry results showed that the content of TH1 cells in the EAE group was higher than that of the control group at 7th days, and the content of the TH2 cells in the EAE group was higher than that of the control group at 0, 3, 7, 14, and 21 days. The content of the TH17 cells in the EAE group was higher than that of the control group at 3, 7, 14, and 21 days. There was no obvious difference in the inγδT cells’ content between the EAE and control groups. The Treg content in the two groups was almost 0 (Figure 1).
Figure 1.
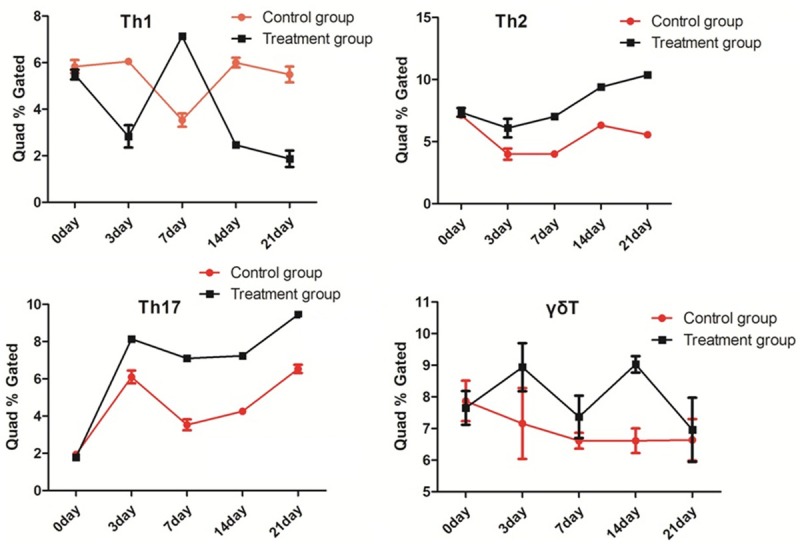
Flow cytometry detection results of the T-cell subsets. There was no obvious difference in the inγδ T cells’ content between the EAE and control groups. The Treg content in the two groups was almost 0.
Staining results
The HE staining results are shown in Figure 2. It showed that a large number of inflammatory cells infiltrated the spinal cord of the EAE group, but there was no obvious change in the control group. The LFB staining results showed that a large number of myelin sheaths were lost and could not be blue dyed in the white matter of the spinal cord in the EAE group, but there was no change in the control group (Figure 3).
Figure 2.
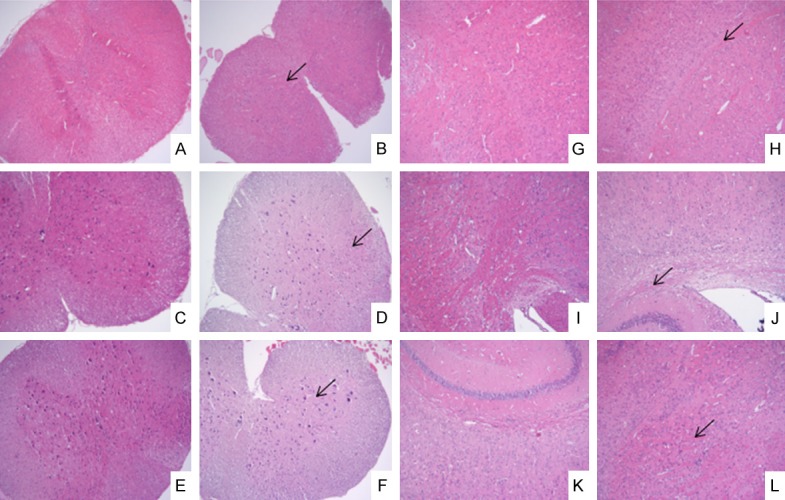
HE staining of brain and spinal cord on the 7th day, the 18th day and the 30th day (×100). A, G: The control group on day 7; B, H: The EAE group on day 7; C, I: The control group on day 18; D, J: The EAE group on day 18; E, K: The control group on day 30; F, L: The EAE group on day; A-F: The spinal cord; G-L: The brain; ↙: Inflammatory cell infiltration.
Figure 3.
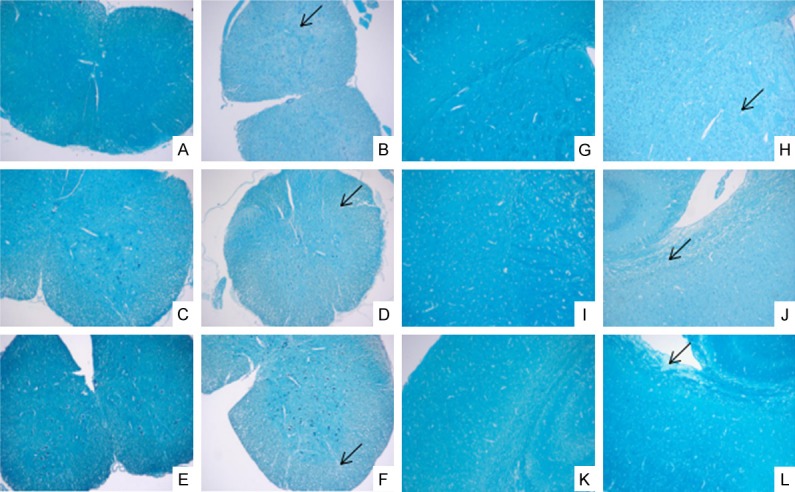
LFB staining of brain and spinal cord on the 7th day, the 18th day and the 30th day (×100). A, G: The control group on day 7; B, H: The EAE group on day 7; C, I: The control group on day 18; D, J: The EAE group on day 18; E, K: The control group on day 30; F, L: The EAE group on day 30; A-F: The spinal cord; G-L: The brain; ↙: Demyelination.
Immunohistochemical detection results of T cell subsets
The expression levels of the T cell subset-related factors in the spinal cord and brain tissue in the EAE group were significantly higher than those in the control group. The IFN-γ expression results are shown in Figure 4, but the others are not shown.
Figure 4.
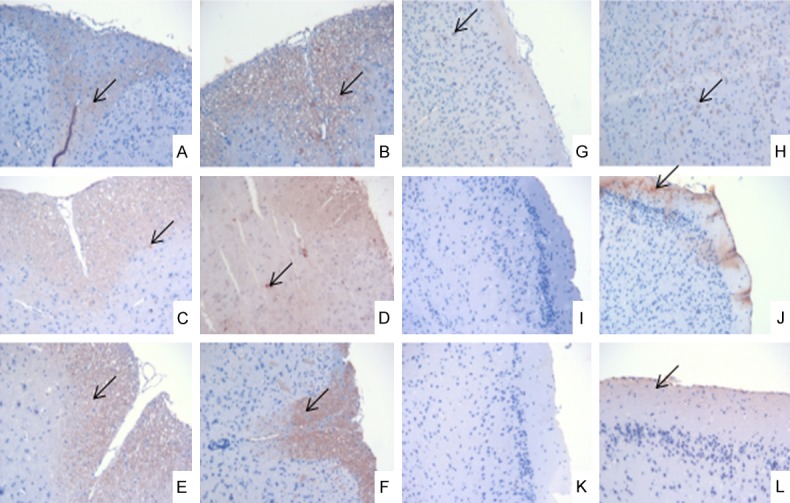
Immunohistochemical results of IFN-δ expression in brain and spinal cord on the 7th day, the 18th day and the 30th day (×200). A, G: The control group on day 7; B, H: The EAE group on day 7; C, I: The control group on day 18; D, J: The EAE group on day 18; E, K: The control group on day 30; F, L: The EAE group on day 30; A-F: The spinal cord; G-L: The brain; ↙: IFN-γ expression.
Immunohistochemical detection results of B cell subsets
The expression levels of the B-cell subset-related factors in the spinal cords in the EAE group were significantly higher than of the levels in the control group, but there was no significant difference in the brain tissues between the EAE and control groups. The CD27+ expression results are shown in Figure 5, but the others are not shown.
Figure 5.
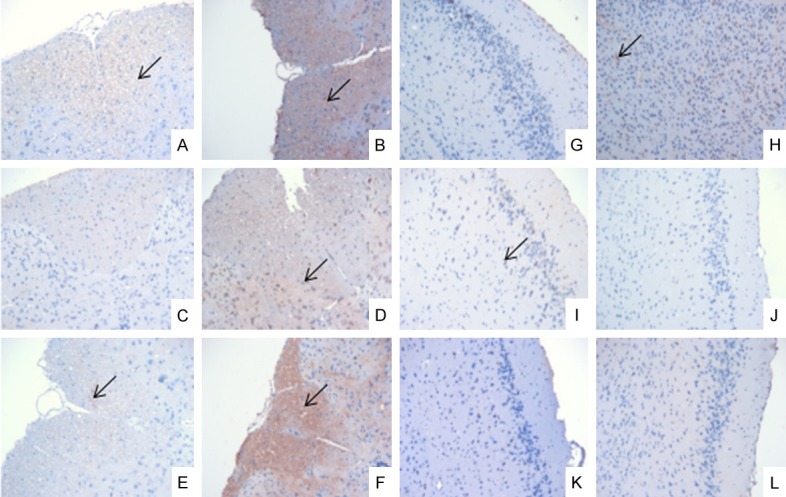
Immunohistochemical results of CD27+ expression in the brain and spinal cord on the 7th day, the 18th day and the 30th day (×200). A, G: The control group on day 7; B, H: The EAE group on day 7; C, I: The control group on day 18; D, J: The EAE group on day 18; E, K: The control group on day 30; F, L: The EAE group on day 30; A-F: The spinal cord; G-L: The brain; ↙: CD27+ expression.
ELISA results
The ELISA results are shown in Table 1. The IFN-γ level of the EAE group was the highest on the 7th day, but it was the lowest at the 18th day. The IL-12 level of the EAE group was the lowest on the 18th day. The level of TNF-α was highest on the 7th day, and the levels of IL-4 and IL-10 were also highest on the 7th day. The TGF-β level increased on the 7th day and then decreased, the IL-12 level decreased on the 18th day, and the IL-10 level increased on the 7th day. The levels of TGF-β, IL-6 and IL-23 were high on the 7th day, but the levels of TGF-β and IL-23 were low on the 18th day. There was no significant difference between the EAE group and the control group on the 30th day.
Table 1.
IL-4, IL-6, IL-10, IL-12, IL-17, IL-23, TNF-α, IFN-γ and TGF-β content
| Index | Control (n = 9) | EAE (n = 9) | ||||
|---|---|---|---|---|---|---|
|
| ||||||
| 7 D | 18 D | 30 D | 7 D | 18 D | 30 D | |
| IL-4 (pg/mL) | 128.34±34.18 | 154.22±35.28 | 126.78±36.24 | 158.75±37.15* | 135.28±17.43 | 120.44±28.17 |
| IL-6 (pg/mL) | 98.43±5.49 | 101.20±6.75 | 96.62±3.89 | 108.80±6.16* | 100.19±6.75 | 99.90±5.04 |
| IL-10 (pg/mL) | 370.12±26.47 | 505.21±70.50 | 459.08±38.61 | 492.21±74.58* | 456.70±69.24 | 424.46±81.63 |
| IL-12 (pg/mL) | 52.25±5.40 | 60.03±7.31 | 54.34±7.61 | 53.59±12.89 | 49.31±10.93* | 51.39±4.84 |
| IL-17 (pg/mL) | 6.72±0.35 | 6.80±0.52 | 6.25±0.32 | 7.06±0.68 | 6.03±1.48* | 6.14±0.39 |
| IL-23 (pg/mL) | 73.19±8.19 | 84.47±8.80 | 76.65±4.33 | 82.49±9.42* | 75.90±6.38* | 75.24±4.70 |
| TNF-α (pg/mL) | 474.50±106.31 | 469.35±70.83 | 493.16±68.21 | 600.15±83.04* | 445.18±106.88 | 503.62±81.71 |
| IFN-γ (pg/mL) | 598.18±45.39 | 809.23±83.42 | 690.50±49.21 | 765.26±106.05* | 674.42±90.87* | 681.22±68.39 |
| TGF-β (pg/mL) | 732.48±130.48 | 1002.99±46.11 | 961.35±128.67 | 958.41±205.15* | 868.99±115.90* | 814.59±94.19* |
P<0.05 vs. Control.
Discussion
The successful establishment of the EAE model stems from a cytokine-mediated imbalance between the functions of the T-cell subsets, which led to the attacks on autoantigen-myelin basic protein (MBP). When the T cells activated by MBP polypeptide fragments identified by the EAE rats are transfected into normal rats, they can also induce EAE in normal rats [2]. EAE is usually used as a classic MS model, because the pathological changes of EAE are similar to those of MS, and their immunological mechanisms are similar, so EAE is usually used as a classical model of MS in the experiment.
In this study, the pathological examination of paraffin slices of the brains and spinal cord tissues of EAE mice showed that the symptoms after treatment for 18 d were more severe than that at 7 d in the mice, but the symptoms were significantly relieved at 30 d. These findings coincide with the results of the weight measurement in mice. Therefore, we speculated that the symptoms of EAE mice continued to develop and were controlled and relieved after treatment for about 3 weeks. The immunohistochemical detection of T cells and B-cell subset related factors showed that T cells accumulated in the brains of the EAE mice. In contrast, there was no obvious aggregation of B cells. The major histocompatibility complex II (MHC-II) molecules were expressed on the surface of the B cells, and they bound to the CD4 + T cell surface receptors and led to the antigen specific T-cell proliferation and cytokine production. The T cells also assisted in the proliferation and differentiation of B cells through various cytokines [14]. Therefore, it could be speculated that the role of the B cells in the pathogenesis of EAE may occur more downstream, resulting in more effects on antibody production and fewer effects on regulation.
In this study, we found that the Th17 and Th2 levels in the T cell subsets in the EAE group were higher than those in the control group from the beginning of the treatment to the twenty-first day after the treatment. The level of Th1 in the EAE group was higher than that of the control group at the seventh day after the treatment, and it was lower the rest of time than it was in the control group. There was no significant difference in the levels of γδT between the control group and the EAE group. The permeability of the blood brain barrier was increased by injecting pertussis toxin during the establishment of the EAE model, and the immune cells, cytokines and antibodies in the peripheral blood entered into the brain more easily [15]. T cells, mainly helper T cells and regulatory T cells, constituted a complex network to regulate the development and balance of the immune responses [16]. Cytokines IFN-γ and IL-12 induced Th1 and Th1 secreted IFN-γ and TNF-α; IL-4 induced Th2 and Th2 secreted IL-4, IL-10 and IL-6; TGF-β, IL-6 and IL-23 induced Th17 and Th17 secreted IL-17 and TNF-α; TGF-β and IL-12 induced Treg and Treg secreted IL-10 and TGF-β [17-19]. The IFN-γ level of the EAE group was the highest at the 7th day, but it was lowest at the 18th day. The IL-12 level of the EAE group was lowest at the 18th day, which was consistent with the results of Th1 flow cytometry. The level of TNF-α was affected by the trend of Th1 and Th17 recombination and was the highest at the 7th day, and the levels of IL-4 and IL-10 were also the highest at the 7th day, which was consistent with the results of Th2 flow cytometry. The TGF-β level increased at the 7th day and then decreased, the IL-12 level decreased at the 18th day, and the IL-10 level increased at the 7th day. The levels of TGF-β, IL-6 and IL-23 were high at the 7th day, but the levels of TGF-β and IL-23 were low at the 18th day, which suggested that the Th17 level increased, and these data are consistent with our previous results [20]. Studies have shown that the initial CD4 + T cells in mice that differentiated into regulatory T cells or Th17 were mutually exclusive [21,22]. Our results showed that the level of Th17 was high. Although regulatory T cells had the function of inhibiting an inflammatory reaction, it may not play a major role in the later period of symptomatic remission of the EAE model.
There is a balance between Th1 and Th2 function mediated cytokines. Th1 mainly has a proinflammatory effect, but Th2 mainly has an anti-inflammatory effect [23]. Similarly, Th17 tends to produce a protective and non-pathogenic differentiation when it is induced by cytokines TGF-β and IL-23, but it tends to produce a pathogenic differentiation which is induced by cytokine IL-6 [24,25]. The results of this study showed that the levels of Th17, Th1 and Th2 increased during the first week after the establishment of the EAE model, and it could be speculated that the modeling process brought a strong immune response. Gradually, the mechanism of immune regulation in vivo was effective, and the proinflammatory Th1 was inhibited. However, the corresponding autoimmune response initiated by the MOG polypeptide also began to appear. This made the balance of Th17 prone to pathogenicity, which promoted an autoimmune reaction and damaged nerve cells. The inflammatory response caused by the autoimmune response also affected the balance between Th1 and Th2.
In a word, this study found that the balance between Th1 and Th2 and the balance of Th17 differentiation changed in the EAE mouse model. Th17 promoted the development of the disease, but Th2 promoted the recovery of health. B cells were also involved in this, and their sustained production of pathogenic antibodies maybe a pathway possible.
Acknowledgements
This work was supported by the National Key Clinical Specialty Construction Project ([2012]-649).
Disclosure of conflict of interest
None.
References
- 1.Karussis D. The diagnosis of multiple sclerosis and the various related demyelinating syndromes: a critical review. J Autoimmun. 2014;48-49:134–142. doi: 10.1016/j.jaut.2014.01.022. [DOI] [PubMed] [Google Scholar]
- 2.Ben-Nun A, Lando Z. Detection of autoimmune cells proliferating to myelin basic protein and selection of T cell lines that mediate experimental autoimmune encephalomyelitis (EAE) in mice. J Immunol. 1983;130:1205–1209. [PubMed] [Google Scholar]
- 3.Kohm AP, Carpentier PA, Anger HA, Miller SD. Cutting edge: CD4+CD25+ regulatory T cells suppress antigen-specific autoreactive immune responses and central nervous system inflammation during active experimental autoimmune encephalomyelitis. J Immunol. 2002;169:4712–4716. doi: 10.4049/jimmunol.169.9.4712. [DOI] [PubMed] [Google Scholar]
- 4.Liu X, Lee YS, Yu CR, Egwuagu CE. Loss of STAT3 in CD4+ T cells prevents development of experimental autoimmune diseases. J Immunol. 2008;180:6070–6076. doi: 10.4049/jimmunol.180.9.6070. [DOI] [PMC free article] [PubMed] [Google Scholar]
- 5.Lin QQ, Yan CF, Lin R, Zhang JY, Wang WR, Yang LN, Zhang KF. SIRT1 regulates TNF-alphainduced expression of CD40 in 3T3-L1 adipocytes via NF-kappaB pathway. Cytokine. 2012;60:447–455. doi: 10.1016/j.cyto.2012.05.025. [DOI] [PubMed] [Google Scholar]
- 6.Sriram S, Carroll L, Fortin S, Cooper S, Ranges G. In vivo immunomodulation by monoclonal anti-CD4 antibody. II. Effect on T cell response to myelin basic protein and experimental allergic encephalomyelitis. J Immunol. 1988;141:464–468. [PubMed] [Google Scholar]
- 7.Lu P, Wang M, Zheng P, Hou J, Zhang Y, Deng Y, Cao Y. Th17/Treg unbalance is involved in the pathogenesis of experimental autoimmune encephalomyelitis. Xi Bao Yu Fen Zi Mian Yi Xue Za Zhi. 2014;30:1013–1017. [PubMed] [Google Scholar]
- 8.Liu X, Leung S, Wang C, Tan Z, Wang J, Guo TB, Fang L, Zhao Y, Wan B, Qin X, Lu L, Li R, Pan H, Song M, Liu A, Hong J, Lu H, Zhang JZ. Crucial role of interleukin-7 in T helper type 17 survival and expansion in autoimmune disease. Nat Med. 2010;16:191–197. doi: 10.1038/nm.2077. [DOI] [PubMed] [Google Scholar]
- 9.Kebir H, Kreymborg K, Ifergan I, Dodelet-Devillers A, Cayrol R, Bernard M, Giuliani F, Arbour N, Becher B, Prat A. Human TH17 lymphocytes promote blood-brain barrier disruption and central nervous system inflammation. Nat Med. 2007;13:1173–1175. doi: 10.1038/nm1651. [DOI] [PMC free article] [PubMed] [Google Scholar]
- 10.Xu W, Li R, Dai Y, Wu A, Wang H, Cheng C, Qiu W, Lu Z, Zhong X, Shu Y, Kermode AG, Hu X. IL-22 secreting CD4+ T cells in the patients with neuromyelitis optica and multiple sclerosis. J Neuroimmunol. 2013;261:87–91. doi: 10.1016/j.jneuroim.2013.04.021. [DOI] [PubMed] [Google Scholar]
- 11.Jamshidian A, Shaygannejad V, Pourazar A, Zarkesh-Esfahani SH, Gharagozloo M. Biased Treg/Th17 balance away from regulatory toward inflammatory phenotype in relapsed multiple sclerosis and its correlation with severity of symptoms. J Neuroimmunol. 2013;262:106–112. doi: 10.1016/j.jneuroim.2013.06.007. [DOI] [PubMed] [Google Scholar]
- 12.Stinissen P, Vandevyver C, Medaer R, Vandegaer L, Nies J, Tuyls L, Hafler DA, Raus J, Zhang J. Increased frequency of gamma delta T cells in cerebrospinal fluid and peripheral blood of patients with multiple sclerosis. Reactivity, cytotoxicity, and T cell receptor V gene rearrangements. J Immunol. 1995;154:4883–4894. [PubMed] [Google Scholar]
- 13.Mekala DJ, Alli RS, Geiger TL. IL-10-dependent infectious tolerance after the treatment of experimental allergic encephalomyelitis with redirected CD4+CD25+ T lymphocytes. Proc Natl Acad Sci U S A. 2005;102:11817–11822. doi: 10.1073/pnas.0505445102. [DOI] [PMC free article] [PubMed] [Google Scholar]
- 14.Lanzavecchia A. Pillars article: antigen-specific interaction between T and B cells. 1985. J Immunol. 2007;179:7206–7208. [PubMed] [Google Scholar]
- 15.Carbonetti NH. Pertussis toxin and adenylate cyclase toxin: key virulence factors of Bordetella pertussis and cell biology tools. Future Microbiol. 2010;5:455–469. doi: 10.2217/fmb.09.133. [DOI] [PMC free article] [PubMed] [Google Scholar]
- 16.van den Broek T, Borghans JA, van Wijk F. The full spectrum of human naive T cells. Nat Rev Immunol. 2018;18:363–373. doi: 10.1038/s41577-018-0001-y. [DOI] [PubMed] [Google Scholar]
- 17.Zhu J, Yamane H, Paul WE. Differentiation of effector CD4 T cell populations (*) Annu Rev Immunol. 2010;28:445–489. doi: 10.1146/annurev-immunol-030409-101212. [DOI] [PMC free article] [PubMed] [Google Scholar]
- 18.Egwuagu CE. STAT3 in CD4+ T helper cell differentiation and inflammatory diseases. Cytokine. 2009;47:149–156. doi: 10.1016/j.cyto.2009.07.003. [DOI] [PMC free article] [PubMed] [Google Scholar]
- 19.Hoffmann P, Boeld TJ, Eder R, Huehn J, Floess S, Wieczorek G, Olek S, Dietmaier W, Andreesen R, Edinger M. Loss of FOXP3 expression in natural human CD4+CD25+ regulatory T cells upon repetitive in vitro stimulation. Eur J Immunol. 2009;39:1088–1097. doi: 10.1002/eji.200838904. [DOI] [PubMed] [Google Scholar]
- 20.Lee YK, Mukasa R, Hatton RD, Weaver CT. Developmental plasticity of Th17 and Treg cells. Curr Opin Immunol. 2009;21:274–280. doi: 10.1016/j.coi.2009.05.021. [DOI] [PubMed] [Google Scholar]
- 21.Yu JS, Hamada M, Ohtsuka S, Yoh K, Takahashi S, Miaw SC. Differentiation of IL-17-producing invariant natural killer T cells require expression of the transcription factor c-Maf. Front Immunol. 2017;8:1399. doi: 10.3389/fimmu.2017.01399. [DOI] [PMC free article] [PubMed] [Google Scholar]
- 22.Wang J, Li XB, Huang P, Huang MY, Gu XJ. Change of peripheral blood Treg/Thl7 in cognitive impairment with chronic renal failure patients. Cell Physiol Biochem. 2018;45:281–290. doi: 10.1159/000486809. [DOI] [PubMed] [Google Scholar]
- 23.Kolbinger F, Huppertz C, Mir A, Padova FD. IL-17A and multiple sclerosis: signaling pathways, producing cells and target cells in the central nervous system. Curr Drug Targets. 2016;17:1882–1893. doi: 10.2174/1389450117666160307144027. [DOI] [PubMed] [Google Scholar]
- 24.Maverakis E, Kim K, Shimoda M, Gershwin ME, Patel F, Wilken R, Raychaudhuri S, Ruhaak LR, Lebrilla CB. Glycans in the immune system and the altered glycan theory of autoimmunity: a critical review. J Autoimmun. 2015;57:1–13. doi: 10.1016/j.jaut.2014.12.002. [DOI] [PMC free article] [PubMed] [Google Scholar]
- 25.Singh B, Schwartz JA, Sandrock C, Bellemore SM, Nikoopour E. Modulation of autoimmune diseases by interleukin (IL)-17 producing regulatory T helper (Th17) cells. Indian J Med Res. 2013;138:591–594. [PMC free article] [PubMed] [Google Scholar]


