Abstract
Diabetic nephropathy is a common complication of type 2 diabetes and is related to the epithelial to mesenchymal transition. In this study, we aimed to find whether the RhoA/ROCK pathway affects the development of diabetic nephropathy caused by the epithelial to mesenchymal transition both in vivo and in vitro. The results show that inhibition of the RhoA/ROCK signaling pathway improved the pathology and degree of fibrosis in diabetic nephropathy as determined by hematoxylin and eosin staining and Masson staining. We also found, using immunohistochemistry and quantitative reverse transcription polymerase chain reaction, that a RhoA/Rock inhibitor regulated relative protein and gene expression levels in a dose-dependent manner. Furthermore, the inhibitor improved fibrosis induced by high levels of glucose in HK-2 cells by suppressing E-cadherin, α-SMA, and FSP-1 expression. In conclusion, the RhoA/ROCK signaling pathway plays an important role in the development of diabetic nephropathy and could be a potential therapeutic target for type 2 diabetes.
Keywords: Diabetic nephropathy, RhoA/ROCK pathway, epithelial to mesenchymal transition
Introduction
Diabetic nephropathy (DN) is the most common complication of diabetes and frequently leads to end-stage renal disease [1]. Although type I and type II diabetes differ in etiology, they are almost indistinguishable in glucose-induced renal physiological changes, and both types of diabetes often lead to kidney injury [2-4]. The epithelial to mesenchymal transition (EMT), which leads to renal interstitial fibrosis, is an important pathological aspect of DN development [5,6].
Rho is a small guanosine binding protein, and Rho kinase (ROCK) is an important gene downstream of the RhoA activation pathway. Recent studies found that RhoA/ROCK signaling pathway activation is involved in the remodeling of multiple tissue structures [7-9] and plays an important role in the occurrence and development of complications in chronic diabetes [10]. However, few correlations have been found in vitro and in vivo between the RhoA/ROCK signaling pathway and DN development. Therefore, in our study, we investigated the role of the RhoA/ROCK signaling pathway in DN development using cell culture and animal experiments.
Materials and methods
Chemicals and reagents
TWEEN 20, bovine serum albumins (BSA), sodium dodecyl sulfate (SDS), Tris, glycine, dithiothreitol (DTT), and phenylmethylsulfonyl fluoride (PMSF) were purchased from Sigma Chemical (St. Louis, MO, USA). Hydroxyproline assay kits and urine protein test kits were purchased from Nanjing Jiancheng Bio-engineering Institute (Nanjing, China). TGF-β1, fibronectin, and type I collagen enzyme linked immunosorbent assay (ELISA) kits were purchased from Abcam (Cambridge, UK). Primary antibodies against α-SMA (ab124964), E-cadherin (ab76055), and fibroblast-specific protein 1 (FSP-1) (ab197896) were purchased from Abcam (Cambridge, MA, UK). Ultra-pure water was acquired from a Mill Q-plus system (Billerica, MA).
Animals
Adult male SD rats, with a body weight of 203±18 g, were purchased from Nanjing Medicinal University (Nanjing, China). All animals were kept at 21±3°C in a 12 h light to dark cycle with free eating and drinking. The study was approved by the institutional animal care and use committee (BSK-046-00).
Rat model of diabetic nephropathy
A total of 35 rats were initially randomly divided into 3 groups as follows: normal control (NC, 9 rats), diabetes nephropathy model (Model, 13 rats), and Rho inhibitor (Y276312) injection in the caudal vein (Inhibitor, 13 rats) groups. The NC group was subjected to normal treatment. The Model and Inhibitor groups were injected with 40 mg/kg streptozotocin (STZ) into the abdomen to obtain medium diabetic rats. The diabetes model was evaluated by determining fasting plasma glucose levels 72 h after STZ injection: a value ≥16.7 mmol/L indicated success. Four rats failed to become diabetic and were excluded from the experiments, and 3 and 2 rats died in the Model and Inhibitor groups, respectively. At the end of the experiments, both the NC and Model groups had 9 rats each, and the Inhibitor group had 10 rats. Body weight in each group was measured once a week. After feeding for 12 weeks, the rats were subjected to fasting and the 24-h urine was collected. The rats were killed the following day, and the serum from the inferior vena cava was collected and the kidney weight measured. Protein and creatinine were measured in the 24-h urine using a multifunction biochemical analyzer (Kubel Biological Polytron Technologies, China).
Histopathological analysis
Kidney tissues were fixed using 10% formalin and embedded in paraffin. Sections of 4 μm were cut and stained with H&E and Masson staining. Pathological changes were evaluated using an Olympus BX51 light microscope (Olympus, Japan) at 400× magnification and documented using an Olympus DP70 digital imaging system (Olympus, Japan). Epithelial proliferation, alveolitis, edema, inflammatory cell infiltration, and interstitial fibrosis were evaluated with H&E staining, and the degree of fibrosis with Masson staining. The degree of fibrosis was classified in 5 grades: 0, normal; 0.5, slight; 1, mild; 2, moderate; and 3, severe.
Hydroxyproline analysis
About 50 mg of kidney tissue was mixed with hydrolysate (1 mL) from the Hydroxyproline kit and hydrolyzed in water at 95ºC for 20 min. The hydroxyproline content was determined according to the manufacturer’s instructions.
Immunohistochemical analysis
Kidney tissue sections stored in 10% formalin for 48 h and paraffin embedded were prepared for immunohistochemical staining. Sections were mounted on slides, dewaxed, hydrated, and boiled in a 10 mM sodium citrate buffer (pH 6) for 20 min and cooled at room temperature for about 30 min. After treatment with 0.1% triton-100 for 10 min, sections were incubated in 3% hydrogen peroxide for 10 min. After blocking with normal goat serum for 20 min at 37°C, sections were incubated with anti-FSP-1, anti-α-SMA, or anti-E-cadherin antibodies at 4°C overnight. Sections were washed and incubated with peroxidase-conjugated secondary antibodies at 37°C for 1 h. After incubation with 3, 3’-diaminobenzidine tetrahydrochloride and hydrogen peroxide, sections were counterstained with hematoxylin.
Cell culture analysis
The HK-2 cell line was purchased from ATCC (USA). Cells were cultured using the Keratinocyte-SFM kit (17005-042) containing human recombinant epidermal growth factor (EGF) and bovine pituitary extract (BPE) at 37°C in a humidified atmosphere of 5% CO2. For EMT induction, HK-2 cells were stimulated with D-glucose (25 mmol/mL) for 72 h and then incubated with Keratinocyte-SFM blank medium for 2 h. The HK-2 cells were randomly divided into 3 groups: the NC group, subjected to normal treatment, the Model group, treated with D-glucose (25 mmol/mL), and the Inhibitor group, treated with Y276312.
ELISA
Cell culture supernatant from the 3 groups was collected, centrifuged, and stored at -80°C until use. The hydroxyproline content was determined using the ELISA kit following the manufacturer’s instructions. Absorbance was measured at 450 nm.
Immunofluorescence analysis
Cultured HK-2 cells from the different groups were fixed in 10% formalin at room temperature for 30 min, treated with 0.1% triton-100 for 10 min, and incubated in 3% hydrogen peroxide for 10 min. After blocking with normal goat serum at 37°C for 20 min, the sections were incubated with anti-FSP-1, anti-α-SMA, or anti-E-cadherin antibodies overnight at 4°C. Samples were washed, incubated with FITC-conjugated secondary antibodies at 37°C for 1 h, and counterstained with Hoechst 33258.
RT-qPCR assay
Total RNA of cells or tissues was extracted using the RNeasy kit (Qiagen, CA), and cDNA synthesis was performed using the High-Capacity cDNA Reverse Transcription kit (Applied Biosystems, CA). RT-PCR conditions were as follows: 95°C for 30 s, and 40 cycles at 95°C for 5 s and 60°C for 30 s. Relative gene expression was determined using the 2-ΔΔCT method. Glyceraldehyde-3-phosphate dehydrogenase (GAPDH) was used as an internal reference in these experiments. Primer sequences were as follows: E-cadherin, F: 5’-CCAAGCAGCAGTACATTCTACA-3’ and R: 5’-CATTCACATCCAGCACATCCA-3’; FSP-1, F: 5’-GTGTCCACCTTCCACAAGTAC-3’ and R: 5’-GCTGTCCAAGTTGCTCATCA-3’; α-SMA, F: 5’-AGAGTTACGAGTTGCCTATG-3’ and R: 5’-ATGATGCTGTTGTAGGTGGTT-3’; and GAPDH, F: 5’-AGATCATCAGCAATGCCTCCT-3’ and R: 5’-TGAGTCCTTCCACGATACCAA-3’.
Western blot analysis
HK-2 cells from the different groups were collected and lysed in ice-cold lysis buffer. Equal amounts of protein (30 μg) were separated on a 12% SDS-polyacrylamide gel and transferred to a PVDF membrane (Abcam, USA). After treating with 5% non-fat dry milk and washing with TBST, the membranes were incubated overnight at 4°C with primary antibody as follows: anti-E-cadherin at 1:200, antiα-SMA at 1:200, anti- FSP-1 at 1:200, and anti-GAPDH at 1:1000 dilution. After washing with TBST four times, the secondary antibody at 1:2000 dilution was added with TBST. Protein was detected using the ECL detection kit, and semi-quantitated using Imag-Lab analysis software. GAPDH was used as a reference.
Statistical analysis
Relative data were analyzed using SPSS 22.0 software. Count data are shown as mean ± standard deviation (SD). Differences among groups were analyzed using one-way ANOVA with the LSD test, and P<0.05 was considered statistically significant.
Results
Body and kidney weight and 24-h urine protein and creatinine levels in diabetic rats
Compared to the NC group, the serum creatinine concentration, 24-h urine protein levels, and kidney weight were significantly increased (P<0.01) in the Model group, whereas the values in the Inhibitor group were decreased compared to those of the Model group (P<0.05; Table 1 and Figure 1). After feeding for 6 weeks, significant differences were observed among the NC, Model, and Inhibitor groups (P<0.05, Figure 1).
Table 1.
The biochemical of difference groups (mean ± SD)
| NC | Model | Inhibitor | |
|---|---|---|---|
| Creatinine (μmol/L) | 185.92±2.92 | 695.78±3.49** | 406.52±2.35# |
| Urine protein (μg/24 h) | 66.33±2.43 | 1464.28±2.95** | 335.52±3.23# |
P<0.01, compared to the NC group;
P<0.05, compared to the Model group.
Figure 1.
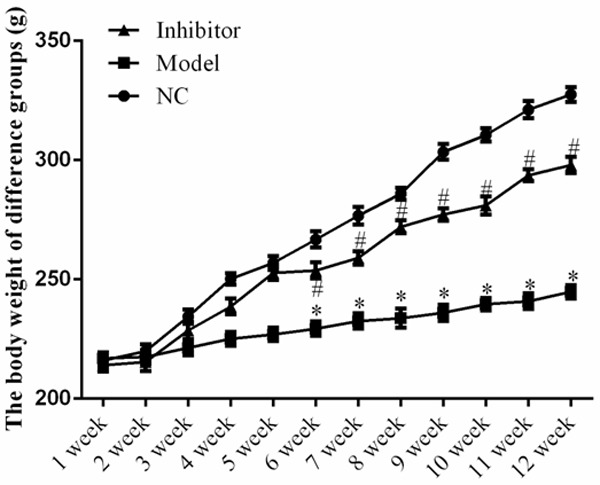
Body weight of rats in the different groups. *: P<0.05, vs. NC group; #: P<0.05, vs. Model.
Renal histomorphological changes in diabetic rats
H&E staining showed that, the glomerular tuft area was larger, and the mesangial matrix index was higher in the Model group, compared to the NC group, indicating glomerular hypertrophy. Compared to the Model group, the mesangial matrix and glomerular hypertrophy expansion were improved in the Inhibitor group (Figure 2).
Figure 2.
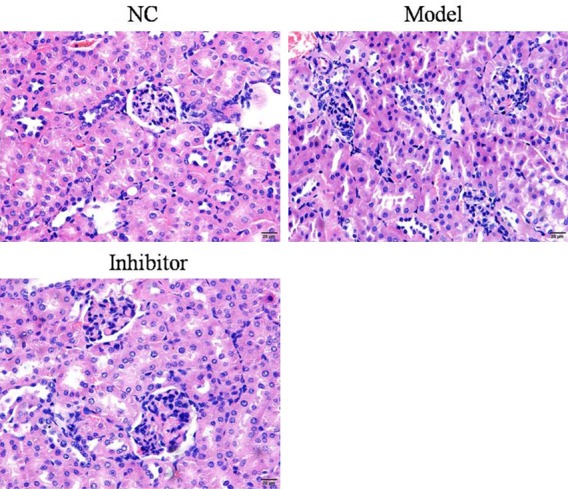
Pathological aspects of rats in the different groups as determined by H&E staining (×100).
Renal fibrosis in diabetic rats
Masson staining showed that the structure of glomeruli and renal tubules was normal, and no blue collagen fibrous deposition was observed. The basal membrane of the renal tubule was clearly visible, and the staining was dark red overall in the NC group. In the Model group, the renal interstitium had a large amount of collagen proliferation, blue collagen hyperplasia, collagen fibers, and glomeruli with different degrees of fibrosis. Compared to the Model group, the Inhibitor group showed less collagen hyperplasia and the blue collagen deposition decreased significantly, with the staining being light green. The relative data are shown in Figure 3.
Figure 3.
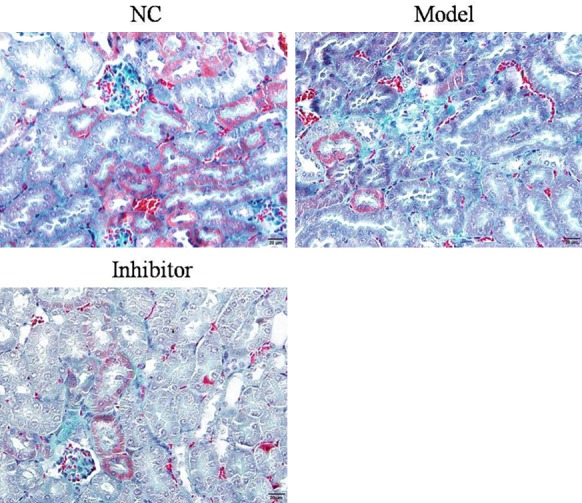
Fibrosis in rats of different groups as determined by Masson staining (×100).
EMT-related proteins expression in diabetic rats
Relative protein expressions were determined in the different groups. The results show that E-cadherin protein expression in the Model group was suppressed compared to that of the NC group (P<0.05; Figure 4). In contrast, E-cadherin protein expression was significantly increased in the Inhibitor group compared toto the Model group (P<0.05; Figure 4). The expression levels of α-SMA and FSP-1 were significantly increased in the Model group compared to the NC group (P<0.05; Figures 5 and 6, respectively). In addition, compared to the Model group, the α-SMA and FSP-1 protein levels in the Inhibitor group were significantly inhibited (P<0.05, Figures 5 and 6, respectively).
Figure 4.
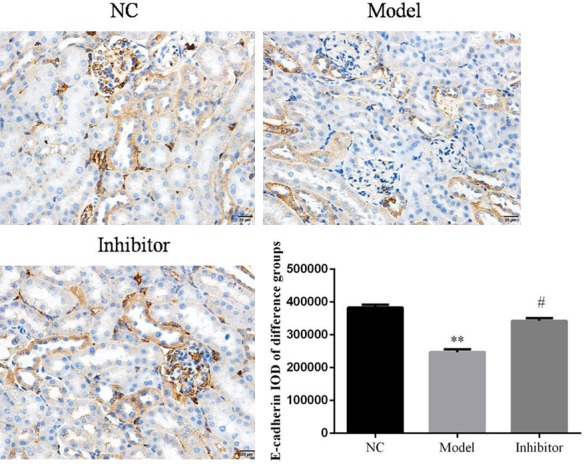
E-cadherin protein expression in rats from different groups as determined by immunohistochemistry (×100). **: P<0.05, vs. NC group; #: P<0.05, vs. Model.
Figure 5.
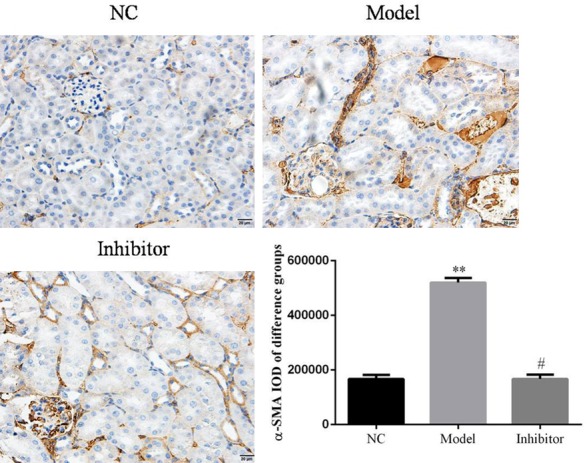
α-SMA protein expression in rats of different groups as determined by immunohistochemistry (×100). **: P<0.05, vs. NC group; #: P<0.05, vs. Model.
Figure 6.
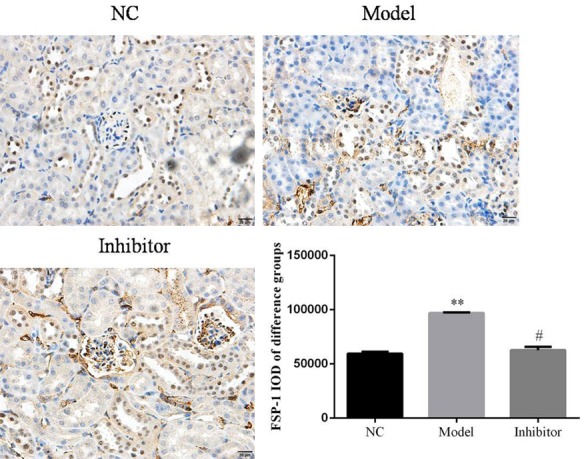
FSP-1 protein expression in rats of different groups by immunohistochemistry (×100). **: P<0.05, vs. NC group; #: P<0.05, vs. Model.
Relative gene expression in diabetic rats as determined by RT-PCR
Compared to the NC group, the E-cadherin, FSP-1, and α-SMA gene expression levels were significantly different in the Model group (P<0.05). However, the corresponding levels in the Inhibitor group were significantly improved compared to those of the Model group (P<0.05) in the vivo study. The relative data are shown in Figure 7.
Figure 7.
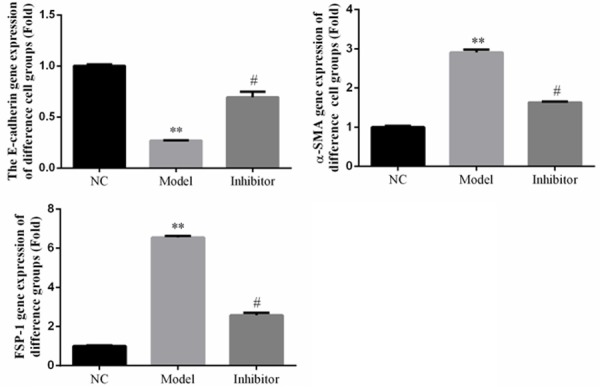
Relative gene expression in rats of different groups in vivo. **: P<0.05, vs. NC group; #: P<0.05, vs. Model.
Hydroxyproline levels in different HK-2 cell groups
Hydroxyproline levels in the Model group were significantly up-regulated compared to those of the NC group (P<0.05). In the Inhibitor group, hydroxyproline levels increased compared to those of the Model group (P<0.05). The relative data are shown in Figure 8.
Figure 8.
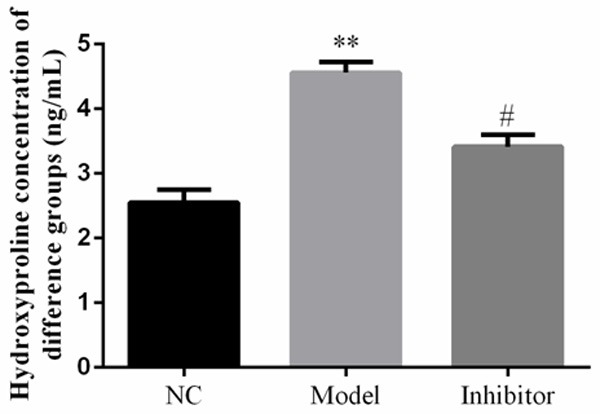
Hydroxyproline concentration in rats of different groups as determined by enzyme linked immunosorbent assay. **: P<0.05, vs. NC group; #: P<0.05, vs. Model.
EMT-related gene expression in the HK-2 cell groups
The results show that a Rho/ROCK pathway inhibitor suppressed HK-2 renal fibrosis induced by high glucose. RT-PCR assays show that E-cadherin, FSP-1, and α-SMA protein and gene expression levels in the Model group were significantly different compared to thosein the NC group (P<0.05). However, in the Inhibitor group, the E-cadherin protein and gene expression levels were significantly up-regulated, and the α-SMA and FSP-1 levels down-regulated, compared to those of the Model group (P<0.05). The relative data are shown in Figure 9.
Figure 9.
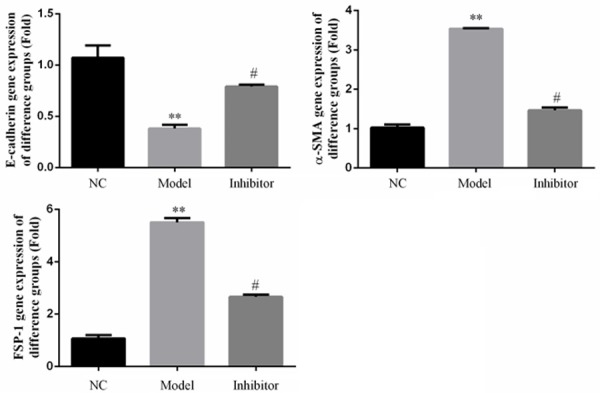
Relative gene expression in rats of different groups in vitro as determined by RT-PCR. **: P<0.05, vs. NC group; #: P<0.05, vs. Model.
EMT-related protein expression in the HK-2 cell groups
Western blotting and immunofluorescence assays showed that FSP-1 and α-SMA protein expression levels in the Model group were significantly increased and E-cadherin levels significantly reduced compared to those in the NC group (P<0.05; Figures 10 and 11, respectively). In contrast, FSP-1 and α-SMA protein expression levels in the Inhibitor group were significantly reduced and the E-cadherin levels significantly increased compared to those in the Model group (P<0.05; Figures 10 and 11, respectively).
Figure 10.
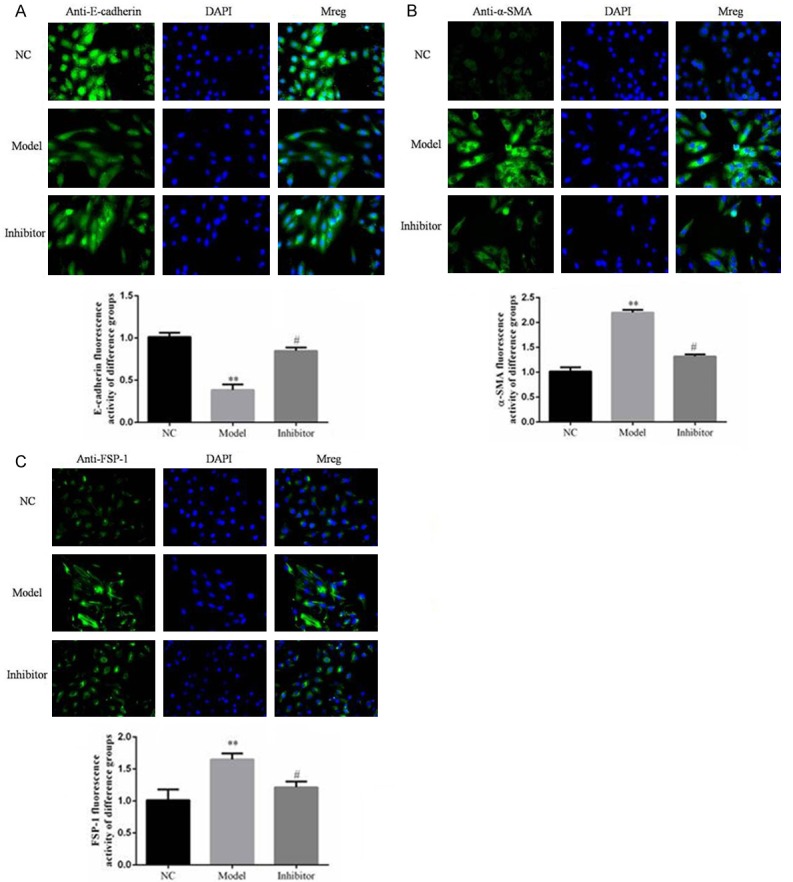
Relative protein expression in rats of different groups as determined by immunofluorescence. **: P<0.05, vs. NC group; #: P<0.05, vs. Model.
Figure 11.
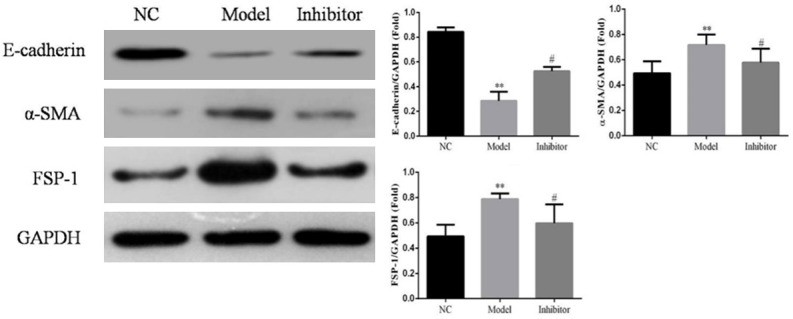
Relative protein expression in rats of different groups as determined by a Western blotting assay. **: P<0.05, vs. NC group; #: P<0.05, vs. Model.
Discussion
The WHO Diabetes Report pointed out that the incidence of adult diabetes increased from 4.7% (1980) to 8.5% (2016), and that the number of type 2 diabetes patients exceeded 400 million [11]. The incidence of diabetic kidney disease (DKD) is about 6.5% in type II patients, with 285 million patients and the resulting medical expenditure reaching more than 20 billion dollars [12,13]. Actively exploring the mechanism and potential intervention targets of type 2 diabetes-induced DKD and finding ways to prevent and delay DKD development, have become an important research target in the field of kidney disease research. Renal tubule interstitial fibrosis is an important pathological result in DKD development, and EMT is a core mechanism that leads to renal fibrosis [14]. In recent years, the importance of the Rho signaling pathway and epithelial cell transdifferentiation has been emphasized [15,16]. The RhoA/ROCK pathway is an important intracellular signaling pathway in the EMT process [17]. ROCK is activated by Rho and acts directly on the myosin light chain, increasing myosin phosphorylation in the cytoplasm, actin microfilament cytoskeleton polymerization. It also regulates the cytoskeleton, and controls cell adhesion, chemotaxis, and contraction. High levels of glucose can activate the Rho/ROCK signaling pathway, activate transcription factor AP-1, up-regulate fibronectin, and cause glomerular matrix protein accumulation in mesangial cells [18]. A ROCK inhibitor (Y27632) can block the RhoA/ROCK pathway in diabetic rats, improving glomerular permeability, renal hemodynamics, and metabolic indicators, delaying glomerular sclerosis, inhibiting the formation of reactive oxygen species, and reducing extracellular matrix protein deposition [19]. However, the effects of a Rho/Rock inhibitor on DN development remains unclear. In the present study, we investigated the effects and mechanisms of the Rho/Rock inhibitor Y27632 on DN development using EMT-related assays in vitro and in vivo.
We found that the Rho/Rock inhibitor Y27632 improved body weight reduction, serum creatinine levels, 24-h urine protein concentration, and kidney weight increase. The inhibitor also improved the pathology and renal fibrosis degree induced by type 2 diabetes in vivo and the reduced hydroxyproline levels, which is a biomarker of fibrosis in vitro. These results show that Y27632 improves renal fibrosis induced by type 2 diabetes in vitro and in vivo. Furthermore, we investigated the mechanism underlying the effects of Y27632 on renal fibrosis. Our results show that the epithelial cells of renal tubules expressed FSP-1, which is only expressed on fibroblasts after stimulation with high levels of glucose. Therefore, EMT is seen in epithelial cells of renal tubules [20]. E-cadherin, FSP-1, and α-SMA are biological markers that participate in the EMT [21-24]. In our study, both FSP-1 and α-SMA gene and protein expression levels were significantly stimulated, and E-cadherin significantly suppressed, in the Model group compared to those in the NC group, indicating that the renal fibrosis was associated with EMT induced by type 2 diabetes (high glucose). However, FSP-1 and α-SMA gene and protein expression levels were significantly down-regulated, and E-cadherin significantly up-regulated, after the Y27632 treatment. Based on these results, we conclude that the Rho/ROCK pathway might play an important role in renal fibrosis induced by type 2 diabetes (in vivo) and high glucose environment (in vitro).
In conclusion, the Rho/Rock signaling pathway is an important potential target for treatment of renal fibrosis-induced type 2 diabetes in vivo and in vitro.
Acknowledgements
This work was financially supported by the National Natural Science Foundation of China (No.81573911).
Disclosure of conflict of interest
None.
References
- 1.Al-Rubeaan K, Youssef AM, Subhani SN, Ahmad NA, Al-Sharqawi AH, Al-Mutlaq HM, David SK, AlNaqeb D. Diabetic nephropathy and its risk factors in a society with a type 2 diabetes epidemic: a sandi national diabetes registrybased study. PLoS One. 2014;9:e88956. doi: 10.1371/journal.pone.0088956. [DOI] [PMC free article] [PubMed] [Google Scholar]
- 2.Jung YJ, ParK W, Nguyen-Thanh T, Kang KP, Jin HY, Kim SH, Suh W, Kim W. COMP-angiopoietin-1 mitigates changes in lipid droplet size, macrophage infiltration of adipose tissue and renal inflammation in streptozotocin-induced diabetic mice. Oncotarget. 2017;8:94805–94818. doi: 10.18632/oncotarget.21998. [DOI] [PMC free article] [PubMed] [Google Scholar]
- 3.Monlun M, Blanco L, Alexandre L, Mohammedi K, Rigalleau V. Predictors of early renal function decline in type 1 diabetes: retinopathy. Diabet Med. 2018;35:281–283. doi: 10.1111/dme.13558. [DOI] [PubMed] [Google Scholar]
- 4.Gajos-Draus A, Duda M, Beręsewicz A. Cardiac and renal upregulation of Nox2 and NF-κB and repression of Nox4 and Nrf2 in season- and diabetes-mediated models of vascular oxidative stress in guinea-pig and rat. Physiol Rep. 2017;5:e13474. doi: 10.14814/phy2.13474. [DOI] [PMC free article] [PubMed] [Google Scholar]
- 5.Loeffler I, Liebisch M, Allert S, Kunisch E, Kinne RW, Wolf G. FSP1-specific SMAD2 knockout in renal tubular, endothelial, and interstitial cells reduces fibrosis and epithelial-to-mesenchymal transition in murine STZ-induced diabetic nephropathy. Cell Tissue Res. 2018;372:115–133. doi: 10.1007/s00441-017-2754-1. [DOI] [PubMed] [Google Scholar]
- 6.Chang YP, Sun B, Han Z, Han F, Hu SL, Li XY, Xue M, Yang Y, Chen L, Li CJ, Chen LM. Saxagliptin attenuates albuminuria by inhibiting podocyte epithelial-to-mesenchymal transition via SDF-1α in diabetic nephropathy. Front Pharmacol. 2017;8:780. doi: 10.3389/fphar.2017.00780. [DOI] [PMC free article] [PubMed] [Google Scholar]
- 7.Zhou H, Li YJ, Wang M, Zhang LH, Guo BY, Zhao ZS, Meng FL, Deng YG, Wang RY. Involvement of RhoA/ROCK in myocardial fibrosis in a rat model of type 2 diabetes. Acta Pharmacol Sin. 2011;32:999–1008. doi: 10.1038/aps.2011.54. [DOI] [PMC free article] [PubMed] [Google Scholar]
- 8.Murata T, Arii S, Nakamura T, Mori A, Kaido T, Furuyama H, Furumoto K, Nakao T, Isobe N, Imamura M. Inhibitory effect of Y-27632, a ROCK inhibitor, on progression of rat liver fibrosis in association with inactivation of hepatic stellate cells. J Hepatol. 2001;35:474–481. doi: 10.1016/s0168-8278(01)00169-6. [DOI] [PubMed] [Google Scholar]
- 9.Kolavennu V, Zeng L, Peng H, Wang Y, Danesh FR. Targeting RhoA/ROCK signaling ameliorates progression of diabetic nephropathy independent of glucose control. Diabetes. 2008;57:714–723. doi: 10.2337/db07-1241. [DOI] [PubMed] [Google Scholar]
- 10.Zhou H, Li Y. Long-term diabetic complications may be ameliorated by targeting Rho kinase. Diabetes Metab Res Rev. 2011;27:318–330. doi: 10.1002/dmrr.1182. [DOI] [PubMed] [Google Scholar]
- 11.Webster AC, Nagler EV, Morton RL, Masson P. Chronic kidney disease. Lancet. 2017;389:1238–1252. doi: 10.1016/S0140-6736(16)32064-5. [DOI] [PubMed] [Google Scholar]
- 12.Da Rocha Fernandes J, Ogurtsova K, Linnenkamp U, Guariguata L, Seuring T, Zhang P, Cavan D, Makaroff LE. IDF diabetes atlas estimates of 2014 global health expenditures on diabetes. Diabetes Res Clin Pract. 2016;117:48–54. doi: 10.1016/j.diabres.2016.04.016. [DOI] [PubMed] [Google Scholar]
- 13.Zhang L, Long J, Jiang W, Shi Y, He X, Zhou Z, Li Y, Yeung RO, Wang J, Matsushita K, Coresh J. Trends in chronic kidney disease in China. N Engl J Med. 2016;375:905–906. doi: 10.1056/NEJMc1602469. [DOI] [PubMed] [Google Scholar]
- 14.Reidy K, Kang HM, Hostetter T, Susztak K. Molecular mechanisms of diabetic kidney disease. J Clin Invest. 2014;124:2333–2340. doi: 10.1172/JCI72271. [DOI] [PMC free article] [PubMed] [Google Scholar]
- 15.Wu Q, Ouyang C, Xie L, Ling Y, Huang T. The ROCK inhibitor, thiazovivin, inhibits human corneal endothelial-to-mesenchymal transition/epithelial-to-mesenchymal transition and increases ionic transporter expression. Int J Mol Med. 2017;40:1009–1018. doi: 10.3892/ijmm.2017.3103. [DOI] [PMC free article] [PubMed] [Google Scholar]
- 16.Komiya Y, Onodera Y, Kuroiwa M, Nomimura S, Kubo Y, Nam JM, Kajiwara K, Nada S, Oneyama C, Sabe H, Okada M. The Rho guanine nucleotide exchange factor ARHGEF5 promotes tumor malignancy via epithelial-mesenchymal transition. Oncogenesis. 2016;5:e258. doi: 10.1038/oncsis.2016.59. [DOI] [PMC free article] [PubMed] [Google Scholar]
- 17.Komers R, Oyama TT, Beard DR, Tikellis C, Xu B, Lotspeich DF, Anderson S. Rho kinase inhibition protects kidneys from diabetic nephropathy without reducing blood pressure. Kidney Int. 2011;79:432–442. doi: 10.1038/ki.2010.428. [DOI] [PubMed] [Google Scholar]
- 18.Zhou L, Liu F, Huang XR, Liu F, Chen H, Chung AC, Shi J, Wei L, Lan HY, Fu P. Amelioration of albuminuria in ROCK1 knockout mice with streptozotocin-induced diabetic kidney disease. Am J Nephrol. 2011;34:468–475. doi: 10.1159/000332040. [DOI] [PMC free article] [PubMed] [Google Scholar]
- 19.Komers R. Rho kinase inhibition in diabetic kidney disease. Br J Clin Pharmacol. 2013;76:551–559. doi: 10.1111/bcp.12196. [DOI] [PMC free article] [PubMed] [Google Scholar]
- 20.Wu X, Tao P, Zhou Q, Li J, Yu Z, Wang X, Li J, Li C, Yan M, Zhu Z, Liu B. IL-6 secreted by cancerassociated fibroblasts promotes epithelialmesenchymal transition and metastasis of gastric cancer via JAK2/STAT3 signaling pathway. Oncotarget. 2017;8:20741–20750. doi: 10.18632/oncotarget.15119. [DOI] [PMC free article] [PubMed] [Google Scholar]
- 21.Wang H, Wu Q, Zhang Y, Zhang HN, Wang YB, Wang W. TGF-β1-induced epithelial-mesenchymal transition in lung cancer cells involves upregulation of miR-9 and downregulation of its target, E-cadherin. Cell Mol Biol Lett. 2017;22:22. doi: 10.1186/s11658-017-0053-1. [DOI] [PMC free article] [PubMed] [Google Scholar]
- 22.Yu Y, Lin Y, Yang G, Tian L. The interplay between TGF-β/SMAD and BMP/SMAD signaling pathways in the epithelial mesenchymal transition of A549 cells induced by silica. Toxicol Mech Methods. 2018;28:286–292. doi: 10.1080/15376516.2017.1407978. [DOI] [PubMed] [Google Scholar]
- 23.Guan S, Xu W, Han F, Gu W, Song L, Ye W, Liu Q, Guo X. Ginsenoside Rg1 attenuates cigarette smoke-induced pulmonary epithelial-mesenchymal transition via inhibition of the TGF-β1/Smad pathways. Biomed Res Int. 2017;2017:7171404. doi: 10.1155/2017/7171404. [DOI] [PMC free article] [PubMed] [Google Scholar]
- 24.Zuccarini M, Giuliani P, Buccella S, Di Liberto V, Mudò G, Belluardo N, Carluccio M, Rossini M, Condorelli DF, Rathbone MP, Caciagli F. Modulation of the TGF-β1-induced epithelial to mesenchymal transition (EMT) mediated by P1 and P2 purine receptors in MDCK cells. Purinergic Signal. 2017;13:429–442. doi: 10.1007/s11302-017-9571-6. [DOI] [PMC free article] [PubMed] [Google Scholar] [Retracted]


