Abstract
Branched-chain amino acid aminotransferase 1 (BCAT1) enzyme is an aminotransferase of glutamate and branched-chain amino acids (BCAAs), which is required for survival of various cancers. However, the role of BCAT1 in human endometrial cancer (EC) remains unknown. We analyzed the expression of BCAT1 in endometrial lesions using IHC. After BCAT1 gene knockdown and activity inhibition, cell proliferation, apoptosis, and metabolism were detected using CCK-8 assay, flow cytometry, and LC-MS/MS analysis. We analyzed molecular signature characteristics to understand how BCAT1 promotes cell proliferation. In this study, we demonstrated a significant increase in BCAT1 expression from normal endometrium to atypical endometrial hyperplasia (AEH) and then to EC, and the expression of BCAT1 in EC samples was related to tumor grade, FIGO stage and lymph node metastasis. Next, cell proliferation was markedly inhibited by lentiviral BCAT1 knockdown or Gbp treatment, but this had little effect on apoptosis rate. Further, BCAT1 knockdown resulted in 31.2% and 33.3% decreases in the amount of intracellular isoleucine and leucine produced, respectively, relative to a control. BCAT1 knockdown or activity inhibition resulted in a decrease of pS6K, a downstream target kinase of mTORC1. In conclusion, our study showed that BCAT1 is essential for EC progression and to increase EC cell proliferation through the production of BCAAs to activate the mTORC1 pathway, providing ideas for clinicians to identify metabolism-based targeted approaches for patients with EC.
Keywords: BCAT1, endometrial cancer, cellular metabolism, LC-MS/MS analysis
Introduction
Endometrial cancer (EC) is one of three malignant gynecological tumors and its incidence is increasing, bringing serious threats to women’s health [1]. Although surgery is the current standard therapeutic procedure for women who are diagnosed at an early-stage, women who present with an advanced-stage or a recurrent disease require multimodal treatment and have a poor prognosis [2,3]. Thus, new therapeutic biomarkers or target therapies are needed to further improve the overall outcome of advanced stage or recurrent endometrial cancer patients.
Reprogrammed cellular metabolism is a common feature observed in various cancers [4,5]. Branched-chain amino acid aminotransferase (BCAT, EC 2.6.1.42) enzymes are aminotransferases of glutamate and branched-chain amino acids (BCAAs). They can catalyze transamination in both directions, but the breakdown of BCAAs (namely valine, leucine and isoleucine) into its corresponding branched-chain α-ketoacids (BCKAs) and glutamate is their predominant function in most cell types [6]. While BCAT2 (mitochondrial) isoenzyme is expressed in most tissues, BCAT1 (cytosolic) isoenzyme expression is rather restricted to a small number of tissues, including brain, ovary, testis, and placenta [7-9]. In human gliomas carrying wild-type isocitrate dehydrogenase 1, BCAT1 promotes cell proliferation through amino acid catabolism [10]. In breast cancer, BCAT1 promotes cancer growth by improving mTOR-mediated mitochondrial biogenesis and function [11]. In hepatocellular carcinoma, BCAT1 promotes cell proliferation and induces chemoresistance to cisplatin [12]. However, the role of BCAT1 in human EC remains unknown.
Therefore, we detected the expression of BCAT1 in endometrial tissues, and correlated it with clinical information of EC and BCAT1 expression. Next, to better understand if the effect of BCAT1 on tumor cell proliferation, apoptosis and metabolism, we inhibited BCAT1 expression using lentivirus mediated gene knockdown and inhibited BCAT1 activity by treating EC cells with gabapentin (Gbp). In particular, we analyzed molecular signature characteristics to understand how BCAT1 induced a change in cell proliferation.
Materials and methods
Patients and specimens
Formalin fixed, paraffin embedded tissue blocks from 80 endometrial lesions patients between January 2016 and March 2018 had been previously obtained from the Pathology Department of West China Women’s and Children’s Hospital, Sichuan University. The cases studied were categorized into the following groups: 80 cases of EC, 40 cases of atypical endometrial hyperplasia (AEH), and 35 cases of normal endometrial tissue. EC stage was classified according to Federation International of Gynecology and Obstetrics staging classification (FIGO, 2014). Clinical information, including age, histological type, menopause, tumor grade, FIGO stage, myometrium invasion, lymph node metastasis, Ki-67 index and estrogen receptor, was retrieved by reviewing hospital notes. None of the patients received any pre-operative hormonal treatments, radiotherapy or chemotherapy.
Immunohistochemistry (IHC)
The immunohistochemical (IHC) reactions for BCAT1 were performed using Polink-2 plus® Polymer HRP Detection System For Rabbit Primary Antibody (PV-9001, GBI, USA), processed according to standard protocol. The 4 μm slides were cut, dewaxed in xylene, hydrated in graded alcohol and immersed in 3% hydrogen peroxide for 10 minutes to block endogenous peroxidase activity. For antigen retrieval, the sections were microwaved for 6 minutes in an ethylenediaminetetraacetic acid (EDTA) buffer. The sections were incubated with the Anti-Rabbit BCAT1/ECA39 antibody (#13640, 1:100, Proteintech, Wuhan, China) at 4°C overnight, and were then incubated with Reagent 1 and Reagent 2 according to the supplier’s guidelines. Complete reaction was revealed by 3,3’-diaminobenzidine tetrahydrocloride (DAB, #3468, Dako, Denmark) and the sections were counterstained in hematoxylin. IHC assessment was calculated according to the two-grade scoring method, which is based on the percentage of positivity and the staining intensity of the tumor cells.
Cell culture
Ishikawa and HEC-1A cells were kindly provided by the State Key Laboratory of Biotherapy. Ishikawa and HEC-1A cells were cultured in a high glucose DMEM medium (Gibco, USA) containing 10% fetal bovine serum (Biological Industries, Israel) and 1% streptomycin/penicillin (Solarbio, Beijing, China) in a humidified incubator at 37°C with 5% CO2.
Real-time reverse transcriptase quantitative polymerase chain reaction (RT-qPCR)
Total RNA was isolated from cell culture samples using a EASYspin nucleic acid purification kit (RA105, Biomed, Beijing, China) according to the manufacturer’s instructions and treated with DNase. Purity and concentration of the prepared total RNA was assessed using a NanoDrop® ND-1000 UV-Vis spectrophotometer (Thermo Fisher Scientific Inc., USA). A total of 1.0 μg of RNA was used as a template to synthesize the first strand of cDNA using the GoldenstarTM RT6 cDNA Synthesis Kit (TsingKe Biotech Co. Lid., Beijing, China). The primers were: BCAT1-F, 5’-CCCTGCTCTTTGTACTCTTGAG-3’, BCAT1-R, 5’-TGCTGACACCCATTATCTACTG-3’; β-actin-F, 5’-ACCACACCTTCTACAATGAGC-3’, β-actin-R, 5’-GATAGCACAGCCTGGATAGC-3’. Quantitative RT-PCR was performed using the Bio-Rad System (Bio-Rad Inc., USA) and TB Green Premix Ex Taq II (TaKaRa, Dalian, China). The RT-qPCR machine was programmed at 95°C for 30 seconds, 95°C for 5 seconds, 60°C for 20 seconds, and the latter 2 steps were repeated for 45 cycles. The expression level of BCAT1 was calculated using the 2-ΔΔCq method and normalized with β-actin.
Western blot analysis
The cells were lysed in a RIPA lysis buffer (P0013B, Beyotime, Jiangsu, China) and Protease Inhibitor Cocktail (HZB0815, HARVEY, USA) for 30 minutes on ice, and the lysate was centrifuged for 15 minutes at 4°C at 12,000xg. The protein concentration was determined using a BCA Protein Assay Kit (Beyotime, Jiangsu, China) according to the manufacture’s protocol. Protein samples were separated by 10% polyacrylamide gel electrophoresis-SDS (PAGE-SDS) and transferred into nitrocellulose filter membranes. The membranes were then blocked with Tris buffered saline-0.1% Tween-20 (TBS-T) containing 5% nonfat dried milk for 1 hour at room temperature. These membranes were incubated separately overnight at 4°C with the Anti-Rabbit BCAT1/ECA39 antibody (#13640, 1:1000, Proteintech, Wuhan, China), Anti-Mouse alpha Tubulin antibody (#66031, 1:5000, Proteintech, Wuhan, China), Anti-Rabbit p70S6 Kinase antibody (#14485, 1:1000, Proteintech, Wuhan, China), Anti-Rabbit phospho-p70S6 Kinase antibody (Thr389) (#9234, 1:1000, Cell Signaling Technology, Shanghai, China), Anti-Mouse GAPDH antibody (#60004, 1:10000, Proteintech, Wuhan, China), Anti-Rabbit AKT antibody (#10176, 1:1000, Proteintech, Wuhan, China) and Anti-Mouse phospho-AKT-S473 antibody (#66444, 1:2000, Proteintech, Wuhan, China). The membranes were then washed three times using TBS-T and incubated with HRP-conjugated Affinipure Goat Anti-Mouse IgG (H+L) (#SA0001, 1:5000, Proteintech, Wuhan, China) or HRP-conjugated Affinipure Goat Anti-Rabbit IgG (H+L) (#SA0001, 1:5000, Proteintech, Wuhan, China) at room temperature for 1 hour. The membranes were again washed three times with TBS-T. The reactive bands were visualized using the ChemiDoc™ MP Imaging System (Bio-Rad Laboratories Inc.).
Short Hairpin RNA (shRNA) - mediated BCAT1 knockdown in HEC-1A and Ishikawa cells
To knockdown the expression of BCAT1, shRNAs targeting BCAT1 mRNA (shBCAT1) and a non-targeting negative control shRNA (shCtrl), which are expressed with lentivirus, were purchased from GenePharma (Shanghai, China). The target sequences are: shBCAT1: 5’-GGGAGAAACCTCATATCAAGC-3’ and shCtrl: 5’-TTCTCCGAACGTGTCACGT-3’. The HEC-1A cells were seeded in six-well plates at a density of 5 × 10⁵/well overnight, while the Ishikawa cells were seeded at a density of 3 × 10⁵/well. Subsequently, the cells were transfected with shBCAT1 and shCtrl at a MOI of 50, and selected using puromycin (1 µg/ml). Quantification of knockdown was assessed using RT-qPCR and western blot analysis, as previously described.
Treatment with gabapentin (Gbp)
We prepared the drug according to the manufacturer’s protocols. After the cell culture media was removed, a medium containing 5 mM, 10 mM or 20 mM Gabapentin (S213305, Selleck, Shanghai, China) was added to the cells.
Cell counting kit-8 assay (CCK-8)
For the CCK-8 assays after BCAT1 gene knockdown, HEC-1A cells (1.2 × 10⁴) and Ishikawa cells (7 × 10³) were seeded into 96-well plates, and six replicate wells were set. Cells from each of the groups were cultured for 0, 24, 48, 72 and 96 hours. For the CCK-8 assays after BCAT1 inhibition, 2 × 10⁴ HEC-1A cells and 1 × 10⁴ Ishikawa cells per well were seeded in 96-well plates and cultured for 20 hours. Then the CCK8 reagent (Dojindo Molecular Technologies, Inc, Kumamoto, Japan) was added into each well and incubated for 2.5 hours. The optical density (OD) value at a wavelength of 450 nm was eventually measured using a microplate reader (Bio-Rad, Hercules, USA).
Flow cytometry
Apoptosis analysis was investigated after BCAT1 lentiviral knockdown. After digestion by 0.25% trypsin (without EDTA), the cells were washed and collected using PBS. The cells were resuspended in a Binding Buffer and stained with annexin V-APC and 7-aminoactinomycin D (7-AAD) (KGA1024, KeyGEN BioTECH, Nanjing, China) for 15 minutes in the dark at room temperature. Flow cytometry detected the fluorescence with an acquisition criteria of 80,000 events.
Liquid chromatography-tandem mass spectrometry (LC-MS/MS) analysis
LC analysis was performed using a 1290 Infinity LC system (Agilent, California, USA). The separation of amino acids and their derivatives was performed using a mobile phase consisting of solvent A (0.08% water, 25 mM ammonium formiate) + solvent B (0.1% acetonitrile). After injection, the sample and calibration standard were separated at a flowrate of 250 μL/min in a 40%-90% buffer B gradient within 37 minutes (0-12 minutes with 90% to 70% solvent B; 12-18 minutes with 70% to 50% solvent B; 18-25 minutes with 50% to 40% solvent B; 30-30.1 minutes with 40% to 90% solvent B; 30.1-37 minutes with 90% solvent B). Mass spectra acquisition was performed using a 5500 QTRAP mass spectrometer (AB SCIEX, USA) on positive ionization mode and MRM mode. The optimal instrumental settings are as follows: source temperature - 500°C, ion Source Gas1 (Gas1) - 40 psi, Ion Source Gas2 (Gas2) - 40 psi, Curtain gas (CUR) - 30 psi, ionSapary Voltage Floating (ISVF) - 5500 V. Peak areas and retention times were analyzed using Multiquant software.
Statistical analysis
All experiments were performed at least thrice. Categorical data were compared using a Chi-squared test. The two-tailed Student’s t-test was used for all other statistical comparisons. A p value < 0.05 was considered significant. The asterisks on all the figures stand for the following levels of significance: * - P < 0.05; ** - P < 0.01; *** - P < 0.001. All statistical analyses were performed on SPSS 24 software (SPSS Inc., Chicago, USA).
Results
BCAT1 overexpression in endometrial cancer
To investigate BCAT1 expression in the cancer progression of EC, we analyzed the expression of BCAT1 in endometrial lesions using IHC experiments. BCAT1 protein was mainly expressed in the cytoplasm (Figure 1). The expression of BCAT1 in EC was statistically higher than that of normal endometrium (P < 0.001) and AEH (P = 0.027). The expression of BCAT1 in AEH was higher than that of normal endometrial tissue, but the difference was not statistically significant (P = 0.072, Table 1). In endometrial carcinoma, the positive rate of BCAT1 expression in high grades was significantly higher than that of low-moderate grades (P = 0.026), the rate in FIGO III-IV was significantly higher than that of FIGO I-II (P = 0.005), with lymph node metastasis being significantly higher than that without (P = 0.003). However, we found no significant difference between the level of BCAT1 expression and age, histological type, menopause, infiltration depth, Ki-67 index, ER (+) or PR (+) (Table 2).
Figure 1.
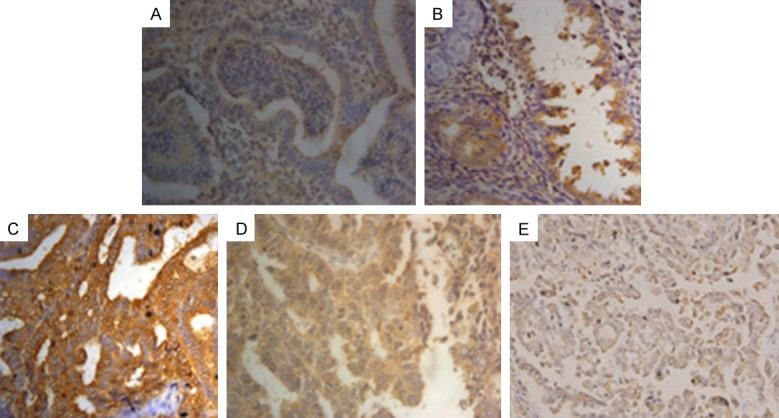
The expression of BCAT1 in endometrial lesions (magnification, x400). Positive expression of BCAT1 in (A) normal endometrial tissue, (B) atypical endometrial hyperplasia, (C) endometrioid adenocarcinoma, (D) uterine papillary serous carcinoma, (E) endometrial clear cell carcinoma.
Table 1.
BCAT1 expression in endometrial tissue
| BCAT1 | % | n | ||
|---|---|---|---|---|
|
| ||||
| - | + | |||
| Normal endometrium | 27 | 8 | 22.857% | 35 |
| AEH | 23 | 17 | 42.500% | 40 |
| EC | 29 | 51 | 63.750% | 80 |
Notice: AEH: atypical endometrial hyperplasia, EC: endometrial carcinoma.
Table 2.
Association of BCAT1 expression with clinicopathologic parameters in endometrial cancer
| Factor | n | BCAT1 expression (%) | χ2 | p |
|---|---|---|---|---|
| Age | 0.773 | 0.379 | ||
| ≤ 45 year | 27 | 70.370% (19/27) | ||
| > 45 year | 53 | 60.377% (32/53) | ||
| Menopause | 0.011 | 0.917 | ||
| No | 38 | 63.158% (24/38) | ||
| Yes | 42 | 64.286% (27/42) | ||
| Tumor grade | 4.946 | 0.026 | ||
| Low-Moderate | 42 | 52.381% (22/42) | ||
| High | 38 | 76.316% (29/38) | ||
| FIGO stage | 7.966 | 0.005 | ||
| I-II | 50 | 52.000% (26/50) | ||
| III-IV | 30 | 83.333% (25/30) | ||
| Myometrium invasion | 0.023 | 0.878 | ||
| ≤ 1/2 | 46 | 63.043% (29/46) | ||
| > 1/2 | 34 | 64.706% (22/34) | ||
| Lymph node metastasis | 8.993 | 0.003 | ||
| Negative | 52 | 51.923% (27/52) | ||
| Positive | 28 | 85.714% (24/28) | ||
| Ki index | 0.918 | 0.338 | ||
| ≥ 50 | 44 | 59.091% (26/44) | ||
| < 50 | 36 | 69.444% (25/36) | ||
| Estrogen receptor | 3.372 | 0.066 | ||
| Positive | 45 | 71.111% (32/45) | ||
| Negative | 35 | 51.351% (19/37) | ||
| Progesterone Receptor | 0.081 | 0.776 | ||
| Positive | 48 | 62.500% (30/48) | ||
| Negative | 32 | 65.625% (21/32) | ||
| Histologic Type | 0.044 | 0.978 | ||
| EA | 55 | 63.636% (35/55) | ||
| UPSC | 16 | 62.500% (10/16) | ||
| ECCC | 9 | 66.667% (6/9) |
Notice: EA: Endometrioid Adenocarcinoma, UPSC: Uterine Papillary Serous Carcinoma, ECCC: Endometrial Clear Cell Carcinoma.
BCAT1 promotes endometrial cancer cell proliferation
To understand the impact of BCAT1 loss on tumor cell proliferation, we performed BCAT1 knockdown and inhibition experiments. The results of RT-qPCR showed that lentiviral BCAT1 knockdown could efficiently decrease the BCAT1 mRNA expression level of Ishikawa cells by 99.999% and 99.999% compared with the blank and shCtrl control, respectively (P = 0.028, P = 0.006, Supplementary Figure 1A), while showing a decrease in the BCAT1 expression of HEC-1A cells by 96.940% and 97.992% relative to the blank and shCtrl controls, respectively (P = 0.003, P = 0.024, Figure 2, Supplementary Figure 1B). Consistent with these mRNA expression results, compared with the control vector, the protein expression levels of BCAT1 significantly decreased following lentiviral knockdown of BCAT1 (Supplementary Figure 2A, 2B). Using CCK-8 assays, it was found that Ishikawa and HEC-1A cell proliferative activities were significantly suppressed after BCAT1 knockdown (Figure 3A, 3B). When Ishikawa and HEC-1A cells were treated with 5 mM, 10 mM or 20 mM Gbp for 20 hours, cell proliferation was effectively inhibited compared with that of control cells treated with only a solvent, showing a dose-dependent trend (Figure 4).
Figure 2.
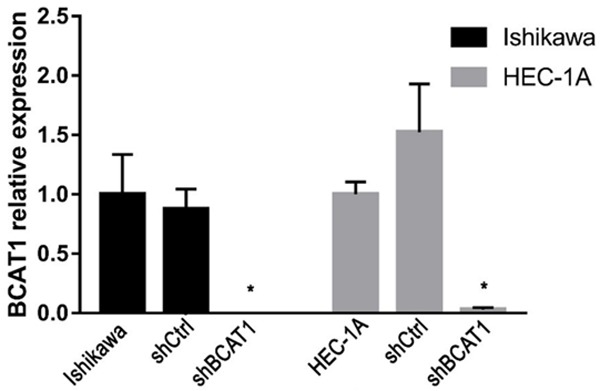
The relative expression of BCAT1 in Ishikawa and HEC-1A cells. BCAT1 expression in Ishikawa and HEC-1A cells transfected with a blank control, shCtrl and shBCAT1. The y-axis indicates the relative expression of BCAT1 in each group tested using RT-qPCR.
Figure 3.
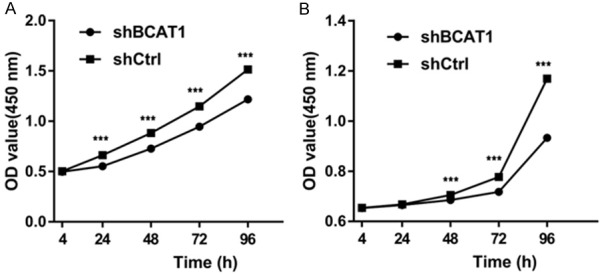
Ishikawa and HEC-1A cell proliferation as examined by CCK-8 assay. Down-modulation of BCAT1 gene expression significantly suppressed (A) Ishikawa and (B) HEC-1A cell growth.
Figure 4.
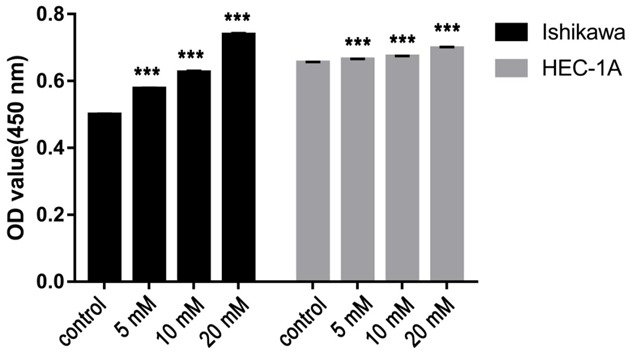
The proliferative ability of EC cells plated with indicated concentrations of Gbp (0 mM, 5 mM, 10 mM or 20 mM). The relationship between cell proliferation and concentrations of Gbp show a significant trend as the concentration of Gbp increases.
BCAT1 suppression do not induce apoptosis of EC cells
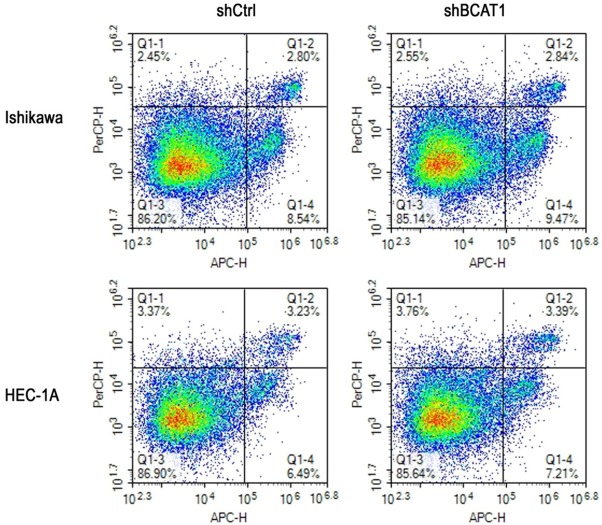
Apoptotic activity of transfected cells was detected using flow cytometry. The apoptosis rate of Ishikawa cells after BCAT1 knockdown was 16.443 ± 3.582%, which was similar with that of cells treated with a non-targeting shRNA (11.250 ± 0.412), (P = 0.301). The apoptosis rate of HEC-1A cells did not show a significant difference between the shBCAT1 group (10.347 ± 0.537) and the shCtrl group (8.373 ± 1.381), (P = 0.621, Figure 5).
Figure 5.
Inhibition of BCAT1 did not induce apoptosis of endometrial cancer cells. Flow cytometry using Annexin V-APC and 7-AAD staining demonstrated that BCAT1 silencing did not change the apoptosis rate of Ishikawa cells and HEC-1A cells compared with control groups.
BCAT1 inhibition reduces intracellular BCAA concentrations
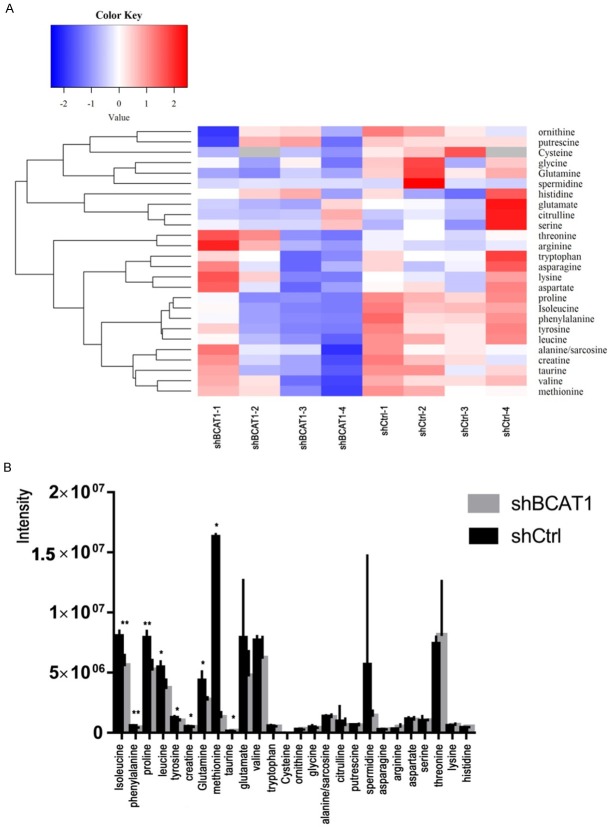
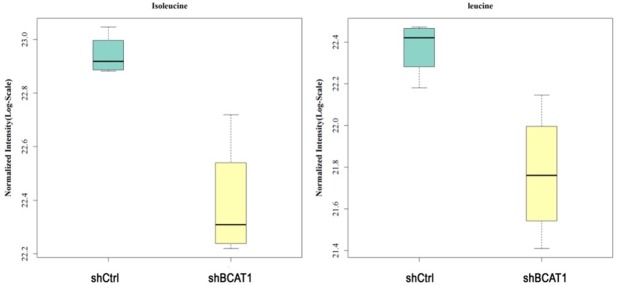
To learn how the BCAT1-driven change in the metabolism of HEC-1A cells takes place, we analyzed intracellular amino acid concentrations upon BCAT1 suppression. In total, 26 amino acids and their derivatives were quantified using LC-MS/MS analysis. HEC-1A cells transfected with shBCAT1 showed moderate but significant declines of intracellular isoleucine, leucine, phenylalanine, proline, tyrosine, creatine, glutamine, methionine, and taurine compared with cells transfected with shCtrl (Figure 6A, 6B). BCAT1 knockdown resulted in 31.210% and 33.278% decrease in the amount of intracellular isoleucine and leucine produced, respectively, relative to a control (P = 0.002, P = 0.012, Figure 7). Intracellular levels of valine in shBCAT1 cells were lower than that of shCtrl cells, but the difference was not significant (P = 0.089, Figure 8).
Figure 6.
A. Heat map showing the changes in the concentrations (Z-score) of 26 amino acids and their derivatives after BCAT1 knockdown in HEC-1A cells. B. Intracellular amino acids and their derivative levels in shCtrl cells and shBCAT1 cells.
Figure 7.
Normalized intensity of isoleucine and leucine in HEC-1A cells. The intensity of isoleucine and leucine were significantly reduced by BCAT1 knockdown.
Figure 8.
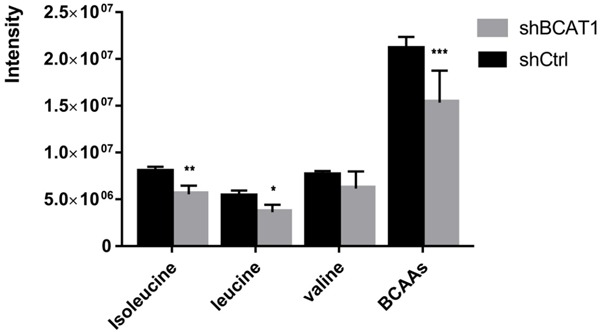
The intensity of intracellular BCAAs in HEC-1A cells. Intracellular reduction of BCAAs after BCAT1 inhibition.
BCAT1 activation of the mTORC1 pathway
To further investigate whether BCAT1 promoted cell proliferation by activating the mTORC1 signaling pathway, the expression of phosphorylation of S6 kinase (pS6K), S6K, phosphorylated AKT (pAKT) and AKT were detected using western blot. After BCAT1 knockdown, the expression of pS6K decreased in the HEC-1A cells (Figure 9A). The protein expression levels of pS6K were inhibited in the HEC-1A cells treated with 20 mM Gbp for 20 hours compared with those treated with a solvent control (Figure 9B). We found no significant changes in AKT and pAKT expression of the HEC-1A cells transfected with shBCAT1 or shCtrl (Figure 10).
Figure 9.
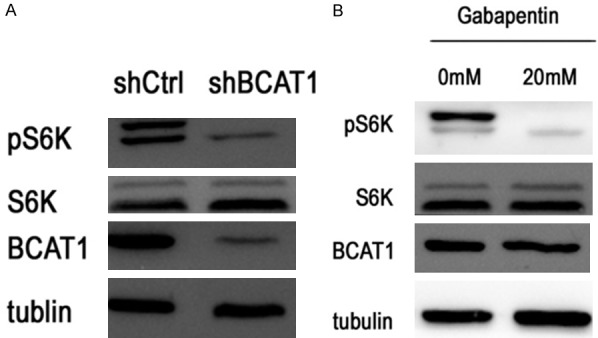
Western blotting for the proteins indicated. pS6K levels decreased after BCAT1 knockdown and treatment with 20 mM Gbp for 20 hours.
Figure 10.
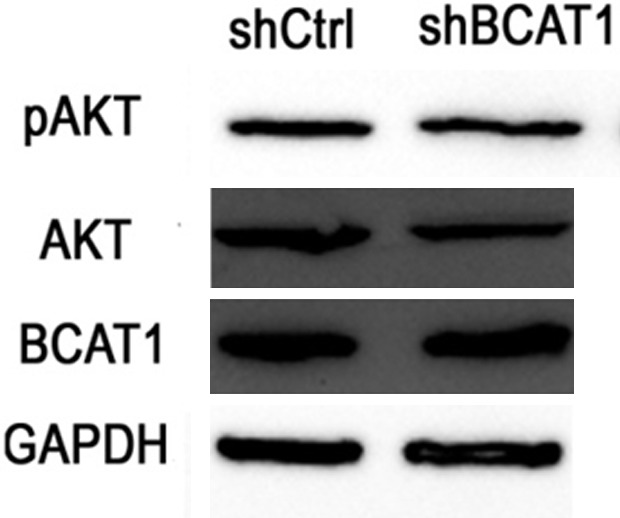
Western blotting for the proteins indicated. The expression levels of AKT and pAKT were not affected by BCAT1 knockdown.
Discussion
In this study, we demonstrated a significant increase in BCAT1 expression from normal endometrium to AEH and finally to EC. Next, we revealed that BCAT1 inhibition impaired cell proliferation, and decreased intracellular BCAAs levels, but had little, if any, effect on the apoptosis rate of EC cells, compared with the controls. BCAT1 promoted cell proliferation which may activate the mTORC1 pathway.
To understand the contribution of BCAT1 to human EC, we looked at endometrial lesion samples of normal endometrial tissue to EC, and found that BCAT1 expression was higher in EC than in either normal endometrial or AEH tissue. The expression of BCAT1 in EC samples was also related to tumor grade, FIGO stage and lymph node metastasis. These results were consistent with previous reports that BCAT1 is strongly overexpressed in ovarian tumors [13] and that BCAT1 is a novel distant metastasis-related biomarker of colorectal cancer [14]. These results confirm that the activation of BCAT1 is a characteristic feature of the progression of human EC.
We used a shRNA-mediated gene knockdown approach to knockdown BCAT1, and found that BCAT1 was expressed less in shBCAT1 cells than in shCtrl cells at both mRNA and protein levels. BCAT1 knockdown resulted in significantly impaired cell proliferation ability relative to the controls. Gbp is a structural analogue of leucine that specifically inhibits BCAT1 but not BCAT2 [15,16]. We found that EC cells plated with Gbp developed lower cell proliferation ability and showed a dose-dependent impairment of cell proliferation. Tönjes et al. have shown that BCAT1 promotes cell proliferation in gliomas carrying wild-type IDH1 through amino acid catabolism [10]. Xu et al. reported that BCAT1 promotes tumor cell proliferation in hepatocellular carcinoma [12,17]. Previous studies have also shown that BCAT1 sustains the growth of antiestrogen-resistant and ERα-negative breast cancer [18]. These findings demonstrate that BCAT1 is critical for EC cell growth.
Next, we examined whether BCAT1 loss affects the apoptosis of EC cells via flow cytometry. We did not observe increased apoptosis or inhibition of EC cells as a result of BCAT1 knockdown, which is consistent with the finding that the rate of apoptosis was only minimally affected by BCAT1 knockdown in myeloid leukaemia [19]. These studies suggest the role of BCAT1 in the pathogenesis of EC is through specific enhanced cell proliferation and not through the secondary effects of apoptosis.
Given that BCAT1 was highly expressed in EC tissues and promoted EC cell proliferation, we wanted to know the precise mechanisms of BCAT1 that contribute to EC. In order to understand the contribution of BCAT1 to the metabolism of EC, intracellular amino acid levels were quantified using LC-MS/MS analysis, and we found that two BCAAs were significantly reduced by shBCAT1 relative to the controls. These results indicate transamination from BCKAs to BCAAs by BCAT1 in EC cells. Interestingly, the metabolic role of BCAT1 is distinct and determined by the tissue of origin. BCAT1 catalyzes BCAA breakdown and glutamate production to enhance tumor growth in glioblastoma [10], whereas it promotes BCAA production in leukemia [19]. Despite the same initiation events of KRAS activation and TP53 deletion, non-small cell lung carcinoma cells utilize BCAA breakdown to BCKAs, whereas pancreatic ductal adenocarcinoma cells display little dependency on BCAAs [20]. These findings indicate that BCKA transamination contributes to the BCAA pool of EC cells through BCAT1 activity.
BCAAs, particularly leucine, activate the mTORC1 pathway via cytosolic leucine sensor proteins, which integrate multiple signals from nutrient sensing and growth factor stimuli to promote cell growth [21-23]. Thus, we examined whether BCAT1 inhibition would attenuate the mTORC1 signal. Indeed, lentiviral BCAT1 knockdown or Gbp treatment decreased pS6K, a downstream target kinase of mTORC1. But the levels of AKT and pAKT did not show an apparent change, demonstrating that a primary contribution of BCAA was to activate the mTORC1 pathway. These results suggest that reductions of BCAAs by BCAT1 knockdown repressed mTORC1 signaling.
In conclusion, this study shows that BCAT1 is essential for EC progression and to increase EC cell proliferation by producing BCAAs to activate the mTORC1 pathway, suggesting a way to identify metabolism-based targeted approaches for patients with EC.
Acknowledgements
This study was supported by the Support Program of Science & Technology Department of Sichuan Province (No. 2011FZ0020), Support Program of Science & Technology Department of Sichuan Province (No. 2018SZ0145), and Support Program of Health Commission of Sichuan Province (No. 17PJ128).
Disclosure of conflict of interest
None.
Supporting Information
References
- 1.Tran AQ, Gehrig P. Recent advances in endometrial cancer. F1000Res. 2017;6:81. doi: 10.12688/f1000research.10020.1. [DOI] [PMC free article] [PubMed] [Google Scholar]
- 2.Arend RC, Jones BA, Martinez A, Goodfellow P. Endometrial cancer: molecular markers and management of advanced stage disease. Gynecol Oncol. 2018;150:569–580. doi: 10.1016/j.ygyno.2018.05.015. [DOI] [PubMed] [Google Scholar]
- 3.Matias-Guiu X, Prat J. Molecular pathology of endometrial carcinoma. Histopathology. 2013;62:111–123. doi: 10.1111/his.12053. [DOI] [PubMed] [Google Scholar]
- 4.Vander Heiden MG. Targeting cancer metabolism: a therapeutic window opens. Nat Rev Drug Discov. 2011;10:671–684. doi: 10.1038/nrd3504. [DOI] [PubMed] [Google Scholar]
- 5.DeBerardinis RJ, Thompson CB. Cellular metabolism and disease: what do metabolic outliers teach us? Cell. 2012;148:1132–1144. doi: 10.1016/j.cell.2012.02.032. [DOI] [PMC free article] [PubMed] [Google Scholar]
- 6.Hutson SM, Sweatt AJ, Lanoue KF. Branched-chain amino acid metabolism: implications for establishing safe intakes. J Nutr. 2005;135:1557s–1564s. doi: 10.1093/jn/135.6.1557S. [DOI] [PubMed] [Google Scholar]
- 7.Garcia-Espinosa MA, Wallin R, Hutson SM, Sweatt AJ. Widespread neuronal expression of branched-chain aminotransferase in the CNS: implications for leucine/glutamate metabolism and for signaling by amino acids. J Neurochem. 2007;100:1458–1468. doi: 10.1111/j.1471-4159.2006.04332.x. [DOI] [PubMed] [Google Scholar]
- 8.Hall TR, Wallin R, Reinhart GD, Hutson SM. Branched chain aminotransferase isoenzymes. Purification and characterization of the rat brain isoenzyme. J Biol Chem. 1993;268:3092–3098. [PubMed] [Google Scholar]
- 9.Sweatt AJ, Wood M, Suryawan A, Wallin R, Willingham MC, Hutson SM. Branched-chain amino acid catabolism: unique segregation of pathway enzymes in organ systems and peripheral nerves. Am J Physiol Endocrinol Metab. 2004;286:E64–76. doi: 10.1152/ajpendo.00276.2003. [DOI] [PubMed] [Google Scholar]
- 10.Tonjes M, Barbus S, Park YJ, Wang W, Schlotter M, Lindroth AM, Pleier SV, Bai AHC, Karra D, Piro RM, Felsberg J, Addington A, Lemke D, Weibrecht I, Hovestadt V, Rolli CG, Campos B, Turcan S, Sturm D, Witt H, Chan TA, Herold-Mende C, Kemkemer R, Konig R, Schmidt K, Hull WE, Pfister SM, Jugold M, Hutson SM, Plass C, Okun JG, Reifenberger G, Lichter P, Radlwimmer B. BCAT1 promotes cell proliferation through amino acid catabolism in gliomas carrying wild-type IDH1. Nat Med. 2013;19:901–908. doi: 10.1038/nm.3217. [DOI] [PMC free article] [PubMed] [Google Scholar]
- 11.Zhang L, Han J. Branched-chain amino acid transaminase 1 (BCAT1) promotes the growth of breast cancer cells through improving mTOR-mediated mitochondrial biogenesis and function. Biochem Biophys Res Commun. 2017;486:224–231. doi: 10.1016/j.bbrc.2017.02.101. [DOI] [PubMed] [Google Scholar]
- 12.Zheng YH, Hu WJ, Chen BC, Grahn TH, Zhao YR, Bao HL, Zhu YF, Zhang QY. BCAT1, a key prognostic predictor of hepatocellular carcinoma, promotes cell proliferation and induces chemoresistance to cisplatin. Liver Int. 2016;36:1836–1847. doi: 10.1111/liv.13178. [DOI] [PubMed] [Google Scholar]
- 13.Wang ZQ, Faddaoui A, Bachvarova M, Plante M, Gregoire J, Renaud MC, Sebastianelli A, Guillemette C, Gobeil S, Macdonald E, Vanderhyden B, Bachvarov D. BCAT1 expression associates with ovarian cancer progression: possible implications in altered disease metabolism. Oncotarget. 2015;6:31522–31543. doi: 10.18632/oncotarget.5159. [DOI] [PMC free article] [PubMed] [Google Scholar]
- 14.Yoshikawa R, Yanagi H, Shen CS, Fujiwara Y, Noda M, Yagyu T, Gega M, Oshima T, Yamamura T, Okamura H, Nakano Y, Morinaga T, Hashimoto-Tamaoki T. ECA39 is a novel distant metastasis-related biomarker in colorectal cancer. World J Gastroenterol. 2006;12:5884–5889. doi: 10.3748/wjg.v12.i36.5884. [DOI] [PMC free article] [PubMed] [Google Scholar]
- 15.Goto M, Miyahara I, Hirotsu K, Conway M, Yennawar N, Islam MM, Hutson SM. Structural determinants for branched-chain aminotransferase isozyme-specific inhibition by the anticonvulsant drug gabapentin. J Biol Chem. 2005;280:37246–37256. doi: 10.1074/jbc.M506486200. [DOI] [PubMed] [Google Scholar]
- 16.Hutson SM, Berkich D, Drown P, Xu B, Aschner M, LaNoue KF. Role of branched-chain aminotransferase isoenzymes and gabapentin in neurotransmitter metabolism. J Neurochem. 1998;71:863–874. doi: 10.1046/j.1471-4159.1998.71020863.x. [DOI] [PubMed] [Google Scholar]
- 17.Xu M, Liu Q, Jia Y, Tu K, Yao Y, Liu Q, Guo C. BCAT1 promotes tumor cell migration and invasion in hepatocellular carcinoma. Oncol Lett. 2016;12:2648–2656. doi: 10.3892/ol.2016.4969. [DOI] [PMC free article] [PubMed] [Google Scholar]
- 18.Thewes V, Simon R, Hlevnjak M, Schlotter M, Schroeter P, Schmidt K, Wu Y, Anzeneder T, Wang W, Windisch P, Kirchgassner M, Melling N, Kneisel N, Buttner R, Deuschle U, Sinn HP, Schneeweiss A, Heck S, Kaulfuss S, Hess-Stumpp H, Okun JG, Sauter G, Lykkesfeldt AE, Zapatka M, Radlwimmer B, Lichter P, Tonjes M. The branched-chain amino acid transaminase 1 sustains growth of antiestrogen-resistant and ERalpha-negative breast cancer. Oncogene. 2017;36:4124–4134. doi: 10.1038/onc.2017.32. [DOI] [PubMed] [Google Scholar]
- 19.Hattori A, Tsunoda M, Konuma T, Kobayashi M, Nagy T, Glushka J, Tayyari F, McSkimming D, Kannan N, Tojo A, Edison AS, Ito T. Cancer progression by reprogrammed BCAA metabolism in myeloid leukaemia. Nature. 2017;545:500–504. doi: 10.1038/nature22314. [DOI] [PMC free article] [PubMed] [Google Scholar]
- 20.Mayers JR, Torrence ME, Danai LV, Papagiannakopoulos T, Davidson SM, Bauer MR, Lau AN, Ji BW, Dixit PD, Hosios AM, Muir A, Chin CR, Freinkman E, Jacks T, Wolpin BM, Vitkup D, Vander Heiden MG. Tissue of origin dictates branched-chain amino acid metabolism in mutant Kras-driven cancers. Science. 2016;353:1161–1165. doi: 10.1126/science.aaf5171. [DOI] [PMC free article] [PubMed] [Google Scholar]
- 21.Wolfson RL, Chantranupong L, Saxton RA, Shen K, Scaria SM, Cantor JR, Sabatini DM. Sestrin2 is a leucine sensor for the mTORC1 pathway. Science. 2016;351:43–49. doi: 10.1126/science.aab2674. [DOI] [PMC free article] [PubMed] [Google Scholar]
- 22.Lee M, Kim JH, Yoon I, Lee C, Fallahi Sichani M, Kang JS, Kang J, Guo M, Lee KY, Han G, Kim S, Han JM. Coordination of the leucine-sensing Rag GTPase cycle by leucyl-tRNA synthetase in the mTORC1 signaling pathway. Proc Natl Acad Sci U S A. 2018;115:E5279–E5288. doi: 10.1073/pnas.1801287115. [DOI] [PMC free article] [PubMed] [Google Scholar]
- 23.Jewell JL, Russell RC, Guan KL. Amino acid signalling upstream of mTOR. Nat Rev Mol Cell Biol. 2013;14:133–139. doi: 10.1038/nrm3522. [DOI] [PMC free article] [PubMed] [Google Scholar]
Associated Data
This section collects any data citations, data availability statements, or supplementary materials included in this article.


