Abstract
Introduction
The aim of the study was to analyze breast cancer (BC) mortality trends among women at the age of 45 years old and older (45+) in the 28 European Union (EU) countries, as well as in 3 non-EU countries – Norway, Switzerland and the Russian Federation (control group) within the period 1959–2017.
Material and methods
Mortality and population data were sourced from the World Health Organization (WHO) database, and age-standardized mortality rates were calculated using the standard world population. Changes in mortality trends were analyzed using Joinpoint Trend Analysis Software.
Results
The majority of analyzed countries showed a meaningful decrease in BC mortality among women aged 45+. However, the results of our study suggest that there are 4 EU countries – Croatia, Poland, Romania and Slovakia – where increasing BC mortality trends started to be visible in the analyzed age group. Currently, the observed increase is still not significant, but the obtained data suggest the possibility of further continuation of the observed trend in the future. Moreover, in Bulgaria we also noted continuation of the increase in BC mortality (statistically significant).
Conclusions
Due to the availability of better treatment options, as well as presence of effective tools for detecting BC at the early stages of progression, BC mortality is falling in most analyzed European countries. To maintain this situation and to stop BC mortality increase in the analyzed age group in Bulgaria, Croatia, Poland, Romania and Slovakia, immediate actions for improvement of BC management in the European health care systems should be considered.
Keywords: breast cancer, screening, European Union, mortality, mammography, Europe
Introduction
Breast cancer is the most common malignant cancer among women in European countries [1]. Many factors, such as age, overweight and obesity, lack of physical activity, alcohol consumption, genetic mutations and prolonged hormonal replacement therapy (HRT) use may contribute to development of this disease [2].
While breast cancer incidence in European countries shows an increasing tendency, mortality trends vary. Within the time period 1989–2006 a decrease in breast cancer mortality in 15 European countries was observed (about 20% drop). However, at the same time breast cancer mortality trends were stable or increasing in central Europe [3]. Considering solely the European Union (EU) countries, breast cancer mortality rates decreased from 17.9/100,000 in 2002 to 15.2/100,000 in 2012 (world standard). The largest fall was observed in the younger age groups – women aged 20–49 years – about 22% decrease in mortality. In accordance with the epidemiological prognosis by Carioli et al., breast cancer mortality will continuously decline and in 2020 is going to reach the level of 13.4/100,000 in EU countries [4].
The World Health Organization (WHO) indicates that one of the most efficient tools affecting breast cancer mortality is screening programs with mammography use. WHO estimates that efficient screening may lead to a reduction in breast cancer mortality among women aged around 50 years old of at least about 20% [3]. Moreover, there are also evidence that mammography may affect the advanced breast cancer rates and contributes to the lower number of advanced cases [5]. On the other hand, there are estimates that about 1–10% of all diagnosed (mammography) breast cancer cases in European countries could be considered as overdiagnosis [6, 7]. Additionally, in 2013 in Switzerland, the Swiss Medical Board (leading Swiss Centre of Competence in Health Technology Assessment) concluded that mammography is not cost effective, and does not result in benefits in quality-adjusted life-years gained [7].
Regardless of these facts, women in perimenopausal and postmenopausal age are the most prone to breast cancer [2, 8, 9] and special efforts should be made in order to limit breast cancer incidence and mortality in this specific group.
The aim of our study was to analyze changes in breast cancer mortality trends among women in the 28 European Union countries, as well as in 3 non-EU countries: Norway, Switzerland and the Russian Federation (control group) in the most prone age group – women aged 45 years old and older.
Material and methods
Material in our study was epidemiological data on breast cancer for all available time periods – from 1959 to 2017. Mortality and population data were sourced from the World Health Organization data sets [10]. Four different revisions of the International Classification of Diseases (ICD) were used for the considered years. In our study we analyzed breast cancer deaths defined as number 170 in ICD-7, number 174 in ICD-8 and ICD-9, and the code C50 in ICD-10 Revision.
Age-standardized mortality rates were calculated using the direct method using the standard world population. Changes in mortality trends were analyzed using Joinpoint Trend Analysis Software version 4.3.1.0 [11] (up to four joinpoints were determined). Annual percent changes (APC) were calculated for all identified trends in each analyzed country.
Statistical analysis
The statistical significance level was set at α = 0.05.
Limitations of the study
Availability of the epidemiological data for each country is different, in some cases very limited. Not all of the data are available for all of the years in the analyzed period (1959–2017) – specific years for each country are defined in Table I. Using analyzed mortality data, it should also be mentioned that there are some factors which may contribute to bias, especially for the data from the beginning of the analyzed period (for example differences in medical certification of the causes of death and in the coding process or completeness of death certifications). Additionally, in our analysis there are countries with small population sizes, for example Luxembourg, Cyprus or Malta, where greater caution in the inference is recommended.
Table I.
Joinpoint analysis for breast cancer mortality among women aged 45+ in the years 1959–2017 in EU28 and 3 selected non-EU countries
| Country | Trend 1 | Trend 2 | Trend 3 | Trend 4 | Trend 5 | ||||||||||
|---|---|---|---|---|---|---|---|---|---|---|---|---|---|---|---|
| Years | APC | 95% CI | Years | APC | 95% CI | Years | APC | 95% CI | Years | APC | 95% CI | Years | APC | 95% CI | |
| Austria | 1959–1974 | 1.8* | 1.4;2.1 | 1974–1978 | –1.1 | –5.0;3.0 | 1978–1990 | 1.6* | 1.0;2.1 | 1990–2017 | –2.0* | –2.0;–1.9 | |||
| Belgium | 1959–1986 | 1.1* | 0.9;1.2 | 1986–1996 | –0.4 | –1.2;0.3 | 1996–2015 | –2.2* | –2.4;–1.9 | ||||||
| Bulgaria | 1964–1985 | 2.7* | 2.3;3.2 | 1985–2014 | 0.3* | 0.0;0.5 | |||||||||
| Croatia | 1985–2000 | 2.2* | 1.8;2.6 | 2000–2003 | –5.9 | –14.3;3.3 | 2003–2016 | 0.3 | –0.2;0.7 | ||||||
| Cyprus | 2004–2016 | –1.1 | –2.2;0.1 | ||||||||||||
| Czech Rep. | 1986–1994 | 0.2 | –0.7;1.1 | 1994–2005 | –1.4* | –2.1;–0.8 | 2005–2008 | –7.7 | –15.1;0.4 | 2008–2016 | –1.7* | –2.6;–0.8 | |||
| Denmark | 1959–1997 | 0.4* | 0.3;0.5 | 1997–2015 | –3.0* | –3.4;–2.7 | |||||||||
| Estonia | 1981–1999 | 2.1* | 1.4;2.8 | 1999–2016 | –1.9* | –2.6;–1.2 | |||||||||
| Finland | 1959–1993 | 0.8* | 0.6;1.0 | 1993–2015 | –1.3* | –1.6;–1.0 | |||||||||
| France | 1959–1966 | 1.5* | 0.8;2.2 | 1966–1990 | 0.7* | 0.5;0.8 | 1990–1999 | –0.3 | –0.9;0.2 | 1999–2015 | –1.6* | –1.8;–1.4 | |||
| Germany | 1973–1992 | 1.0* | 0.9;1.2 | 1992–2015 | –1.6* | –1.7;–1.5 | |||||||||
| Greece | 1961–1963 | 21.9* | 6.9;39.1 | 1963–1980 | 4.3* | 3.7;4.8 | 1980–1995 | 0.8* | 0.2;1.5 | 1995–2015 | –0.6* | –1.0;–0.3 | |||
| Hungary | 1959–1976 | 3.0* | 2.7;3.4 | 1976–1999 | 1.0* | 0.8;1.2 | 1999–2007 | –3.1* | –4.4;–1.9 | 2007–2016 | –0.5 | –1.4;0.4 | |||
| Ireland | 1959–1975 | 1.9* | 1.3;2.5 | 1975–1992 | 0.6 | –0.0;1.1 | 1992–2015 | –1.9* | –2.2;–1.6 | ||||||
| Italy | 1959–1970 | 2.0* | 1.7;2.3 | 1970–1990 | 1.0* | 0.9;1.2 | 1990–2015 | –1.5* | –1.6;–1.4 | ||||||
| Latvia | 1980–1993 | 2.1* | 1.4;2.9 | 1993–2009 | 0.4 | –0.2;1.0 | 2009–2015 | –1.6 | –4.0;0.8 | ||||||
| Lithuania | 1981–1995 | 2.6* | 1.8;3.3 | 1995–2010 | –0.5 | –1.2;0.2 | 2010–2017 | –3.3* | –5.3;–1.2 | ||||||
| Luxembourg | 1967–1985 | 1.4* | 0.1;2.8 | 1985–2015 | –1.9* | –2.5;–1.3 | |||||||||
| Malta | 1965–1993 | 1.3* | 0.6;2.0 | 1993–2015 | –3.4* | –4.3;–2.5 | |||||||||
| Netherlands | 1959–1967 | 1.4* | 0.6;2.1 | 1967–1995 | 0.0 | –0.1;0.1 | 1995–2016 | –2.3* | –2.5;–2.2 | ||||||
| Poland | 1959–1964 | 15.1* | 13.6;16.6 | 1964–1981 | 2.2* | 1.9;2.4 | 1981–1995 | 0.6* | 0.3;0.9 | 1995–2011 | –0.5* | –0.8;–0.3 | 2011–2016 | 1.1 | –0.2;2.5 |
| Portugal | 1959–1992 | 1.4* | 1.3;1.6 | 1992–2016 | –1.4* | –1.7;–1.2 | |||||||||
| Romania | 1969–1988 | 2.1* | 1.9;2.3 | 1988–2003 | 1.3* | 0.9;1.6 | 2003–2012 | –0.9* | –1.7;–0.1 | 2012–2016 | 1.5 | –0.8;3.8 | |||
| Slovakia | 1992–2000 | 2.0* | 0.5;3.4 | 2000–2006 | –3.5* | –6.2;–0.6 | 2006–2014 | 1.1 | –0.3;2.5 | ||||||
| Slovenia | 1971–1993 | 1.6* | 1.2;2.0 | 1993–2015 | –1.9* | –2.3;–1.5 | |||||||||
| Spain | 1959–1961 | 12.6* | 2.8;23.4 | 1961–1992 | 2.4* | 2.3;2.6 | 1992–2016 | –2.0* | –2.2;–1.8 | ||||||
| Sweden | 1959–1975 | 0.2 | –0.2;0.5 | 1975–2005 | –0.8* | –1.0;–0.7 | 2005–2016 | –2.5* | –3.1;–1.8 | ||||||
| UK | 1959–1986 | 0.9* | 0.8;1.0 | 1986–1991 | –0.9 | –2.0;0.2 | 1991–1997 | –3.1* | –3.9;–2.3 | 1997–2015 | –2.3* | –2.4;–2.2 | |||
| Non EU countries: | |||||||||||||||
| Norway | 1959–1995 | 0.3* | 0.2;0.4 | 1995–2016 | –2.6* | –2.9;–2.2 | |||||||||
| Russian Fed. | 1980–1994 | 3.2* | 3.0;3.3 | 1994–2000 | 2.0* | 1.2;2.8 | 2000–2009 | 0.1 | –0.3;0.5 | 2009–2013 | –2.2* | –3.2;–1.1 | |||
| Switzerland | 1959–1985 | 0.6* | 0.4;0.7 | 1985–1993 | –0.7 | –1.9;0.5 | 1993–1998 | –4.8* | –7.4;–2.1 | 1998–2015 | –1.7* | –2.0;–1.4 | |||
The annual percent change (APC) is significantly different from zero at α = 0.05.
Results
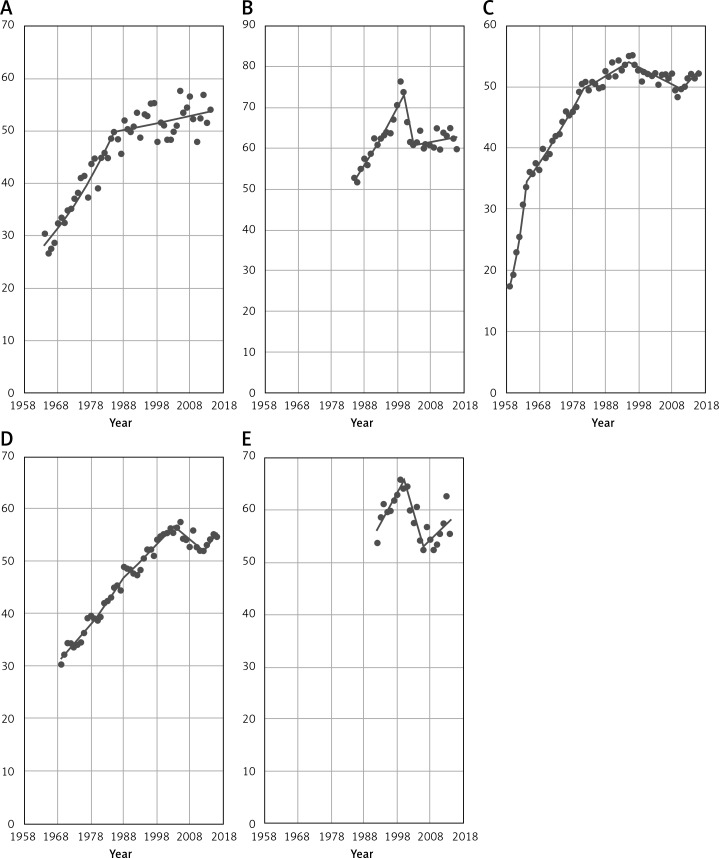
Figure 1 gives an overview of the breast cancer mortality time trends among women aged 45+ in the five following European countries: Bulgaria, Croatia, Poland, Romania and Slovakia. In four countries (excluding Bulgaria) we investigated the beginning of increase in the breast cancer mortality after the period of decrease. Observed trends are still statistically not significant for each country, but the obtained data suggest that in the next years the increasing tendency will continue.
Figure 1.
EU countries (A – Bulgaria, B – Croatia, C – Poland, D – Romania, E – Slovakia) with increase in breast cancer mortality among women aged 45+
During the analyzed period, in Bulgaria we observed a permanent increase in breast cancer mortality with a slowdown in 1985 (Table I). In Croatia, breast cancer mortality reached a peak in 2000 and after this year mortality rates in the analyzed age group were decreasing. Since 2003 we have observed the start of an increase in the breast cancer mortality in the considered country. In Poland, in the analyzed period, breast cancer mortality among women 45+ was constantly increasing until 1995 – when it reached the highest point. After this year, mortality in Poland started to decrease until 2011. Since 2012 an increasing mortality trend has started to be visible. Romania presents a stable increase in breast cancer mortality until 2003, when the highest point occurred. After that year mortality started to decrease up to 2012 and since 2013 we have noted a mortality increase. The last country from the considered group is Slovakia. Breast cancer mortality in this country increased until 2000. After this year, a decreasing trend started and it lasted until 2006. Since 2007 an increasing trend has been visible.
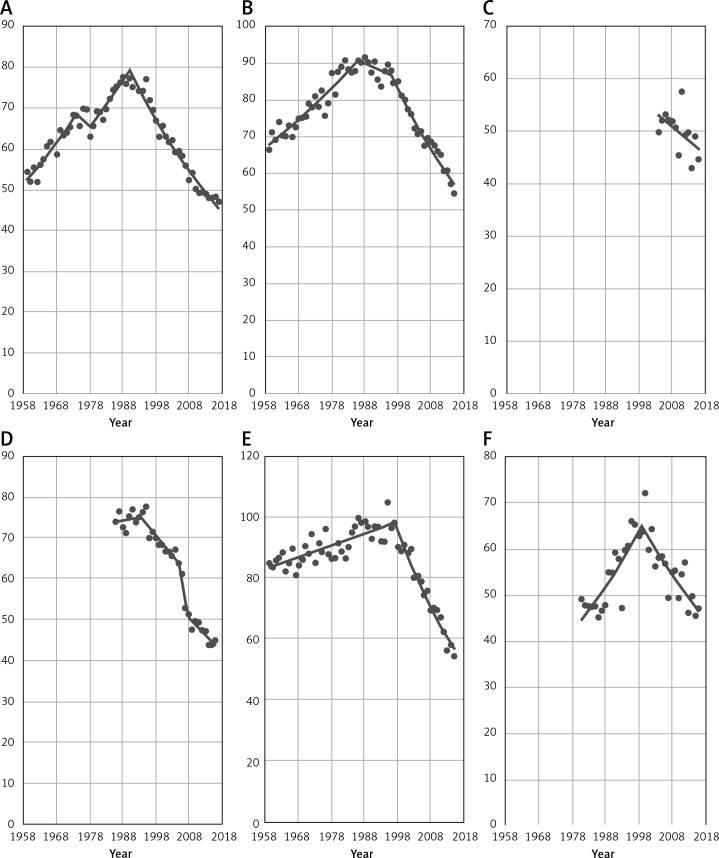
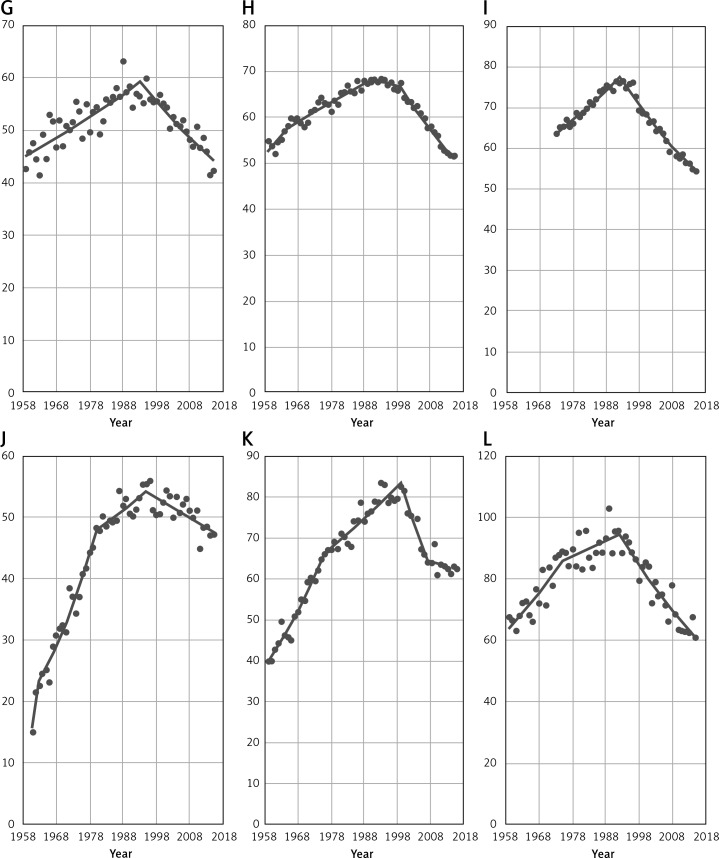
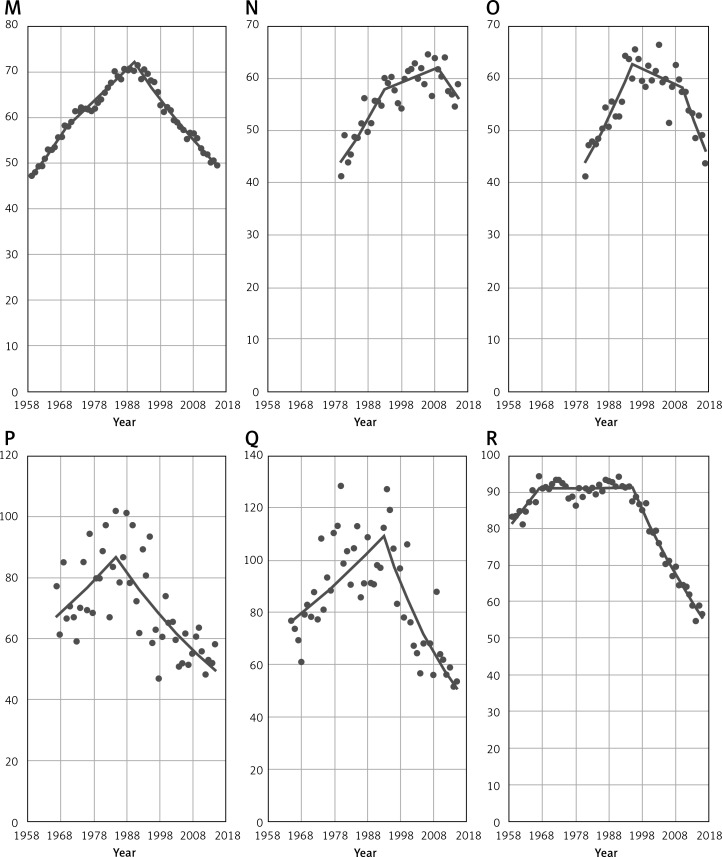
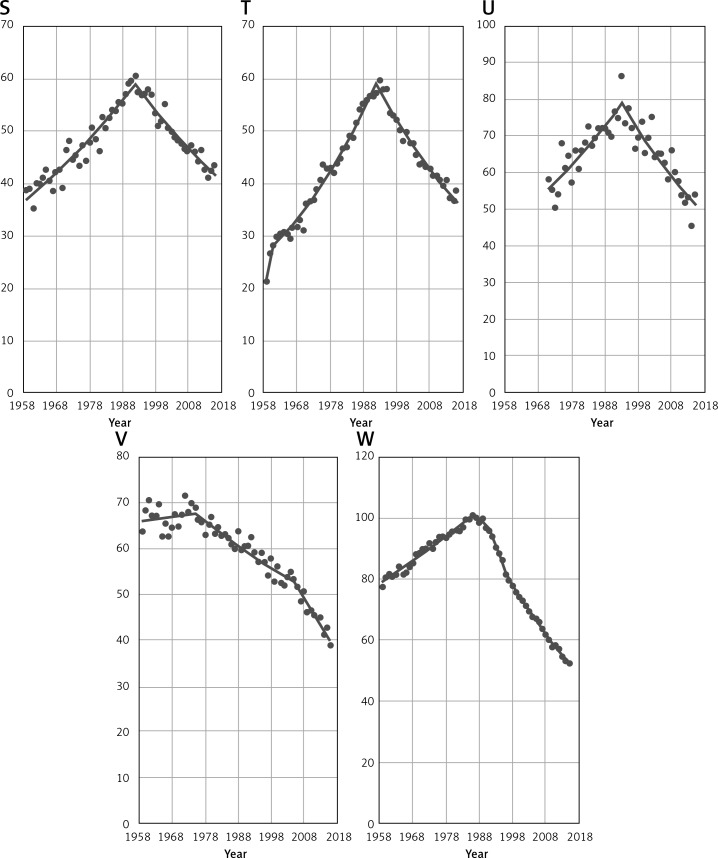
Figure 2 shows time trends in breast cancer mortality among women aged 45+ in the remaining 23 EU countries in the analyzed period. In a great majority of considered countries a decrease was observed in the 1990s. In some cases, a significant decreasing trend occurred earlier – in Sweden in 1975 or in Luxembourg in 1985. Countries such as Belgium and the United Kingdom (UK) have also noted a decrease in breast cancer mortality before the 1990s, but the observed trends were not significant. Only in Latvia did a decrease occur after the 2000s. Due to unavailability of epidemiological data, the mortality trend for Cyprus before 2004 is unknown, but since that year a mortality decrease has been visible.
Figure 2.
EU countries (A – Austria, B – Belgium, C – Cyprus, D – Czech Republic, E – Denmark, F – Estonia) with decrease in breast cancer mortality among women aged 45+. EU countries (G – Finland, H – France, I – Germany, J – Greece, K – Hungary, L – Ireland) with decrease in breast cancer mortality among women aged 45+. EU countries (M – Italy, N – Latvia, O – Lithuania, P – Luxembourg, Q – Malta, R – The Netherlands) with decrease in breast cancer mortality among women aged 45+. EU countries (S – Portugal, T – Spain, U – Slovenia, V – Sweden, W – UK) with decrease in breast cancer mortality among women aged 45+
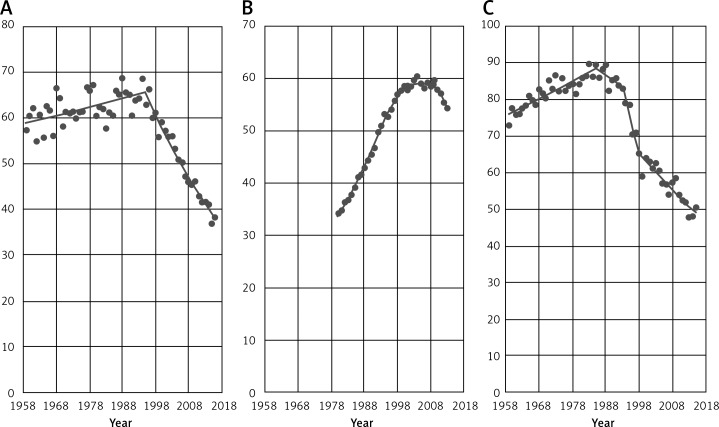
Figure 3 gives breast cancer mortality time trends among women aged 45+ in selected non-EU countries. In all analyzed countries (Norway, Russian Federation and Switzerland) a decrease in breast cancer mortality has been noted. Similarly to EU countries, a statistically significant mortality decrease took place in the 1990s, in the case of Norway in 1995 and Switzerland in 1993. In the Russian Federation, a significant mortality drop occurred in 2009.
Figure 3.
Breast cancer mortality among women aged 45+ in selected non-EU countries (A – Norway, B – Russian Federation, C – Switzerland)
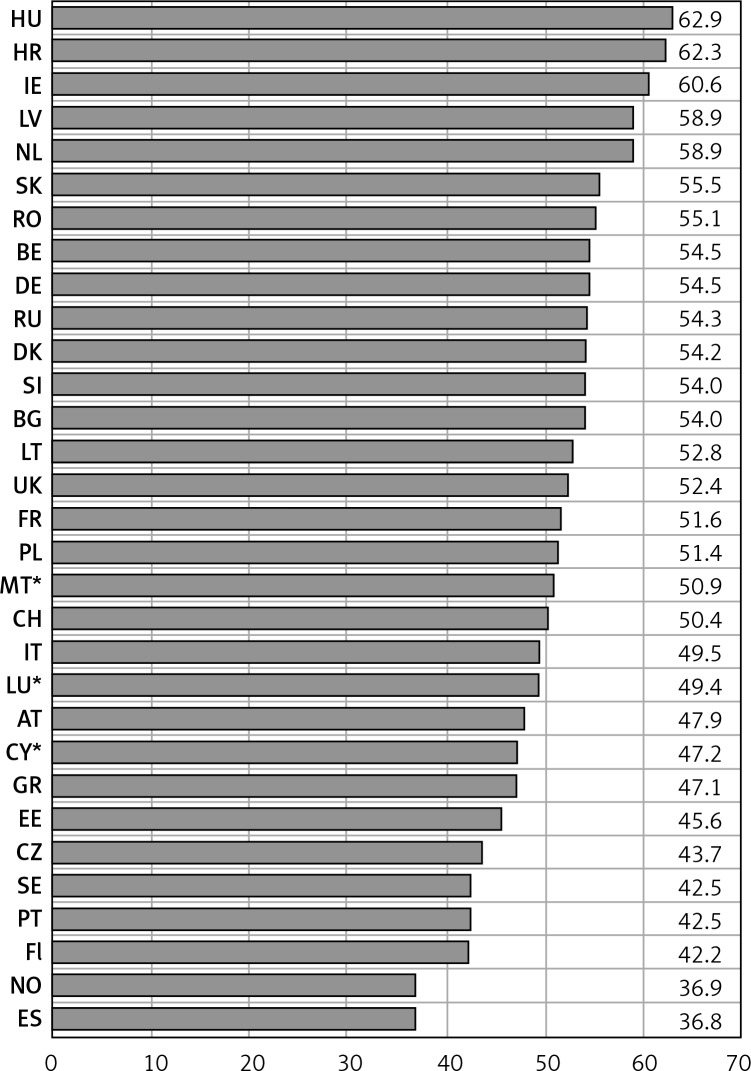
Figure 4 presents breast cancer mortality rates among women aged 45+ in 2015 (for Bulgaria and Slovakia - 2014 and Russian Federation – 2013; for countries with small populations – Cyprus, Luxembourg and Malta – we used Joinpoint modeled data, applied due to large fluctuations). The highest mortality rates – more than 60/100,000 of the population – occurred in Hungary (62.9/100,000), Croatia (62.3/100,000) and in Ireland (60.6/100,000). The lowest – less than 40/100,000 – occurred in Spain (36.8/100,000) and in Norway (36.9/100,000). Among remaining analyzed countries, we can distinguish two main groups – countries with mortality rates between 42/100,000 and 50/100,000 (ten countries) and between 50/100,000 and 59/100,000 (seventeen countries).
Figure 4.
Age-standardized breast cancer mortality rates in analyzed countries, women aged 45+ in 2015**
*Joinpoint modeled data (applied due to large fluctuations in data). **BG, SK – 2014; RU – 2013. HU – Hungary, HR – Croatia, IE – Ireland, LV – Latvia, NL – Netherlands, SK – Slovakia, RO – Romania, BE – Belgium, DE – Germany, RU – Russian Federation, DK – Denmark, SI – Slovenia, BG – Bulgaria, LT – Lithuania, UK – United Kingdom, FR – France, PL – Poland, MT – Malta, CH – Switzerland, IT – Italy, LU – Luxembourg, AT – Austria, CY – Cyprus, GR – Greece, EE – Estonia, CZ – Czech Republic, SE – Sweden, PT – Portugal, Fl – Finland, NO – Norway, ES – Spain.
Table I shows annual percent changes in the breast cancer mortality among women aged 45+ for all identified trends in each analyzed country. Recent observed APC – at the level approximately from –1% to –2% – was characteristic for the 15 “old EU” countries – Austria (–2.0%), Belgium (–2.2%), Finland (–1.3%), France (–1.6%), Germany (–1.6%), Ireland (–1.9%), Italy (–1.5%), Luxembourg (–1.9%), Netherlands (–2.3%), Portugal (–1.4%), Spain (–2.0%), Sweden (–2.5%), and the United Kingdom (–2.3%). The only two exceptions with the lowest and the highest drop in APC in the analyzed group of countries were respectively Greece –0.6% and Denmark –3.0%.
Among countries that joined EU in 2004 we have investigated a large range in current APC in the breast cancer mortality among women aged 45+: Cyprus (–1.1%), Czech Republic (–1.7%), Estonia (–1.9%), Hungary (–0.5%), Latvia (–1.6%), Lithuania (–3.3%), Malta (–3.4%), Slovenia (–1.9%). For countries with a breast cancer mortality increase – Poland and Slovakia – APC was at the same level for both countries: 1.1%.
In the last group of countries that joined the EU, there are only those with increasing breast cancer mortality. Values of APC were: in Bulgaria 0.3%, Romania 1.5% (joined EU in 2007) and Croatia 0.3% (joined EU in 2013).
In our control group, currently in all countries we observed a different rate of decrease in breast cancer mortality. The biggest drop was noted in Norway, where APC was –2.6%, next in the Russian Federation (–2.2%), and the lowest in Switzerland (–1.7%).
Discussion
In almost all analyzed countries we have observed a decline in the breast cancer mortality among women aged 45 years old and older. For most of these countries the breakthrough point took place in the 1990s. In four countries – Croatia, Poland, Romania, Slovakia – we observed the start of an increase in breast cancer mortality in the analyzed age group. In Bulgaria there was continuation of an increase. Similarly, Carioli et al. found in their study an overall decrease of breast cancer mortality in Europe. Moreover, like in our study, Carioli et al. found a growing breast cancer mortality trend in Bulgaria (among women 50–69 years old in the years 2002–2012 a percentage change = 15.9). On the other hand, in the same study, the authors presented results suggesting a decrease in breast cancer mortality in Croatia (APC = –5.9), Poland (APC = –2.4), Romania (APC = –7.8) and Slovakia (APC = –10.9) among women aged 50–69 years old in the years 2002–2012. However, in our study analyzed data include a larger age group, as well as a broader time period. Additionally, Carioli et al. forecasted that breast cancer mortality for all age groups in Poland will not decrease until 2020 [4]. In our study, for the analyzed age group (45+) in Poland we have investigated the start of an increase in breast cancer mortality.
Clèries et al., in their study, also forecasted a slight breast cancer mortality increase until 2020 in Bulgaria, Croatia, Poland, Romania and Slovakia. Moreover, the authors also reported a possible breast cancer mortality increase in Greece, Latvia and Estonia. However, their analysis was performed for women in the age group 50–69 years old and was based on the epidemiological data from 2006 to 2012 [12]. Data obtained in our study do not suggest a breast cancer mortality increase in Greece, Latvia and Estonia among women aged 45+ with respectively lately observed APC = –0.6; –1.6; –1.9.
The analyzed age group – women aged 45 years old and older – is a specific group for breast cancer. The great majority of cases occur among women around this age. Any problems with early breast cancer detection, with access to the treatment or overall problems with health care system functioning could be reflected in the breast cancer mortality rates. In accordance with the Euro Health Consumer Index 2018 Report data, countries with an increase in breast cancer mortality, investigated in our study (Bulgaria, Croatia, Poland, Romania and Slovakia), are in the group with the lowest overall assessment on general functioning of their health care systems among European countries. Evaluation was based on six areas: patient rights and information; accessibility/waiting time for treatment; outcomes; range and reach of services (“generosity”); prevention; pharmaceuticals. Results for analyzed countries were as follows: Slovakia – 17th position (728 points/1,000), Croatia – 21st (678 points/1,000), Bulgaria – 26th (635 points/1,000), Poland – 32nd (585 points/1,000), Romania – 34th (549 points/1,000). The total number of countries that were assessed was 35. The best result was achieved by Switzerland – 893 points/1,000 [13].
Despite the great discussion about overdiagnosis in mammography, most of the authors indicate mammography screening as one of the most impactful tools in affecting breast cancer mortality [3, 14–16]. The obtained results may suggest that in five analyzed countries with an investigated breast cancer mortality increase, there could be some difficulties with mammography screenings. In accordance with the report “Cancer Screening in the European Union (2017)” in Bulgaria and Slovakia there are no organized population-based screening programs for early breast cancer detection. In Croatia and in Poland such programs were initiated in 2006, which could be considered as relatively late, taking into account some Nordic or Western European countries, for example: Sweden – 1986, Finland – 1987, United Kingdom – 1988, Italy – 1990, Belgium – 2001. On the other hand, there are some countries that introduced national screening programs after 2006 (for example: Austria – 2007; Latvia – 2008 or Malta – 2008) and do not demonstrate a breast cancer mortality increase among women 45+, which could be explained by the use of more effective models of the screening programs and more efficient health care systems [15, 17].
In Romania, breast cancer screening was introduced even later than in Croatia and in Poland, in 2015, and it was only a small-scale pilot. Among the five analyzed countries, only in Poland does the screening policy function as an official law. In Romania it functions as an official recommendation [18]. Regardless of this fact, in Poland in 2015, the Ministry of Health decided to cease sending invitations for breast (and cervical) cancer screening. Since that time, the coverage of the population eligible for screening tests under the program has been as follows: Feb. 2016 – 41.85%; Feb. 2017 – 38.83%; Feb. 2018 – 37.97%; Feb. 2019 – 37.35% [19].
Furthermore, there are also some other strong factors which may be among the possible reasons for increasing breast cancer mortality in the five considered EU countries. Immediate start of the treatment plays a pivotal role in the further prognosis for women with breast cancer. Jassem et al. investigated the system-related delay time (SDT) in the breast cancer treatment in selected countries in 2011. They found that the average time from the breast cancer diagnosis to the treatment start was (in weeks): in Bulgaria 12.51; Croatia 10.23; Poland 9.49; Romania 20.42; Slovakia 10.72 [20]. Moreover, good practice in breast cancer management has been developed in the United Kingdom – the 2 weeks’ rule – where the first visit to a specialist takes place within 2 weeks from being diagnosed by a general practitioner. Overall time from the very first cancer recognition to start of the treatment should not exceed about 8 weeks [21]. For comparison, in non-EU countries SDT was: 12.42 in the Russian Federation, 10.49 in Turkey and 9.16 in Serbia [20].
Other data, presented in the Onkobarometer WHC report (2017), show that in the case of Poland the average time from the moment when the disease is recognized as a probable breast cancer to the beginning of the treatment, in the worst scenario can reach up to 38.2 weeks [22]. In the case of Romania, apart from the long waiting time, patients also have delayed access to innovative treatment – the list of reimbursed drugs is updated in long intervals [23].
In conclusion, the most probable reason for the breast cancer mortality increase among women aged 45 years old and older in Bulgaria, Croatia, Poland, Romania and Slovakia is low efficiency of the health care systems in these countries.
In order to maintain the favorable declining trend in breast cancer mortality among women aged 45+ and to stop the mortality increase in the EU countries, immediate actions for improvement in breast cancer management should be considered.
Conflict of interest
The authors declare no conflict of interest.
References
- 1.Ferlay J, Colombet M, Soerjomataram I, et al. Cancer incidence and mortality patterns in Europe: estimates for 40 countries and 25 major cancers in 2018. Eur J Cancer. 2018;103:356–87. doi: 10.1016/j.ejca.2018.07.005. [DOI] [PubMed] [Google Scholar]
- 2.Kamińska M, Ciszewski T, Łopacka-Szatan K, et al. Breast cancer risk factors. Prz Menopauz. 2015;14:196–202. doi: 10.5114/pm.2015.54346. [DOI] [PMC free article] [PubMed] [Google Scholar]
- 3.Autier P, Boniol M, LaVecchia C, et al. Disparities in breast cancer mortality trends between 30 European countries: retrospective trend analysis of WHO mortality database. BMJ. 2010;341:c3620. doi: 10.1136/bmj.c3620. [DOI] [PMC free article] [PubMed] [Google Scholar]
- 4.Carioli G, Malvezzi M, Rodriguez T, Bertuccio P, Negri E, La Vecchia C. Trends and predictions to 2020 in breast cancer mortality in Europe. Breast. 2017;36:89–95. doi: 10.1016/j.breast.2017.06.003. [DOI] [PubMed] [Google Scholar]
- 5.Broeders MJM, Allgood P, Duffy SW, et al. The impact of mammography screening programmes on incidence of advanced breast cancer in Europe: a literature review. BMC Cancer. 2018;18:860. doi: 10.1186/s12885-018-4666-1. [DOI] [PMC free article] [PubMed] [Google Scholar]
- 6.Sardanelli F, Fallenberg EM, Clauser P, et al. Mammography: an update of the EUSOBI recommendations on information for women. Insights Imaging. 2016;8:11–8. doi: 10.1007/s13244-016-0531-4. [DOI] [PMC free article] [PubMed] [Google Scholar]
- 7.de Koning HJ, Heijnsdijk EA. Swiss Medical Board Mammography screening predictions for Switzerland: importance of time-periods. J Med Screen. 2015;22:201–6. doi: 10.1177/0969141315586639. [DOI] [PubMed] [Google Scholar]
- 8.Sun YS, Zhao Z, Yang ZN, et al. Risk factors and preventions of breast cancer. Int J Biol Sci. 2017;13:1387–97. doi: 10.7150/ijbs.21635. [DOI] [PMC free article] [PubMed] [Google Scholar]
- 9.McGuire A, Brown JAL, Malone C, et al. Effects of age on the detection and management of breast cancer. Cancers (Basel) 2015;7:908–29. doi: 10.3390/cancers7020815. [DOI] [PMC free article] [PubMed] [Google Scholar]
- 10.World Health Organization Health statistics and information systems. https://www.who.int/healthinfo/statistics/mortality_rawdata/en/ accessed on Feb. 1st 2019.
- 11.National Cancer Institute Joinpoint Regression Program, version 4.3.1.0. 2016. Available at: http://srab.cancer.gov/joinpoint/
- 12.Clèries R, Rooney RM, Vilardell M, Espinàs JA, Dyba T, Borras JM. Assessing predicted age-specific breast cancer mortality rates in 27 European countries by 2020. Clin Transl Oncol. 2018;20:313–21. doi: 10.1007/s12094-017-1718-y. [DOI] [PubMed] [Google Scholar]
- 13.Björnberg A, Phang AY. Health Consumer Powerhouse, Euro Health Consumer Index 2018 Report. 2019. [Google Scholar]
- 14.Seely JM, Alhassan T. Screening for breast cancer in 2018 – what should we be doing today? Curr Oncol. 2018;25(Suppl 1):S115–24. doi: 10.3747/co.25.3770. [DOI] [PMC free article] [PubMed] [Google Scholar]
- 15.Myers ER, Moorman P, Gierisch JM, et al. Benefits and harms of breast cancer screening: a systematic review. JAMA. 2015;314:1615–34. doi: 10.1001/jama.2015.13183. [DOI] [PubMed] [Google Scholar]
- 16.Coleman C. Early detection and screening for breast cancer. Semin Oncol Nurs. 2017;33:141–55. doi: 10.1016/j.soncn.2017.02.009. [DOI] [PubMed] [Google Scholar]
- 17.Altobelli E, Altobelli E. Breast cancer in European Union: an update of screening programmes as of March 2014. Int J Oncol. 2014;45:1785–92. doi: 10.3892/ijo.2014.2632. [DOI] [PMC free article] [PubMed] [Google Scholar]
- 18.Cancer Screening in the European Union . Report on the implementation of the Council Recommendation on cancer screening prepared by International Agency for Research on Cancer Lyon, France in collaboration with CPO Piemonte and University Hospital “Città della Salute e della Scienza” Turin, Italy and Mass Screening Registry/ Finnish Cancer Registry Helsinki, Finland. 2017. [Google Scholar]
- 19.National Health Fund in Poland http://www.nfz.gov.pl/dla-pacjenta/programy-profilaktyczne/dane-o-realizacji-programow/, accessed on March 2nd 2019.
- 20.Jassem J, Ozmen V, Bacanu F, et al. Delays in diagnosis and treatment of breast cancer: a multinational analysis. Eur J Public Health. 2014;24:761–67. doi: 10.1093/eurpub/ckt131. [DOI] [PubMed] [Google Scholar]
- 21.Cancer Research UK Available at: https://www.cancerresearchuk.org/health-professional/cancer-statistics/statistics-by-cancer-type/breast-cancer/diagnosis-and-treatment#ref-2 accessed on 5th March 2019.
- 22.OnkoBarometr Fundacji Watch Health Care nr 11/3/10/2017”. Avaialble at: www.korektorzdrowia.pl, accessed March 3rd 2019.
- 23.Female Oncologic Diseases in Romania. Study conducted by ISRA Center, for The Coalition for Women’s Health and Roche Romania. Bucharest: 2016. [Google Scholar]


