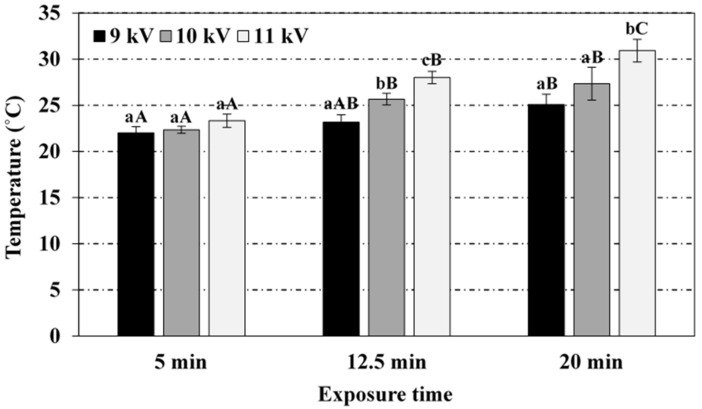
Figure 2.
Effect of the voltage peak-to-peak and exposure time to the plasma source on the temperature of the PAW. For the same exposure time (5, 12.5 or 20 min), bars bearing different lowercase letters are significantly different (p ≤ 0.05). For the same voltage peak-to-peak (9, 10 or 11 kV), bars bearing different uppercase letters are significantly different (p ≤ 0.05).

