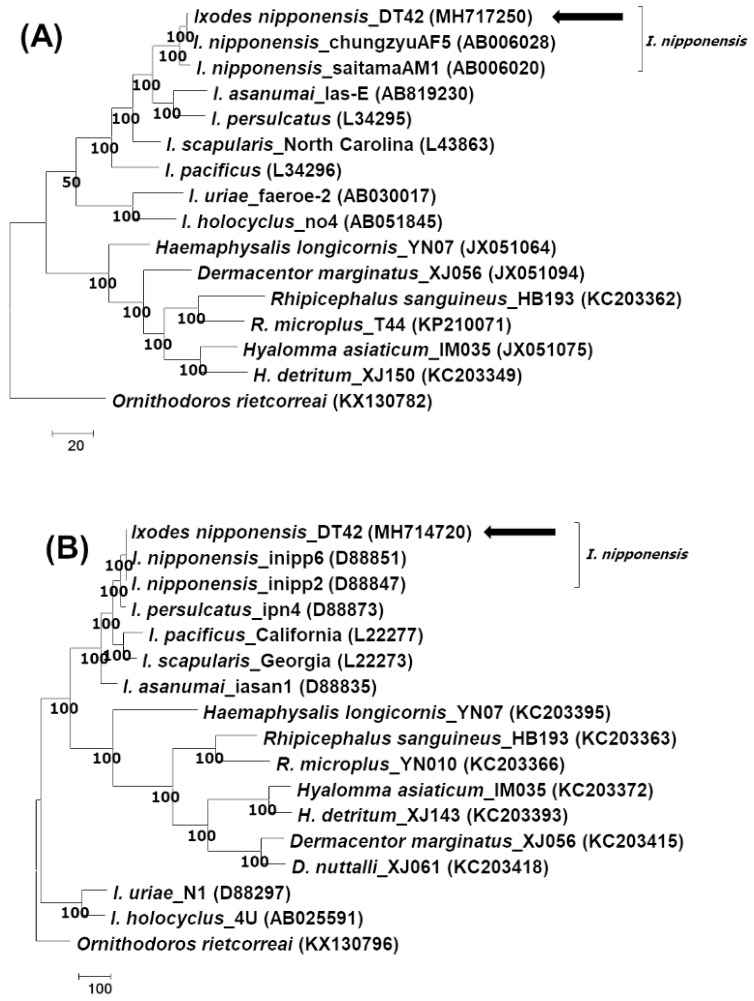
Figure 1.
Phylogenetic analysis of the tick species. The trees are analyzed according to (A) mitochondrial 16S rRNA and (B) the second intergenic spacer region, using the maximum parsimony method by MEGA 7.0. The consensus trees inferred from the two most parsimonious trees are shown, and the cut-off value for the consensus tree is 50%. The sequences identified in this study are indicated by arrows.

