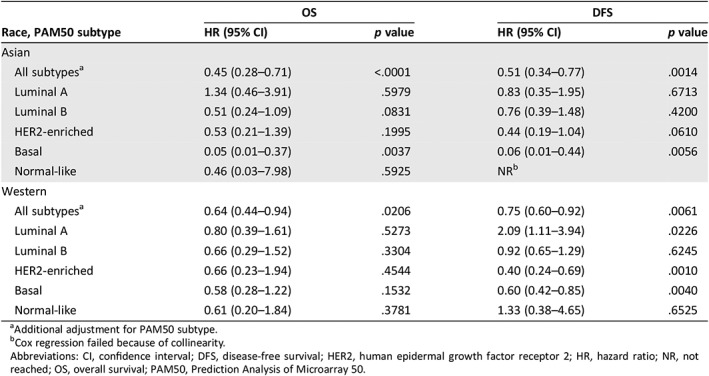
Table 2.
Associations of Estimation of Stromal and Immune Cells in Malignant Tumours Using Expression Data (ESTIMATE) immune score (high versus low) with OS and DFS, stratified by race and PAM50 subtype (adjusted for age and stage)
| Race, PAM50 subtype | OS | DFS | ||
|---|---|---|---|---|
| HR (95% CI) | p value | HR (95% CI) | p value | |
| Asian | ||||
| All subtypesa | 0.45 (0.28–0.71) | <.0001 | 0.51 (0.34–0.77) | .0014 |
| Luminal A | 1.34 (0.46–3.91) | .5979 | 0.83 (0.35–1.95) | .6713 |
| Luminal B | 0.51 (0.24–1.09) | .0831 | 0.76 (0.39–1.48) | .4200 |
| HER2‐enriched | 0.53 (0.21–1.39) | .1995 | 0.44 (0.19–1.04) | .0610 |
| Basal | 0.05 (0.01–0.37) | .0037 | 0.06 (0.01–0.44) | .0056 |
| Normal‐like | 0.46 (0.03–7.98) | .5925 | NRb | |
| Western | ||||
| All subtypesa | 0.64 (0.44–0.94) | .0206 | 0.75 (0.60–0.92) | .0061 |
| Luminal A | 0.80 (0.39–1.61) | .5273 | 2.09 (1.11–3.94) | .0226 |
| Luminal B | 0.66 (0.29–1.52) | .3304 | 0.92 (0.65–1.29) | .6245 |
| HER2‐enriched | 0.66 (0.23–1.94) | .4544 | 0.40 (0.24–0.69) | .0010 |
| Basal | 0.58 (0.28–1.22) | .1532 | 0.60 (0.42–0.85) | .0040 |
| Normal‐like | 0.61 (0.20–1.84) | .3781 | 1.33 (0.38–4.65) | .6525 |

Additional adjustment for PAM50 subtype.
Cox regression failed because of collinearity.
Abbreviations: CI, confidence interval; DFS, disease‐free survival; HER2, human epidermal growth factor receptor 2; HR, hazard ratio; NR, not reached; OS, overall survival; PAM50, Prediction Analysis of Microarray 50.
