

Summary
Since nuclear envelope breakdown occurs during mitosis in metazoan cells, it has been proposed that macroautophagy must be inhibited to maintain genome integrity. However, repression of macroautophagy during mitosis remains controversial and mechanistic detail limited to the suggestion that CDK1 phosphorylates VPS34. Here, we show that initiation of macroautophagy, measured by the translocation of the ULK complex to autophagic puncta, is repressed during mitosis, even when mTORC1 is inhibited. Indeed, mTORC1 is inactive during mitosis, reflecting its failure to localize to lysosomes due to CDK1-dependent RAPTOR phosphorylation. While mTORC1 normally represses autophagy via phosphorylation of ULK1, ATG13, ATG14, and TFEB, we show that the mitotic phosphorylation of these autophagy regulators, including at known repressive sites, is dependent on CDK1 but independent of mTOR. Thus, CDK1 substitutes for inhibited mTORC1 as the master regulator of macroautophagy during mitosis, uncoupling autophagy regulation from nutrient status to ensure repression of macroautophagy during mitosis.
Keywords: ATG13, ATG14, autophagy, CDK1, mitosis, mTOR, RAPTOR, TFEB, ULK1
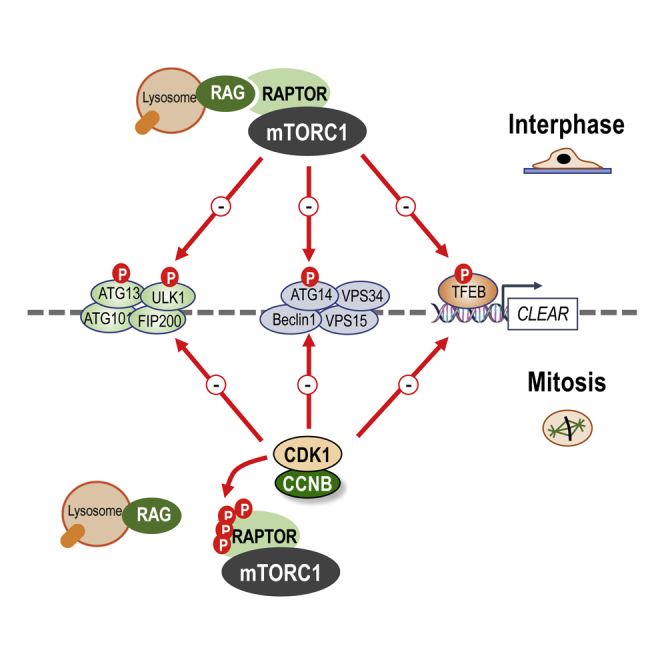
Graphical Abstract
Highlights
-
•
Autophagy initiation is repressed during mitosis, even during nutrient deprivation
-
•
RAPTOR phosphorylation in mitosis prevents mTORC1 localization to lysosomes
-
•
mTORC1 is inhibited during mitosis
-
•
CDK1 phosphorylates autophagy regulators at mTORC1 sites to repress autophagy
Odle and colleagues show that while autophagy is usually repressed by the nutrient-responsive mTORC1 kinase complex, this is not the case during mitosis. Instead, CCNB1-CDK1 catalyzes phosphorylation at the same repressive sites, taking over the role of repressing autophagy regulators. Thus, repression of autophagy is ensured regardless of nutrient availability.
Introduction
Macroautophagy (hereafter referred to as autophagy) is the key catabolic mechanism of nonselective, lysosome-mediated degradation of cytosolic cargo during times of stress. For example, nutrient starvation activates autophagy to increase the pool of amino acids and maintain neosynthesis of proteins that are essential for survival. The amino-acid-responsive serine/threonine kinase mechanistic target of rapamycin (mTOR) exists in two discrete complexes (mTORC1 and mTORC2); mTORC1 is a critical regulator of autophagy (Jung et al., 2010). In nutrient-rich conditions, active mTORC1 represses assembly of the autophagosome and thence autolysosome through mTORC1-dependent inhibitory phosphorylation of ATG13 (Ganley et al., 2009, Hosokawa et al., 2009, Jung et al., 2009, Puente et al., 2016), ULK1 (Ganley et al., 2009, Hosokawa et al., 2009, Jung et al., 2009, Kim et al., 2011), ATG14 (Yuan et al., 2013), and TFEB (Martina et al., 2012, Roczniak-Ferguson et al., 2012, Settembre et al., 2012) (here referred to collectively as autophagy regulators [ARs]). Amino acid starvation inactivates mTORC1, relieving repressive phosphorylation of ARs to promote autophagy (Kim and Guan, 2011).
ATG13, FIP200, ATG101, and ULK1 form a complex that is required for the initiation of autophagy (Jung et al., 2009). mTORC1 phosphorylates ULK1 at S758 and ATG13 at S259 (mouse 258) to repress autophagy (Jung et al., 2009, Kim et al., 2011, Shang et al., 2011, Puente et al., 2016); indeed, S758 is rapidly dephosphorylated upon amino acid starvation or mTOR inhibition (Shang et al., 2011). Subsequent development and maturation of the autophagosome is controlled by a complex containing the lipid kinase VPS34, Beclin1, and ATG14 (Itakura and Mizushima, 2010). ULK1 phosphorylates Beclin1, increasing lipid kinase activity of ATG14-containing VPS34 complexes (Russell et al., 2013) and directing the VPS34 complex to the developing autophagosome (Itakura and Mizushima, 2010). In addition, ULK1 phosphorylates ATG14 at S29 to stimulate VPS34 activity (Park et al., 2016). Opposing this, the direct phosphorylation of ATG14 by mTOR at multiple sites decreases VPS34 activity (Yuan et al., 2013). Thus, mTOR inhibits initial autophagosome synthesis via phosphorylation of ATG13 and ULK1 and inhibits the maturation stage of autophagosome synthesis via phosphorylation of ATG14.
Mature autophagosomes fuse with acidic lysosomes, which degrade the engulfed cargo. Maintenance of autophagic and lysosomal capacity requires the TFEB transcription factor, which drives expression of CLEAR genes (Settembre et al., 2011) that promote lysosomal biogenesis. mTOR controls the late-stage degradative process through repressive phosphorylation of TFEB at S142 (Settembre et al., 2012) and S211 (Martina et al., 2012, Roczniak-Ferguson et al., 2012), which promote cytosolic retention of TFEB; S211 phosphorylation promotes TFEB sequestration by 14-3-3 proteins. mTOR-dependent phosphorylation of S122 may also aid cytosolic retention of TFEB (Vega-Rubin-de-Celis et al., 2017). Inhibition of mTORC1 results in the rapid dephosphorylation and nuclear localization of TFEB (Martina et al., 2012, Roczniak-Ferguson et al., 2012, Settembre et al., 2012) to drive CLEAR gene expression. Thus, through phosphorylation of ATG13, ULK1, ATG14, and TFEB, mTOR promotes an overarching repression of autophagy, from the earliest steps of autophagosome initiation to lysosomal biogenesis.
In metazoans, nuclear envelope breakdown (NEB) occurs early in mitosis and is controlled by cyclin B (CCNB1)-CDK1; the onset of NEB correlates with increases in CCNB1-CDK1 activity, and nuclear lamins are direct substrates of CCNB1-CDK1 (Güttinger et al., 2009, Heald and McKeon, 1990, Peter et al., 1990). Reductions in CDK1 activity correlate with anaphase and nuclear envelope reformation (Chang et al., 2003), and treatment of metaphase cells with CDK1 inhibitors promotes premature nuclear envelope reformation and exit from mitosis (Tseng and Chen, 2011). NEB exposes nuclear contents to cytoplasmic processes, including autophagy, during early mitosis. Since endogenous DNA is degraded by lysosomes (Fujiwara et al., 2013), NEB risks autophagic degradation of parts of the mitotic spindle and the genetic material itself, potentially resulting in aneuploidy and DNA damage, features of aging and drivers of age-related pathologies such as cancer; indeed, mitotic chromosomes can be engulfed by autophagosomes (Sit et al., 1996). It has therefore been postulated that autophagy is repressed during mitosis to protect nuclear contents and maintain genome integrity (Eskelinen et al., 2002). Certainly, the number of autophagosomes is significantly reduced in prometaphase-arrested cells, even during nutrient starvation (Eskelinen et al., 2002), and autophagosomes reappear after nuclear envelopment (Eskelinen et al., 2002). However, this idea has not been without controversy, and several recent publications have suggested that autophagy is active during mitosis (Liu et al., 2009, Doménech et al., 2015, Li et al., 2016). Two of these studies employed the use of lysosomal inhibitors and LC3B processing or immunofluorescence (Li et al., 2016, Liu et al., 2009); however, interpretation of these experiments can be confounded by autophagosomes formed during interphase persisting into mitosis. Furthermore, lysosomal inhibitors can actually promote LC3B lipidation by activating non-canonical autophagy (Jacquin et al., 2017), which is independent of the ULK1 complex (Florey et al., 2011); this could falsely report an apparent persistence of autophagy during mitosis. In addition, LC3B immunofluorescence does not distinguish between selective autophagy and nonselective autophagy; indeed, cyclin A2 can be degraded by selective autophagy during metaphase (Loukil et al., 2014). Furthermore, some reports have studied autophagy during drug-induced mitotic arrest, but not during a normal, unperturbed mitosis (Doménech et al., 2015, Eskelinen et al., 2002). Even in studies showing repression of autophagy in mitosis, mechanistic insights are limited to a suggested role for phosphorylation of VPS34 at T159 by CDK1 and p25/CDK5 (Furuya et al., 2010). However, mutagenesis of T159 failed to reverse CDK5-mediated autophagy repression (Furuya et al., 2010), suggesting that this was one of two or more redundant mechanisms by which CDKs repressed autophagy.
Here, we show by fixed-cell and live-cell imaging that autophagy is indeed repressed during mitosis, including at the earliest stages of autophagosome initiation. Mitotic suppression of autophagy overrides mTORC1-driven inactivation, since it occurs even in cells starved of amino acids or treated with mTOR inhibitors. Indeed, during mitosis, mTORC1 fails to be recruited to lysosomes, a critical step in its activation in response to amino acids (Sancak et al., 2010), due to CDK1-dependent RAPTOR phosphorylation, which separates mTORC1 from the Rag proteins. Finally, we show that ULK1, ATG13, ATG14, and TFEB undergo mitotic hyperphosphorylation that is dependent on CDK1 activity but independent of mTOR; this includes phosphorylation at known mTOR-dependent sites that are repressive for autophagy, including p-S758 ULK1, p-S259 ATG13, and p-S122 and p-S142 TFEB; indeed, CCNB1-CDK1 can phosphorylate all of these sites in vitro. Thus, mTORC1 is inhibited during mitosis, and key regulators at all stages of autophagy come under the control of CDK1 to ensure a coordinated repression of autophagy during mitosis.
Results
Autophagy Is Repressed at the Earliest Stages of Autophagosome Initiation during Mitosis
While nearly all studies agree that autophagosome number is decreased during mitosis, there is disagreement on whether this reflects decreased autophagosome synthesis or increased autophagosome degradation. Previous studies relied largely on the number of LC3 puncta and LC3 lipidation as readouts of autophagosomes; these are not very dynamic readouts when compared with mitosis, which is completed in ∼90 min. Indeed, using the classical mRFP-EGFP-LC3, we found that alterations in LC3 puncta number were relatively slow, with acid-sensitive GFP-LC3 taking ∼30 min to clear from mitotically arrested cells and acid-stable RFP-LC3 persisting for hours (data not shown). Therefore, LC3 puncta could be carried over from interphase rather than generated during mitosis. Indeed, treatment of mRFP-EGFP-LC3 HEK293 cells arrested in mitosis with an mTOR kinase inhibitor, AZD8055 (Chresta et al., 2010), to stimulate autophagy showed no increases in LC3 puncta within 2.5 h of treatment, despite profound autophagy induction in neighboring interphase cells (Video S1; Figure S1A).
HEK293 cells expressing the tandem LC3 reporter mRFP-EGFP-LC3 were treated with paclitaxel for 4 h prior to transfer to live-cell imaging stage. Just prior to the 30 min point of acquisition, AZD8055 was added at a final concentration of 1 μM and imaging acquired for a further 2.5 h
Since LC3 puncta could not be interpreted during normal mitosis, we sought a more dynamic and unambiguous marker of autophagosome initiation. Omegasome markers are a dynamic readout of autophagy initiation, since puncta only persist for ∼3 min. ATG13 localizes to the developing omegasome but leaves it prior to the autophagosomal budding step (Karanasios et al., 2013). ATG13 puncta are therefore a transient marker of the omegasome intermediate structure and are not influenced by the rate of degradation of autophagosomes. Indeed, ATG13 puncta increased upon nutrient starvation or treatment with mTOR inhibitors (Karanasios et al., 2013) (Figures 1A and S1B). We therefore monitored endogenous ATG13 puncta by immunofluorescence microscopy. AZD8055 or amino acid starvation caused a large increase in the number of endogenous ATG13 puncta in interphase cells (Figures 1A and 1B); however, very few ATG13 puncta were detected in mitotic (p-S10-H3-positive) cells regardless of treatment (Figures 1A and 1B; Table S1). Furthermore, mitotic suppression of autophagy was dominant over mTOR-dependent regulation, since ATG13 puncta were absent in mitotic cells treated with AZD8055 or starved of amino acids (Figures 1A and 1B).
Figure 1.

ATG13 Puncta Are Significantly Reduced in p-S10 H3-Positive Mitotic Cells Compared to Interphase Cells
(A) HeLa cells released from double thymidine block for 10 h were treated with 1 μM AZD8055 or starved (HBSS + 1% BSA) for the last 2 h. Primary antibodies used were ATG13 (green) and p-S10 H3 (magenta).
(B) Quantification of (A) showing the average number of ATG13 puncta per a cell in different conditions. Mean ± SD across three biological replicates. p values were calculated from a two-way ANOVA (Tukey). ∗p < 0.05; ∗∗p < 0.01; ∗∗∗p < 0.001.
(C) Montage from Video S2. HEK293 GFP-ATG13 (green) H2B-mCherry (magenta) cells were treated with 1 μM AZD8055 for 1 h prior to transfer to a live-cell imaging incubator. A mitotic cell is indicated by an arrow.
(D) MRC5 cells were treated with 1 μM AZD8055 or starved (HBSS) for 2 h. Primary antibodies used were ATG13 (green) and p-S10 H3 (magenta).
(E) Quantification of (Figure S1C) showing the average number of WIPI2 puncta per a cell in different conditions. Mean ± SD across three biological replicates. p values calculated from a two-way ANOVA (Tukey). ∗p < 0.05; ∗∗p < 0.01.
Scale bars, 20 μm.
Since repression of autophagy is proposed to protect exposed chromatin from autophagosomes, we reasoned that inhibition of autophagy would correlate with NEB. We used HEK293 cells stably expressing low levels of GFP-ATG13 that exhibit normal puncta formation following mTOR inhibition (Karanasios et al., 2013) (Figure S1B). We stably expressed histone2B-mCherry in these cells to monitor chromosome condensation and autophagy in the same cell by live-cell imaging. When asynchronous cells were treated with AZD8055, those cells in interphase exhibited abundant GFP-ATG13 puncta; however, GFP-ATG13 puncta were completely absent in cells undergoing mitosis (Figure 1C; Video S2). Tracking the stages of mitosis revealed that GFP-ATG13 puncta were lost at prophase and prometaphase, when chromosome condensation and NEB occurred, and did not reappear until after reformation of the nuclear envelope and completion of cytokinesis (Figure 1C; Video S2). Three-dimensional reconstructions confirmed the complete absence of GFP-ATG13 puncta throughout individual mitotic cells, whereas puncta were readily visible within neighboring interphase cells (Video S3). These results demonstrate for the first time the coordinate repression of autophagy initiation at the onset of mitosis and its resumption upon completion of cell division.
Asynchronous HEK293 GFP-ATG13 H2B-mCherry cells were treated with AZD8055 (1 μM) for one h prior to transfer to a live-cell imaging incubator (GFP-ATG13 green; center: H2B-mCherry magenta; left). Similar results were obtained in 3 independent experiments.
3D reconstruction of cells imaged in Video S1 using Imaris software
Both HeLa and HEK293 cells exhibit a high degree of polyploidy, so we also performed fixed-cell ATG13 immunofluorescence in hTERT-immortalized MRC5 primary human diploid fibroblasts and observed the same results (Figure 1D). We also performed immunofluorescence for WIPI2, a mammalian homolog of ATG18 and PI3P effector protein that promotes LC3B lipidation and autophagosomal membrane formation through recruitment of the ATG16 complex (Dooley et al., 2014, Polson et al., 2010). Like ATG13, WIPI2 puncta increased upon mTOR inhibition in interphase cells but were absent from mitotic cells regardless of the treatment condition (Figures S1C and 1E; Table S1). Critically, these studies utilizing omegasome markers (Figure 1) were performed in the absence of any chemical mitotic inhibitors. Thus, autophagy was repressed at its earliest stages as cells progressed through normal mitosis.
mTOR Fails to Localize to Lysosomes during Mitosis
Prompted by the failure of mTOR inhibitors to drive autophagy during mitosis, we analyzed the status of mTOR. Reports differ on whether mTORC1 is active or repressed during mitosis (Ramírez-Valle et al., 2010, Ruf et al., 2017). We analyzed mTORC1 localization to lysosomes, as this is a critical step for mTORC1 activation (Sancak et al., 2010). We found that mTOR co-localized with Lamp2 in interphase cells; however, mTOR showed minimal Lamp2 co-localization in mitotic cells (Figure 2A). This occurred even in the presence of AZD8055, which in common with another ATP-competitive mTOR inhibitor, Torin-1, promoted mTOR localization to lysosomes in interphase cells (Figure 2A). To validate these results with another marker, we utilized a HAP-1 cell line in which endogenous RAPTOR has been tagged with GFP by CRISPR/Cas9 editing (Manifava et al., 2016). Consistent with our results in HeLa cells, RAPTOR-GFP failed to localize to lysosomes during normal mitosis (Figure 2B). Starvation promoted a diffuse distribution of RAPTOR-GFP, which was reversed upon re-addition of nutrients in interphase cells (Manifava et al., 2016) (Figure 2B). However, re-addition of nutrients failed to promote any RAPTOR-GFP foci in mitotic cells (Figure 2B). Thus, mTORC1 no longer exhibited a nutrient-dependent recruitment to lysosomes during mitosis.
Figure 2.

mTORC1 Fails to Localize to Lysosomes during Mitosis
(A) Asynchronous HeLa cells were treated with 1 μM AZD8055 for 2 h. Primary antibodies used were Lamp2 (magenta) and mTOR (green).
(B) HAP1 RAPTOR-GFP cells were treated with AZD8055 (1 μM), starved, or starved and then refed for 5 min. The primary antibody used was LAMP2 (magenta). Mitotic cells are indicated (M) in the DAPI channel.
(C) Asynchronous HeLa cells were immunostained for RagC (green) and Lamp2 (magenta).
(D) Asynchronous HeLa cells were transfected with either WT Rag duplex or active Rag duplex. Transfected cells are indicated with an X in the merge image (based on HA immunostain).
(E) HAP1 RAPTOR-GFP cells were treated with 50 nM paclitaxel (16 h), 1μM AZD8055 (2 h), or starved (2 h) prior to immunoprecipitation with GFP-TRAP. HAP1 parental cells (P) served as a negative control (P).
(F) HAP1 RAPTOR-GFP cells were treated with 50 nM paclitaxel (16 h), 2 μM RO-3306 (2 h), or starved (2 h) prior to immunoprecipitation with GFP-TRAP.
(G) HeLa cells stably expressing indicated HA-RAPTOR constructs were treated with 50 nM paclitaxel (16 h) prior to immunoprecipitation with HA antibody. Western blots are from a single experiment representative of three independent experiments.
Scale bars, 20 μm.
RAPTOR is hyperphosphorylated during mitosis by CDK1, and this has previously been proposed to result in mTORC1’s hyperactivation (Ramírez-Valle et al., 2010). However, we observed that while AZD8055 treatment promoted the translocation of RAPTOR from the cytosol to membrane fraction, this was prevented by paclitaxel treatment, and this correlated with RAPTOR hyperphosphorylation; indeed, hyperphosphorylated RAPTOR was strongly enriched in the cytosolic fraction in mitotic cells (Figure S2). Thus, mitotic phosphorylation of RAPTOR was associated with its loss from the Lamp2-containing membrane fraction.
Since the Rag GTPases recruit RAPTOR (and thereby mTOR) to lysosomes, we assessed Rag localization during mitosis. RagC localization strongly correlated Lamp2 in both interphase and mitotic cells (Figure 2C). However, overexpression of dominant active Rag pairs (RagBGTP RagDGDP) failed to promote mTOR localization to lysosomes in mitotic cells (Figure 2D). This implied that activated Rag GTPases were unable to recruit RAPTOR during mitosis, so we assessed Rag-RAPTOR interactions by capturing RAPTOR-GFP from HAP1 cells using GFP-Trap (Figure 2E). Paclitaxel treatment of cells resulted in RAPTOR phosphorylation and impaired both RagA and RagC binding to RAPTOR (Figure 2E), supporting our immunofluorescence data. In contrast, paclitaxel had no effect on the binding of mTOR to RAPTOR, suggesting the mTORC1-RAPTOR complex remained intact during mitosis (Figure 2E). The paclitaxel-induced dissociation of RAPTOR from Rag proteins was completely reversed by the selective CDK1 inhibitor RO-3306 (Figure 2F), which also prevented RAPTOR phosphorylation.
To assess the role of CDK1-dependent RAPTOR phosphorylation, we stably expressed HA-RAPTOR harboring phospho-null Ala (A7) or putative phosphomimetic Asp (D7) mutations at seven known CDK1-dependent phosphorylation sites (Ramírez-Valle et al., 2010) (Figure 2G). As previously observed (Ramírez-Valle et al., 2010), the A7 mutant strikingly, but not completely, impaired the mitotic bandshift of RAPTOR, while the D7 mutant exhibited decreased electrophoretic mobility in asynchronous lysates but underwent further phosphorylation in mitotic cells; thus, there are additional mitotic, CDK1-dependent phosphorylation sites (Figure 2G). As observed for the endogenous protein, paclitaxel treatment impaired binding of RagA to wild-type (WT) HA-RAPTOR (Figure 2G). Strikingly, the D7 mutant exhibited constitutively impaired Rag-RAPTOR binding even in asynchronous cells (Figure 2G). These results suggest that the CDK1-dependent phosphorylation of these seven sites is sufficient to impair mTORC1 localization to lysosomes. However, other mitotic phosphorylation sites (currently unidentified) may also contribute to the failure of mTORC1 to localize to lysosomes.
CDK1-Dependent Phosphorylation of Multiple Autophagy Regulators during Mitosis
Since autophagy initiation was inhibited during mitosis yet mTORC1 was unable to recruit to lysosomes to become activated (which should in turn promote autophagy), we sought to investigate if the ULK1 kinase complex was regulated by phosphorylation during mitosis. In addition, we also investigated ATG14 and TFEB.
Initially we employed the microtubule inhibitor paclitaxel to arrest cells in prometaphase. HCT116 cells treated with paclitaxel exhibited a time-dependent reduction in electrophoretic mobility (a surrogate for phosphorylation) of all ARs; the appearance of the phosphorylated forms correlated with the appearance of the mitotic marker phospho-S10 H3 (Figure 3A). All ARs were hypophosphorylated again after 24 h of paclitaxel treatment, reflecting HCT116 cells undergoing mitotic slippage as evidenced by a decrease in p-S10 (H3) (Figure 3A) (Sloss et al., 2016, Andonegui-Elguera et al., 2016, Jakhar et al., 2018). Indeed, autophagy is activated during mitotic catastrophe (Sorokina et al., 2017) or slippage (Jakhar et al., 2018, Veldhoen et al., 2013), and this may explain the discrepancy between the 16-h (mitotic) and 24-h (slippage) samples (Figure 3A). When we immunoprecipitated ATG13 and TFEB from high-expressing cell lines (HeLa and COLO205) and treated them with lambda phosphatase, the paclitaxel-induced mobility shift was completely reversed, indicating that it did indeed reflect mitotic phosphorylation (Figures 3B and 3C). Treatment of HCT116 cell lysates with lambda phosphatase also abolished the paclitaxel-induced mobility shift of ATG14 and ULK1 (Figure 3D). Thus, ATG13, ULK1, ATG14, and TFEB underwent substantial phosphorylation in prometaphase-arrested cells.
Figure 3.

Hyperphosphorylation of Autophagy Regulators (ATG13, ATG14, TFEB, and ULK1) Is Observed upon Treatment with Microtubule Inhibitors in a CDK1-Dependent Manner
(A) HCT116 cells were treated with 50 nM paclitaxel for the indicated time.
(B) HeLa cells were treated with 50 nM paclitaxel (16 h) or DMSO control. ATG13 was then immunoprecipitated and treated with lambda phosphatase (λPP).
(C) Experiment performed as in (B), except that TFEB was immunoprecipitated from COLO205 cells.
(D) HCT116 cells were treated with 50 nM paclitaxel or DMSO control and whole-cell lysates incubated in the presence or absence of λPP.
(E) HCT116 cells were treated with 50 nM paclitaxel (16 h) and the indicated doses of RO-3306 added for the last 2 h.
(F) HCT116 cells were treated with 50 nM paclitaxel or 62.5 ng mL−1 nocodazole (16 h) and received DMSO, 2 μM RO-3306, 10 μM NU6102, or 25 μM roscovitine 2 h prior to lysis. Western blots are from a single experiment representative of three independent experiments.
Paclitaxel, a microtubule-stabilizing drug, arrests cells in prometaphase with high CCNB1-CDK1 activity (Chadebech et al., 2000). While 4E-BP1 and S6K are well-established mTORC1 substrates mediating control of translation and ribosome biogenesis (Hay and Sonenberg, 2004, Ma and Blenis, 2009, Nandagopal and Roux, 2015), both 4E-BP1 (Greenberg and Zimmer, 2005, Heesom et al., 2001, Shuda et al., 2015, Velásquez et al., 2016) and S6K (Papst et al., 1998, Shah et al., 2003) are phosphorylated by CDK1 at canonical mTOR sites and additional CDK1-specific sites during mitosis (e.g., the δ isoform of 4E-BP1). Indeed, the CDK1-selective inhibitor RO-3306 reversed the paclitaxel-induced hyperphosphorylation of all ARs in a dose-dependent manner, correlating with the loss of p-S10 H3 and hyperphosphorylated 4E-BP1-δ, a specific marker of CDK1 activity (Velásquez et al., 2016) (Figure 3E). Hyperphosphorylation of ARs was also observed upon treatment with nocodazole, a microtubule-depolymerizing agent, and this was also reversed by three independent CDK1 inhibitors (Figure 3F). Finally, dimethylenastron, an inhibitor of the mitotic kinesin Eg5 that elicits a pro-metaphase arrest (Liu et al., 2006), also caused CDK1-dependent phosphorylation of ARs (Figure S3). Thus, hyperphosphorylation of key ARs was observed when mitotic arrest was induced by three different treatments and in each case was dependent on CDK1 activity.
Mitotic Phosphorylation of Autophagy Regulators Is Independent of mTORC1
mTORC1 is the key regulatory kinase for these ARs during interphase, but our results suggested that mTORC1 was inhibited in mitosis. Indeed, treatment with AZD8055 failed to reverse mitotic hyperphosphorylation of these ARs (Figure 4A) or the mitotic phosphorylation of 4E-BP1 (Figure S2), confirming reports that mitotic phosphorylation of 4E-BP1 is independent of mTORC1 (Greenberg and Zimmer, 2005, Shuda et al., 2015, Velásquez et al., 2016). In fact, treatment of mitotically arrested cells with any of three distinct mTOR kinase inhibitors failed to reverse the hyperphosphorylation of ARs (Figure 4B), whereas RO-3306 again reversed mitotic phosphorylation of all ARs. Crucially, the mTOR-specific, repressive phosphorylation of ULK1 at S758 was lost when asynchronous cells were treated with AZD8055 but persisted when cells arrested in mitosis were treated with AZD8055 (Figure 4A). TFEB has been proposed as an ERK2 substrate (Settembre et al., 2011), but the MEK1/2 inhibitor trametinib failed to reverse mitotic hyperphosphorylation of TFEB or other ARs (Figure 4A). These results were observed in five different cell lines representing a range of tissue types (Figure S4), and the degree of AR hyperphosphorylation correlated with the degree of mitotic arrest for each cell line, as judged by the proportion of 4E-BP1-δ and p-S10 H3 intensity (Figure S4). Mitotic hyperphosphorylation of ARs was observed even when cells were treated with starvation media and/or ZSTK474 (a pan class I phosphatidylinositol 3-kinase [PI3K] inhibitor; Kong and Yamori, 2007) (Figure S5C). Thus, ARs were no longer responsive to amino acid depletion in mitosis.
Figure 4.

Mitotic Phosphorylation of Autophagy Regulators Is Independent of mTOR
(A) HCT116 cells were treated with 50 nM paclitaxel (16 h) and received DMSO, 2 μM RO-3306, 1 μM trametinib, or 1 μM AZD8055 2 h prior to lysis.
(B) HCT116 cells were treated with 50 nM paclitaxel (16 h) and received DMSO, 1 μM AZD8055, 250 nM Torin-1, or 1 μM PP242 2 h prior to lysis.
(C) HCT116 cells were treated with 50 nM paclitaxel for 6 h until approximately half of cells were rounded (indicative of mitosis). 2 h prior to lysis, cells were treated with either DMSO or AZD8055 (1 μM). Flasks then underwent mitotic shake-off to enrich interphase (I; adherent) and mitotic (M; detached) cells.
(D) HeLa cells stably expressing WT-TFEB-GFP or Δ30-TFEB-GFP were treated as indicated: starvation (2 h), refeed (complete medium; 1 h), 50 nM paclitaxel (16 h), or 1 μM AZD8055 (2 h). Western blots are from a single experiment representative of three independent experiments.
We also compared SW620 cells with derivatives that have acquired resistance to AZD8055 (SW620:8055R cells), such that they are maintained in the presence of drug with little or no detectable mTORC1 signaling (Cope et al., 2014); these cells also exhibited hyperphosphorylation of ARs upon paclitaxel treatment (Figure S5A) despite lacking a canonical p-T389 S6K signal. Finally, to confirm whether AR hyperphosphorylation was present in only mitotic cells and not in interphase paclitaxel-treated cells, we performed a mitotic shake-off (Figure 4C). As expected, AZD8055 treatment promoted the dephosphorylation of ARs in attached cells, showing that paclitaxel-treated cells in interphase respond normally to mTOR inhibition. However, the mitotically enriched fraction displayed the hyperphosphorylated forms of ARs, regardless of the presence or absence of AZD8055 (Figure 4C). Altogether, these results demonstrate that the mitotic phosphorylation of ARs was dependent upon CDK1 and independent of mTORC1.
As an alternative to the use of pharmacological inhibitors of mTOR, we used a Δ30-TFEB mutant that is defective for lysosomal localization and phosphorylation by mTORC1 (Martina and Puertollano, 2013, Roczniak-Ferguson et al., 2012). We generated HeLa cells stably expressing WT-TFEB-GFP or Δ30-TFEB-GFP; the latter cells exhibited nuclear localization of Δ30-TFEB-GFP, regardless of treatment conditions (Figure S5D), because it could not be phosphorylated by mTOR (Figure 4D), the normal signal for its cytoplasmic retention. Furthermore, Δ30-TFEB-GFP did not localize to lysosomes upon treatment with AZD8055, unlike WT-TFEB, which showed strong co-localization with the lysosomal marker LAMP2 (Figures S5D and S5E), as previously described upon treatment with ATP-competitive mTOR inhibitors (Roczniak-Ferguson et al., 2012). When these cells were starved, WT-TFEB-GFP was hypophosphorylated and this was reversed upon re-addition of complete media; in contrast, Δ30-TFEB-GFP showed no alteration in its electrophoretic mobility regardless of the presence or absence of amino acids (Figure 4D). However, both WT-TFEB-GFP and Δ30-TFEB-GFP were phosphorylated upon paclitaxel treatment (Figure 4D). Mitotic shake-off of paclitaxel treated samples confirmed that the hyperphosphorylation of both WT and Δ30 cells was limited to mitotic cells (Figure S5F). In addition, siRNA of RAPTOR in CO115 cells, selected because of their intrinsic resistance to mTOR inhibition (Cope et al., 2014), failed to reverse mitotic hyperphosphorylation of ARs (Figure S5B). Altogether, these results, using both pharmacological and genetic interventions, show that the mitotic phosphorylation of ARs is independent of mTORC1 activity.
Phosphorylation of ARs upon Synchronized Entry into Mitosis in the Absence of Microtubule Inhibitors
Microtubule inhibitors have a range of pleiotropic effects, and microtubules have been implicated in the transport of autophagosomes (Mackeh et al., 2013), so it was important to monitor AR phosphorylation in the absence of microtubule inhibitors. The reversible CDK1 inhibitor RO-3306 arrests cells at the G2/M border, with subsequent release into drug-free media allowing for a relatively synchronized entry into mitosis (Vassilev et al., 2006). Flow cytometry confirmed that RO-3306 arrested HT29 cells in G2/M (Figure S6A). Release from RO-3306 then allowed rapid entry into mitosis as assessed by the mitotic hyperphosphorylation of 4E-BP1 and S6K (Ramírez-Valle et al., 2010) (Figure 5A) after 10 min, 30 min, and 1 h; this correlated with prominent G2/M peaks (Figure S6A). Hypophosphorylation of 4E-BP1 and S6K, consistent with exit from mitosis, was apparent after 4 h, correlating with the appearance of cells in G1 (Figures 5A and S6A). Crucially, hyperphosphorylation of ARs was also observed at 10 min, 30 min, and 1 h and persisted in the presence of the mTOR inhibitor AZD8055 (Figure 5A).
Figure 5.

Mitotic Phosphorylation of Autophagy Regulators Is Observed upon Synchronized Mitosis in the Absence of Microtubule Poisons
(A) HT-29 cells were treated with 9 μM RO-3306 for 20 h prior to release into drug-free media for the indicated time in the absence or presence of 1 μM AZD8055. As a positive control, HT-29 cells were treated with 50 nM paclitaxel for 16 h (P).
(B) HeLa cells were released from double thymidine block for 10 h and received DMSO or 1 μM AZD8055 for the last 2 h. Interphase (I; adherent) and mitotic (M; detached) cells were enriched by mitotic shake-off.
(C) A549 or HCT116 cells were treated with DMSO or 1 μM AZD8055 2 h prior to fixation, staining for p-H3 (S10) or p-ULK1(S758), and analysis by flow cytometry. Mean p-ULK1 (S758) intensity for different p-H3 (S10) subpopulations is shown. p values were calculated using a two-way ANOVA (Tukey). ∗p < 0.05; ∗∗p < 0.01. Histograms show representative populations from a single experiment.
(D) A549 and HAP1 cells were treated with 50 nM paclitaxel (16 h), 1 μM AZD8055 (2 h) or starved (2 h). Mean p-ULK1(S758) intensity for p-H3 (S10) positive and negative sub-populations is shown. p values calculated using two-way ANOVA (Tukey). ∗p < 0.05; ∗∗p < 0.01. Example source images are shown in Figure S6C. Western blots are from a single experiment representative of three independent experiments.
Finally, we synchronized HeLa cells with a double thymidine block (Ma and Poon, 2017) before releasing them back into cycle for 10 h and separating interphase and mitotic cells by shake-off (Figure 5B). AZD8055 caused hypophosphorylation of ARs in interphase cells, but not in the mitotically enriched fraction (Figure 5B). Likewise, the repressive phosphorylation of ULK1 at S758 was only present in mitotically enriched cells when treated with AZD8055 (Figure 5B). Thus, phosphorylation of ARs was observed in HeLa cells going through a normal mitosis as well as in HeLa cells treated with paclitaxel (Figure S6B). TFE3, a TFEB-related transcription factor that shares mTOR-regulated domains with TFEB (Martina et al., 2014, Wada et al., 2016), also underwent mTORC1-independent mitotic phosphorylation (Figure 5B). Mitotic cells displayed a dramatic increase of unlipidated LC3B-I, regardless of the presence or absence of AZD8055 (Figure 5B), supporting previous reports that there is a reduction in autophagosomes during mitosis. Total LC3B levels appeared elevated in mitotic cells, as previously reported (Li et al., 2016). Overall, our findings suggest that the hyperphosphorylation of ARs and inhibition of autophagy is a feature of both normal mitosis and drug-induced mitotic arrest.
To further support the mTOR-independent phosphorylation of ULK1 at S758 during mitosis in asynchronous cells, we performed flow cytometry using phospho-specific antibodies to p-S10 H3 and p-S758 ULK1. While p-S10-H3-negative cells showed a striking reduction in p-S758 ULK1 in response to AZD8055, p-S10-H3-positive cells did not (Figure 5C). We extended these studies by high-content microscopy (Figures 5D, S6C, and S6D). Again p-S10-H3-negative cells showed a striking loss of p-S758 ULK1 upon treatment with AZD8055 or starvation/Hank’s balanced salt solution (HBSS), whereas mitotic cells (p-S10 H3 positive) did not. Finally, supporting our previous findings with mitotic shake-off (Figure 4C), cells treated with paclitaxel only showed mTOR-independent phosphorylation of p-S758 ULK1 in the mitotic fraction (Figures 5D, S6C, and S6D).
CDK1-Dependent Mitotic Phosphorylation of Autophagy Regulators Occurs at Known Repressive Sites
The preceding results suggested that the mTOR-independent, mitotic hyperphosphorylation of ARs might occur at known repressive sites that are normally phosphorylated by mTORC1 during interphase. To test whether this could be due to direct phosphorylation by CCNB1-CDK1, we purified bacterially expressed glutathione S-transferase (GST)-fusion proteins containing regions of ARs that are usually phosphorylated by mTORC1. Specifically, these were ATG13 194–282 (S259), ULK1 706–827 (S758), ATG14 348–470 (S383 and S440), and TFEB 76–160 (S122 and S142). Notably, these known repressive sites were all proline-directed serines (pS-P), consistent with minimal phospho-acceptor motif for CDK1. CCNB1-CDK1 complexes phosphorylated all of the GST fusion proteins in vitro, and this was inhibited by low doses of two CDK1-selective inhibitors, RO-3306 (300 nM) and NU6102 (500 nM) (Figure 6A). Analysis of the in vitro kinase reactions of ATG13, ATG14, and ULK1 by liquid chromatography tandem mass spectrometry (LC-MS/MS) revealed that CCNB1-CDK1 phosphorylated the known mTORC1 sites, including S259 of ATG13, S758 of ULK1, and S383 and S440 of ATG14 (Table S2). For TFEB, phospho-specific antibodies showed that CDK1 directly phosphorylated TFEB at S122 and S142 in vitro (Figure 6B). To confirm this phosphorylation occurred in cells, we immunoprecipitated TFEB-GFP from HeLa WT-TFEB-GFP cells that had been treated with paclitaxel and/or AZD8055. In unsynchronized cells, treatment with AZD8055 reduced phosphorylation at the mTORC1 target sites S122 (Vega-Rubin-de-Celis et al., 2017) and S142 (Settembre et al., 2012) (Figure 6C). However, AZD8055 failed to reduce TFEB phosphorylation at these sites in cells treated with paclitaxel (Figure 6C).
Figure 6.

CDK1 Phosphorylates Autophagy Regulators at Known Repressive mTORC1-Directed Sites
(A) CCNB1-CDK1 kinase assays were performed using GST-tagged protein fragments as substrates and [γ-32P] ATP with or without 300 nM RO-3306 or 500 nM NU6102 (∗heavy-chain antibody from immunoprecipitation).
(B) Active CCNB1-CDK1 was treated with 300 nM RO-3306 where indicated, and “cold” CDK1 kinase assays were performed using GST-TFEB (76–160) as substrate and probed with the indicated antibodies.
(C) HeLa WT-TFEB-GFP cells were treated with 50 nM paclitaxel (16 h) and/or 1 μM AZD8055 (2 h). Input lysates and anti-GFP immunoprecipitates are shown; note that detection of specific p-S122 TFEB signal required immunoprecipitation of the protein (Vega-Rubin-de-Celis et al., 2017).
(D) Montage from Video S4. Asynchronous HeLa TFEB-GFP H2B-mCherry were treated with 1 μM AZD8055 for 1 h before transfer to a live-cell imaging incubator.
(E) HAP1 cells were treated with 50 nM paclitaxel (16 h) and/or 1μM AZD8055 (2 h).
(F) Quantification from fluorescent Li-Cor western blotting (E) is provided. p values were calculated using a one-way ANOVA (Tukey). ∗p < 0.05; ∗∗p < 0.01. Western blots and radiographs are from a single experiment are representative of three independent experiments.
To assess the functional consequences of mitotic phosphorylation, we focused on TFEB and ULK1. mTORC1-dependent phosphorylation represses TFEB by sequestering it in the cytoplasm, with S142 phosphorylation promoting nuclear export (Li et al., 2018, Napolitano et al., 2018). We therefore hypothesized that TFEB should be exported from the nucleus just prior to mitosis as CDK1 was activated. Indeed, live-cell imaging of HeLa cells expressing WT TFEB-GFP and H2B-mCherry and treated with AZD8055 showed rapid nuclear export of TFEB just prior to mitosis (Figure 6D; Video S4). TFEB did still maintain a punctate lysosomal association throughout mitosis (Figure S5E), in stark contrast to our findings for mTORC1 (Figure 2). This provides further evidence that alterations in Rag-GTPases were not responsible for mTORC1’s failure to localize to lysosomes, since Rag heteroduplex activity mediates TFEB’s localization to lysosomes independently of RAPTOR (Martina and Puertollano, 2013). Thus, TFEB was rapidly exported from the nucleus in an mTORC1-independent manner just prior to mitosis.
Asynchronous HeLa GFP-TFEB H2B-mCherry were treated with AZD8055 (1 μM) for one h prior to transfer to a live-cell imaging incubator (GFP-TFEB green; center: H2B-mCherry magenta; left). Similar results were obtained in 3 independent experiments.
Nutrient-responsive phosphorylation of ATG13 at S224 and S258 (human 259) represses ULK1 kinase activity (Puente et al., 2016). mTORC1 directly phosphorylates S259, while S224 is dependent upon AMPK. We performed mass spectrometry analysis of GFP-ATG13 immunoprecipitated from cells treated with paclitaxel and/or AZD8055. As expected, AZD8055 caused a striking reduction in S259 phosphorylation but had no effect on S224 phosphorylation (Table 1). Paclitaxel promoted a 2- to 3-fold increase in S224 phosphorylation (Table 1). Paclitaxel treatment also promoted the phosphorylation of S259 and largely prevented dephosphorylation of S259 in the presence of AZD8055 (Table 1), strongly suggesting this site is phosphorylated independently of mTORC1 during mitosis. Thus, ATG13 was phosphorylated at known repressive sites independently of mTOR during mitosis, consistent with our findings with ULK1 and TFEB.
Table 1.
ATG13 Is Phosphorylated at Known Repressive Sites during Mitosis
| Treatment (Fold Change to DMSO Control) |
||||||
|---|---|---|---|---|---|---|
| Paclitaxel | AZD8055 | Paclitaxel + AZD8055 | ||||
| Phosphopeptide phosphorylation site and relevant interphase kinase | Rep 1 | Rep 2 | Rep 1 | Rep 2 | Rep 1 | Rep 2 |
| TPPIMGIIIDHFVDRPYPSSSPMHPCNYR S224 (known AMPK-dependent site) | 3.55 | 2.07 | 0.94 | 0.96 | 3.86 | 3.00 |
| TAGEDTGVIYPSVEDSQEVCTTSFSTSPPSQLSSSR S259 (known mTOR site) | 1.75 | 1.90 | 0.15 | 0.19 | 0.81 | 1.05 |
HEK293 GFP-ATG13 cells were treated with paclitaxel (50 nM, 16 h) and/or AZD8055 (1 μM, 2 h). GFP-ATG13 was then immunoprecipitated, protease digested, and analyzed by liquid chromatography tandem mass spectrometry as outlined in STAR Methods. Data for two phosphopeptides are shown; during interphase, S224 is known to be phosphorylated in an AMPK-dependent manner and S259 by mTOR directly. Fold-change compared to DMSO control is presented for two independent replicate experiments.
Finally, since ULK1 and ATG13 were both phosphorylated at known repressive sites in mitosis, we investigated ULK1 activity in cells by assessing the phosphorylation of ATG14 at S29, a known ULK1 target site that promotes autophagy (Park et al., 2016), using quantitative immunofluorescent western blotting. Treatment of cells with AZD8055 inhibited mTORC1 (loss of p-T389 S6K), resulting in loss of the repressive p-S758 ULK1, activation of ULK1, and increased p-S29 ATG14 (Figures 6E and 6F). In contrast, in paclitaxel-treated cells, AZD8055 failed to promote loss of p-S758 ULK1, and there was no increase in p-S29 ATG14 (Figures 6E and 6F), indicating that ULK1 remained inactive in mitosis. Notably, paclitaxel-treated cells arrested in mitosis exhibited a striking reduction in p-T389 S6K, even in the absence of AZD8055, suggesting inactivation of mTORC1 in mitosis; this was consistent with our demonstration that mTORC1 failed to localize to lysosomes for activation in mitosis. These results were observed in HAP1 (Figure 6E) and HCT116 (Figure S7).
In summary, mTOR-independent mitotic phosphorylation of ATG13, ULK1, ATG14, and TFEB occurred at the same repressive phosphorylation sites as those targeted by mTOR in interphase. In the case of ULK1 and TFEB, this had the same functional consequences: inhibition of ULK1 and nuclear export/cytosolic sequestration of TFEB. Collectively, our results indicate that mTORC1 is inactivated during mitosis and that CDK1 takes over its functions to ensure a system-wide repression of autophagy.
Discussion
Our new data demonstrating the absence of autophagic puncta containing the ULK1 complex (a well-validated component of early autophagosomal structures) in mitotic cells provide strong and unambiguous support for the conclusion that autophagy is indeed inhibited at the earliest stages during mitosis. Critically, these core observations were made in HeLa, HEK293, and diploid MRC5 cells in the absence of any chemical mitotic poison (Figure 1). Indeed, the debate surrounding the regulation of endocytosis during mitosis (Fielding et al., 2012, Tacheva-Grigorova et al., 2013) has emphasized the need to confirm results obtained by pharmacological treatment with experiments in cells undergoing a natural or unperturbed mitosis.
We now demonstrate that this mitotic repression of autophagy is likely a result of ARs switching from mTOR-dependent to CDK1-dependent control during mitosis. That all these sites are proline directed (pS-P), that mitotic phosphorylation of these proteins was reversed by RO-3306, and that CCNB1-CDK1 phosphorylated these same sites in vitro strongly suggests that CDK1 is the kinase responsible for phosphorylating these sites during mitosis in cells. However, we cannot presently rule out additional contributions by CDK1-dependent kinases at other sites. Regardless, our results clearly reveal a system-wide repression of autophagosome synthesis during mitosis that is orchestrated by CDK1 and includes components involved early in autophagosome synthesis (ATG13 and ULK1) and maturation (ATG14) as well as those involved in maintaining autolysosome capacity (TFEB). CDK1-dependent inhibition of TFEB might not have a significant effect on autophagosome formation during the 90 min required for completion of mitosis, but prolonged inhibition of lysosome biogenesis may be more significant during chronic mitotic arrest elicited by chemotherapeutic agents such as paclitaxel. This overarching control of autophagy at multiple stages by CDK1 suggests a far more extensive repression of autophagy than originally proposed by single-site phosphorylation of VPS34 (Furuya et al., 2010). While these redundant mechanisms will ensure the rapid shutdown of autophagy during mitosis, regardless of nutrient status, they will prove challenging for future mechanistic studies; for example, it is highly unlikely that mutation of single sites or multiple sites in a single protein will be able to reinitiate autophagy in mitosis. Indeed, such approaches would also undermine mTOR-dependent regulation of autophagy in interphase.
Our results also provide a critical insight into the molecular mechanism underlying the suppression of mTOR activity during mitosis that necessitates the switch from mTOR to CDK1-dependent regulation. During mitosis, both mTOR and RAPTOR, the mTORC1-specific adaptor, failed to localize to lysosomes, where mTOR is normally activated by nutrients. Thus, mTOR was not activated in response to nutrients during mitosis, consistent with the loss of p-T389 S6K in paclitaxel-treated cells (Figure 6). While the RAPTOR-mTOR interaction remained intact, RAPTOR binding to the Rag GTPases was inhibited in mitotic cells. This correlated with the CDK-dependent hyperphosphorylation of RAPTOR, and phospho-mimetic mutation of seven known CDK1-dependent sites in RAPTOR strongly inhibited Rag binding. Thus, CDK1-dependent RAPTOR phosphorylation appears to be a (perhaps the) critical event for mitotic inhibition of mTORC1. This is consistent with the mTORC1-independent phosphorylation of autophagy components outlined here and the previously published CDK1-dependent hyperphosphorylation of 4E-BP1 in mitosis (Shuda et al., 2015). Indeed, our results and published work suggest that the mTORC1 phosphoproteome may be globally subverted by CDK1 during mitosis, so it will be important to examine other mTORC1 substrates such as Grb10 and LARP1, which, as far as we know, have not been investigated.
In summary, our results suggest a system-wide repression of autophagosome synthesis during mitosis that is orchestrated by CDK1-dependent inactivation of mTORC1 and a switch from mTORC1 to CDK1 for control of critical ARs. This effectively insulates the autophagy machinery from nutrient status so that autophagy cannot be activated during the vulnerable period of mitosis.
STAR★Methods
Key Resources Table
| REAGENT or RESOURCE | SOURCE | IDENTIFIER |
|---|---|---|
| Antibodies | ||
| 4E-BP1 | CST | #9452; RRID: AB_331692 |
| Actin | Sigma | #A5441; RRID: AB_476744 |
| ATG13 | CST | #13468; RRID: AB_2797419 |
| ATG14 | CST | #96752; RRID: AB_2737056 |
| CDK1 | Santa Cruz | #SC747; RRID: AB_631206 |
| Cyclin B1 | CST | #12231; RRID: AB_2783553 |
| Cyclin B1 | Thermo | #MS-868-P1ABX; RRID: AB_145331 |
| Cyclin B1 | Santa Cruz | #sc-245; RRID: AB_627338 |
| ERK1/2 | CST | #9102; RRID: AB_330744 |
| GFP | Roche | #11814460001; RRID: AB_390913 |
| GFP-Trap | Chromotek | #gta-20; RRID: AB_2631357 |
| GST | Santa Cruz | #SC138; RRID: AB_627677 |
| HA | Roche | #11867423001; RRID:AB_390918 |
| HA | Santa Cruz | #SC7392; RRID: AB_627809 |
| HA | Santa Cruz | #SC805; RRID:AB_631618 |
| LAMP2 | Abcam | #ab25631; RRID: AB_470709 |
| LC3B | CST | #2775; RRID: AB_915950 |
| mTOR | CST | #2983; RRID: AB_2105622 |
| P-AKT (473) | CST | #4060; RRID: AB_2315049 |
| P-ATG14 (S29) | CST | #13155; RRID:AB_2798133 |
| P-ERK1/2 (T202/204) | CST | #9101; RRID: AB_331646 |
| P-H3 (S10) Mouse – IF,FC | CST | #9706; RRID: AB_331748 |
| P-H3 (S10) Rabbit – WB,IF | Sigma | SC8656; RRID: AB_2233067 |
| P-S6K (T389) | CST | #9205; RRID: AB_330944 |
| P-TFEB (S122) | Bethyl Validation: (Vega-Rubin-de-Celis et al., 2017) | #A300-BL13169; RRID: AB_2797420 |
| P-TFEB (S142) | Sigma Validation: (Li et al., 2018) | #SAB4503940; RRID: AB_2797421 |
| P-ULK1 (S758) –FC,IF | CST | #14202; RRID: AB_2665508 |
| P-ULK1 (S758) –WB | CST | #6888; RRID: AB_10829226 |
| RagA | CST | #4357; RRID: AB_10545136 |
| RagC | CST | #3360; RRID: AB_2180068 |
| RAPTOR | CST | #2280; RRID: AB_561245 |
| S6K | CST | #9202; RRID: AB_331676 |
| TFE3 | CST | #14779; RRID:AB_2687582 |
| TFEB | CST | #4240; RRID: AB_11220225 |
| ULK1 | Sigma | #SC33182; RRID: AB_2214706 |
| WIPI2 | CST | #MCA5780GA; RRID: AB_10845951 |
| Secondary antibodies | ||
| Goat anti-rabbit 488 | Invitrogen | #A11034; RRID: AB_2576217 |
| Goat anti-mouse 488 | Invitrogen | #A11029; RRID: AB_2534088 |
| Goat anti-rabbit 568 | Invitrogen | #A11011; RRID: AB_143157 |
| Goat anti-mouse 568 | Invitrogen | #A11004; RRID: AB_2534072 |
| Goat anti-mouse 647 | Invitrogen | #A21235; RRID: AB_2535804 |
| Highly cross-absorbed goat anti-mouse 647 | Invitrogen | #A21236; RRID: AB_2535805 |
| Goat anti-rat 488 | Invitrogen | #A11006; RRID:AB_2534074 |
| Anti-mouse (Dylight 800) | CST | #5257; RRID: AB_10693543 |
| Anti-Rabbit (Dylight 800) | CST | #5151; RRID: AB_10697505 |
| Goat anti-mouse HRP-conjugate | Bio-rad | #170-6516; RRID: AB_11125547 |
| Goat anti-rabbit HRP-conjugate | Bio-rad | #170-6515; RRID: AB_11125142 |
| Bacterial and Virus Strains | ||
| E. coli DH5α | NEB | #C2987H |
| E. coli BL21 (DE3) | NEB | #C2527 |
| Deposited Data | ||
| Uncropped western blots | Mendeley Data | https://doi.org/10.17632/cp9rjyzfph.1 |
| Experimental Models: Cell Lines (Sex) | ||
| Human: HCT116 (Male) | Laboratory of Bert Vogelstein | RRID: CVCL_0291 |
| Human: COLO205 (Male) | ATCC | Cat#CCL-222; RRID: CVCL_0218 |
| Human: A549 (Male) | ATCC | Cat#CCL-185; RRID: CVCL_0023 |
| Human: HT29 (Female) | ATCC | Cat#HTB-38; RRID: CVCL_0320 |
| Human: HEK293 | ATCC | RRID: CRL-11268 |
| Human: HeLa (Female) | ATCC | RRID: CCL-2 |
| Human: HeLa TFEB-GFP | This study | N/A |
| Human: HeLa Δ30-TFEB-GFP | This study | N/A |
| Human: HEK293 GFP-ATG13 | (Karanasios et al., 2013) | N/A |
| Human: HAP1 (Male) | Horizon | N/A |
| Human: HAP1 GFP-RAPTOR | (Manifava et al., 2016) | N/A |
| Human: HeLa TFEB-GFP H2B-mCherry | This study | N/A |
| Human: HEK293 GFP-ATG13 H2B-mCherry | This study | N/A |
| Human: Phoenix-Ampho | Laboratory of Garry Nolan | N/A |
| Recombinant DNA | ||
| pEGFP-N1-TFEB | (Roczniak-Ferguson et al., 2012) | Addgene #38119 |
| pEGFP-N1-delta30-TFEB | (Roczniak-Ferguson et al., 2012) | Addgene #44445 |
| pCDNA3 H2B-mCherry | (Nam & Benezra, 2009) | Addgene #20972 |
| pGEX-4T1-ATG13 (194-282) | This study | N/A |
| pGEX-4T1-ATG14 (348-470) | This study | N/A |
| pGEX-4T1-ULK1 (706-827) | This study | N/A |
| pGEX-4T1-TFEB (76-160) | This study | N/A |
| pRK5-HA-hULK1 | (Jung et al., 2009) | Addgene #31963 |
| pOPH10-ATG13 | (Karanasios et al., 2013) | N/A |
| pEGFP-C1-hAtg14 | (Itakura et al., 2008) | Addgene #24295 |
| FH-pBabe-Raptor(WT) | (Ramírez-Valle et al., 2010) | Gift from Robert Schneider |
| FH-pBabe-Raptor(A7) | (Ramírez-Valle et al., 2010) | Gift from Robert Schneider |
| FH-pBabe-Raptor(D7) | (Ramírez-Valle et al., 2010) | Gift from Robert Schneider |
| pmRFP-EGFP-rLC3 | Gift from Tamotsu Yoshimori | |
| pRK5-HA GST RagB WT | (Sancak et al., 2008) | Addgene #19301 |
| pRK5-HA GST RagB Q99L (GTP) | (Sancak et al., 2008) | Addgene #19303 |
| pRK5-HA GST RagD WT | (Sancak et al., 2008) | Addgene #19307 |
| pRK5-HA GST RagD S77L (GDP) | (Sancak et al., 2008) | Addgene #19308 |
| Software and Algorithms | ||
| Imaris Algorithim: Spot counting function → threshold: → Quality above (x) | Bitplane | https://imaris.oxinst.com |
| GraphPad Prism 7 | GraphPad Software | https://www.graphpad.com/scientific-software/prism/ |
| FlowJo | FlowJo LLC | https://www.flowjo.com/solutions/flowjo |
| Fiji | Opensource (Schindelin et al., 2012) | https://fiji.sc/ |
Lead Contact and Materials Availability
The Lead Contact for this study is Simon Cook (simon.cook@babraham.ac.uk). All unique/stable reagents generated in this study are available from the Lead Contact with a completed Materials Transfer Agreement.
Experimental Model and Subject Details
All cell lines used in this study were cultured in an atmosphere of 37°C, 5% CO2, 95% humidity. The cell lines used are outlined within individual legends and the STAR methods table (where information regarding the sex of cells is also found). All cell lines were authenticated by Short Tandem Repeat (STR) profiling and confirmed negative for mycoplasma prior to experiments commencing.
Method Details
Materials
Cell culture reagents were purchased from GIBCO Life Technologies. RO-3306 (CDK1 inhibitor), AZD8055 (mTOR inhibitor) and trametinib (MEK1/2 inhibitor) were purchased from Selleckchem. Bovine Serum Albumin (BSA), DMSO, paclitaxel (microtubule stabilizing agent), nocodazole (microtubule de-polymerizing agent), roscovitine (pan-CDK inhibitor) and Hanks Balanced Salt Solution (HBSS, #H8264) were purchased from Sigma. NU6102 (CDK1/2 inhibitor) was a kind gift from Prof Herbie Newell, Northern Institute for Cancer Research, Newcastle, UK.
Cell culture
A549, COLO205 and HT29 cells were purchased from ATCC (Manassas, VA, USA). HCT116 cells were provided by Bert Vogelstein, John Hopkins University. Cells were cultured in medium comprising Lebovitz L-15 (SW620), IMDM (HAP-1 cells), RPMI 1640 (COLO205 cells), McCoy’s 5A (HT29 cells) and Dulbecco’s modified Eagle’s medium (A549, HCT116, HeLa and HEK293 cells). All media solutions were supplemented with glucose (4.5 mg ml-1), penicillin (100 μg ml-1), streptomycin (100 μg ml-1), L-glutamine (1 mM), fetal bovine serum (10% v/v). HeLa WT-TFEB-GFP, HeLa Δ30-TFEB-GFP and HEK293 GFP-ATG13 were cultured in normal growth media supplemented with G418 (400 ng ml-1).
Transfection
Cells were cultured to approximately 60% confluency. Constructs were then transfected using JetPrime polyplus transfection reagent (HeLa) or lipofectamine 2000 (HEK293) as per manufacturer’s instructions. The Rag WT duplex consisted of RagBWT and RagDWT, while the active Rag heteroduplex consisted of RagBGTP; Q99L and RagDGDP; S77L.
Generation of stable cell lines
For the generation of HeLa WT-TFEB-GFP and Δ30-TFEB-GFP (gifts from Shawn Ferguson (Roczniak-Ferguson et al., 2012), (Addgene plasmids #38119 and #44445 respectively)). HeLa cells were transfected with the respective construct (Jetprime Polyplus). Cells were then cultured for 2 weeks prior to single-cell cloning by limiting dilution. Clones were then screened for GFP expression by western blot and positive clones taken forward.
For the generation of HEK293 GFP-ATG13 H2B-mCherry and HeLa TFEB-GFP H2B-mCherry, cells were transfected with H2B-mCherry (a gift from Robert Benezra (Nam and Benezra, 2009) (Addgene plasmid #20972)) (HEK293, Lipofectamine 2000; HeLa, JetPrime). Cells were then cultured for 2 weeks, and subsequently single-cell sorted by flow cytometry selecting for cells expressing both GFP and mCherry. After two weeks, clones were then screened using IN Cell Analyzer 6000 confocal microscope for mCherry expression and positive clones taken forward.
Treatments
Cells were treated with indicated compounds as outlined. For RO-3306 release experiments, cells were treated with RO-3306 (9 μM) for 20 hours prior to being washed with PBS and released into fresh pre-warmed media. For the AZD8055 treatment arm, 1 μM AZD8055 was added for two hours, prior to release into fresh pre-warmed media supplemented with 1 μM AZD8055.
For starvation media treatment, cells were washed with pre-warmed starvation media (Hanks Balanced Salt Solution (Sigma #H8264) supplemented with 1% BSA w/v) and then incubated in starvation media which, where necessary, was supplemented with indicated compounds. For ‘re-feed’ experiments starvation media was replaced with complete growth media for the indicated times.
Immunoflourescence
Cells were cultured in CellCarrier-96 plates (PerkinElmer) or on 22 mm glass coverslips. Two hours prior to fixation, cells were treated with indicated compounds or starvation media. Cells were then fixed in 4% Paraformaldehyde for 15 minutes at room temperature. Permeabilisation was performed with ice-cold methanol for 10 minutes at −20°C (ATG13, WIPI2, p-S10 H3), or 0.2% Triton X-100/PBS for 5 minutes at room temperature (mTOR, LAMP2, HA, p-S758 ULK1). After two washes in PBS for 5 minutes, cells were then incubated in blocking buffer (1% BSA, 0.02% Triton X-100, 5% goat serum, PBS) for one hour at room temperature. Incubation with ATG13 (1:100), WIPI2 (1:200), p-S10 H3 (1:200; HCM:1:1000), p-S758 ULK1 (1:1000), mTOR (1:200) or LAMP2 (1:200) primary antibodies was performed overnight at 4°C, with subsequent incubation with Alexa Fluor secondary antibodies (1:500) for one hour at room temperature. Finally, DAPI was added at a concentration of 1 ug ml-1 or coverslips were mounted in VectaShield Hardset onto glass slides. Cells were then imaged using a 40x or 60x oil immersion objective on a Nikon A1R confocal microscope. Z stacks were acquired covering the entire cell volume at a spacing of 1 μM. Quantification of ATG13 and WIPI2 puncta was performed using Imaris spot counting function. Figures were prepared using ImageJ, with the same brightness/contrast across all conditions within an experiment. Images are representative of cells across three biological replicates. Images are max-intensity projections of z stacks encompassing the whole cell volume.
High content microscopy (HCM) images were acquired using an InCell 6000 system with a 20x air objective (open aperture). Analysis of images was performed using InCell 1000 analyzer software. A dedicated algorithm was developed whereby cells (determined by a multiscale top-hat) were divided into p-S10 H3 positive and negative populations based on cell intensity. p-S758 ULK1 intensity from the p-S10 H3 only control was then subtracted from average p-S758 ULK1 within a condition to calculate the total value for that condition.
Double Thymidine Block
Twenty-four hours after seeding, culture medium was supplemented with thymidine at a final concentration of 2 mM and cells incubated for 16 hours. Cells were released from G1/S block by washing in PBS and incubation in pre-warmed media for 8 hours. The second block was then initiated for 16 hours. Cells were then released as before for 10 hours. Two hours prior to lysis/ fixation treatments were added to culture medium as indicated.
Live cell imaging
HEK293 GFP-ATG13 H2B-mCherry or HEK293 mRFP-EGFP-LC3 cells were cultured in Ibidi 35mm high glass bottomed dishes (Thistle) for 24 hours. Four hours prior to imaging, cell media was replaced with fresh media. Cells were then treated as indicated prior to cells being transferred to a live-cell imaging stage where they were maintained in an atmosphere of 37°C, 5% CO2. Images were acquired using a spinning disk confocal microscope, comprising Nikon Ti-E stand, Nikon 60x 1.45 NA oil immersion lens, Yokogawa CSU-X scanhead, Andor iXon 897 EM-CCD camera, Andor laser combiner and OKO lab incubation. GFP and mCherry images were acquired with an exposure time of 100 ms (GFP-ATG13) or 150 ms (mRFP-EGFP-LC3), with z stacks comprising 45 and 50 images with 0.5 μm spacing (GFP-ATG13) or 30 images with 1 μm spacing (mRFP-EGFP-LC3). New image stacks were acquired every 3 minutes (GFP-ATG13) or 10 minutes (mRFP-EGFP-LC3). For GFP-ATG13, raw confocal images were deconvolved with Huygens Professional software (Scientific Volume Imaging), using the Classic Maximum Likelihood Estimation algorithm and a calculated point spread function.
HeLa TFEB-GFP H2B-mCherry cells were cultured in CellCarrier-96 plates (PerkinElmer) and treated with AZD8055 (1 μM) 1hr prior to imaging. Images were acquired using a Nikon Ti-E based wide-field imaging system equipped with a 20x 0.75 NA air lens, Hamamatsu Flash 4.0 camera, Lumencor Spectra-X LED illuminator and OKO lab incubator. Images were acquired every minute. All images were processed in ImageJ.
Retrovirus production
pBabe-Raptor (WT, A7, D7) vectors were kind gifts from Robert Schneider (Ramírez-Valle et al., 2010). These were transfected into Phoenix ampho cell lines (a kind gift from Garry Nolan) according to protocols outlined on the Nolan website https://web.stanford.edu/group/nolan/_OldWebsite/protocols/pro_helper_dep.html. Cells were plated into 10 cm dishes 24 hr before transfection. For transfections, 10 mg DNA was diluted into 438 μl of water, 62 μl of 2M CaCl2 was added, mixed and 500 μl HBS added dropwise (280 mM NaCl, 10 mM KCl, 1.5 mM Na2HPO4.2H2O, 12 mM D-glucose, 50 mM HEPES made up in water and pH adjusted to 7.05 using NaOH). DNA was allowed to complex for 10-15 mins and then added to cells. The media was changed after 24hrs. 48hrs after transfection the retroviral supernatant was used to infect HeLa cells. The following day the cells were passaged and 24hrs later selected with puromycin (2μg ml-1) for 2 weeks.
Western blot
Adherent and suspension cells were collected and washed with ice-cold PBS prior to lysis in RIPA buffer (50 mM Tris-HCl pH 8, 150 mM NaCl, 1% v/v Triton X-100, 1% w/v sodium deoxycholate, 0.1% w/v SDS, 50 mM NaF, 1 mM Na3VO4, 1 mM PMSF, 5 μg ml-1 aprotinin, 10 μg ml-1 leupeptin). Lysates were then clarified by centrifugation at 13,000 g for 10 minutes at 4°C. Protein quantification was performed using Pierce BCA assay, as per manufacturer’s instructions (ThermoFisher). Equal amounts of protein were then boiled with Laemelli sample buffer and fractionated by SDS-PAGE as described previously (Balmanno and Cook, 1999, Garner et al., 2002). Briefly, gels were run at 100V using a Hoefer Mighty Small system. Gels were then transferred to methanol-soaked PVDF membranes at 300 mA for 100 mins. Membranes were blocked in 5% Milk/TBST prior to incubation in indicated primary antibodies overnight. Secondary antibodies were then added for 1 hour prior to detection either through chemiluminescence (ECL) or fluorescence (LI-COR Odyssey).
Figure S6B: Cells were lysed in TG lysis buffer (20 mM Tris-HCl pH 7.6; 137 mM NaCl; 1% v/v Triton X-100; 10% glycerol; 1 mM EGTA; 1.5 mM MgCl2; 50 mM NaF; 1 mM Na3VO4; 1 mM PMSF; 10 μgml-1 leupeptin; 5 μgml-1 aprotinin) and protein quantification performed by Bradford assay (Bio-rad). Detection of blots after incubation in fluorescent secondaries (Cell Signaling Technologies) was performed using the LI-COR Odyssey system.
Immunoprecipitation
Cells were washed in ice-cold PBS and lysed in TG lysis buffer. Lysates were then clarified by centrifugation and protein quantification was performed using Bradford assay (Bio-rad) as per manufacturer’s instruction. Protein concentration was then equilibrated and 5%–10% of the lysate retained for input blots. The remaining lysate was then pre-cleared by incubation with protein A Sepharose beads for 30 minutes at 4°C. Lysates were then transferred to fresh protein A Sepharose beads and incubated with the relevant antibody for 2 hours at 4°C. Beads were washed three times in lysis buffer before resuspension in 1x sample buffer and boiled.
For immunoprecipitation of RAPTOR-GFP, cells were lysed in 0.3% CHAPS buffer (40 mM HEPES, 120 mM NaCl, 0.3% CHAPS, 1 mM EDTA, 50 mM NaF, 1 mM Na3VO4, 1 mM PMSF, 5 μg ml-1 aprotinin, 10 μg ml-1 leupeptin). Lysates were passed through a 25G needle five times prior to clarification (13,000 g for 10 minutes at 4°C). Protein quantification was performed by Bradford Assay. Lysate was then incubated with GFP-Trap agarose (Chromotek) for 1 hour at 4°C. Beads were then washed three times, and resuspended in sample buffer.
Membrane/ Cytosolic fractionation
Cells were collected and resuspended in isotonic buffer (20 mM HEPES pH 7.4, 250 mM sucrose, 0.5 mM EDTA, 50 mM NaF; 1 mM Na3VO4; 1 mM PMSF; 10 μg ml-1 leupeptin; 5 μg ml-1 aprotinin) and subsequently lysed by passing through a 25G needle 10 times. Lysates then underwent centrifugation at 900G for 1 minute at 4°C, to clear unlysed cells and interphase nuclei. Supernatant was then transferred to fresh tubes and underwent centrifugation at 21,000 g for 15 minutes at 4°C. The supernatant was then transferred to fresh tubes and kept as the cytosolic fraction. For the membranous fraction, the pellet was resuspended in isotonic buffer supplemented with 1% Triton X-100 (v/v) and 0.1% SDS (w/v). Whole cell lysates were acquired by direct lysis of cells in TG lysis buffer. All lysates were then equilibrated for protein concentration within their respective fraction after BCA assay, and boiled in sample buffer, prior to SDS-PAGE as described previously.
Phosphatase treatment
Cells were washed in ice-cold PBS prior to lysis in IP extraction buffer (50 mM Tris pH 7.5; 150 mM NaCl; 0.1% NP-40; 20 mM EGTA; 50 mM NaF; 1 mM Na3VO4; 1 mM PMSF; 10 μg ml-1 leupeptin; 5 μg ml-1 aprotinin). Immunoprecipitation was then performed as above prior to the resuspension in sample buffer. Complexed beads were then subsequently washed a further two times with PBS to remove phosphatase inhibitors. Beads were then resuspended in 150 μL of phosphatase buffer (50 mM HEPES pH 7.5, 100 mM NaCl, 2 mM DTT, 0.1% NP-40, 1 mM PMSF; 10 μg ml-1 leupeptin; 5 μg ml-1 aprotinin) and separated into two 75 μL aliquots. 600U of lambda phosphatase was then added to one aliquot and both aliquots were incubated for 30 minutes at 30°C. Beads were then washed once with PBS and resuspended in sample buffer prior to SDS-PAGE fractionation as outlined previously.
For phosphatase treatment of whole cell lysates, cells were lysed in phosphatase buffer, clarified by centrifugation, and protein concentration measured by Bradford assay. After equilibration of protein concentration, 70 μL aliquots of lysate were incubated in the presence or absence of 3000U lambda phosphatase for 1 hour at 30°C. Lysates were then boiled with 4X sample buffer and underwent SDS-PAGE fractionation as outlined previously.
Mitotic shake off
Flasks were repeatedly tapped, and the dislodged cells pelleted by centrifugation at 1500 g for 3 minutes. Adherent cells and pelleted mitotically enriched cells were then washed with ice-cold PBS and lysed in RIPA buffer as above.
Flow cytometry
Propidium Iodide staining was performed as previously described (Garner et al., 2002). Briefly, adherent and suspension cells were collected and fixed in 70% ethanol/PBS. Cells were then incubated in PI stain (50 μg ml-1 PI, 0.1 mg ml-1 RNase, PBS) for 30 min at 37°C.
For immunostaining, cells were collected and fixed in 70% ethanol/PBS. Permeabilisation was performed by resuspension of cells in 0.2% Triton X-100/PBS for 10 minutes at room temperature. p-S758 ULK1 and p-S10 H3 were diluted 1:200 in 1% BSA/PBS and cells incubated for 1 hour at room temperature. Cells were subsequently incubated in secondary antibodies (1:500) for 30 minutes. Cells were resuspended in 1% BSA/PBS prior to analysis. All flow cytometry was performed on a LSRII (BD Biosciences).
Analysis was performed using FlowJo version 10. To calculate p-S758 ULK1 intensity, mean intensity of the relevant subpopulation from the p-S10 H3 antibody-only control was subtracted from the mean intensity of the same subpopulation within the sample.
Recombinant protein expression
Protein fragments were PCR amplified from TFEB-GFP, pOPH10-ATG13, GFP-ATG14 and HA-ULK1, and sub-cloned into pGEX-4T1 vector using standard protocols. Construct was verified by Sanger sequencing (Genewiz). Primers for PCR amplification were as follows:
TFEB (76–160)
Fwd (with BamHI): TAACGGATCCCTGGAGAATCCCACATCC
Rev (with EcoRI and stop codon): TAACGAATTCTCAGACATCATCCAACTCCCTCT
ATG13 194–282
Fwd (with BamHI): TAACGGATCCGCATTCATGTCTACCAGG
Rev (with EcoRI and stop codon): TAACGAATTCTCAGTCAGCTGATCCAACGCC
ULK1 (706–827)
Fwd (with BamHI): TAACGGATCCGCGTTTGGGACACAAGCC
Rev (with EcoRI and stop codon): TAACGAATTCTCAGGCCTCGAAGGTCACAGC
ATG14 (348–470)
Fwd (with EcoRI): TAACGAATTCGTGAAGAAACTGAATGC
Rev (with XHOI and stop codon): TAACCTCGAGTCATGCACTGCTGCTCGCGATG
pGEX constructs were then used to transform BL21 (DE3) cells as per manufacturer’s instruction (New England Biolabs). At OD600 = 0.6, cells were induced with 0.3 mM IPTG and maintained for 16 hours at 21°C. Cells were lysed in bacteria lysis buffer (1% Triton, 2 mM EDTA, 2 mM DTT, 200 μM PMSF, 5 μg ml-1 aprotinin, PBS). Recombinant proteins were then purified from bacterial lysates with glutathione-Sepharose beads (GE healthcare). Elution was performed by glutathione competition (10 mM reduced glutathione, 50 mM Tris pH 8), and eluates were dialysed using a 20kDa cut-off Slide-A-lyzer cassette (Thermo). Protein concentration was performed by Bradford assay against a BSA standard curve.
CCNB1-CDK1 kinase assay
HAP-1 cells were treated with paclitaxel (50 nM) for 16 hours prior to lysis in IP extraction buffer. Lysates were then clarified by centrifugation at 13,000 g for 10 minutes at 4°C and pre-cleared with protein A Sepharose for 30 minutes at 4°C. Subsequently, cyclin B1 (CCNB1) was immunoprecipitated with monoclonal cyclin B1 antibody (GNS1) for 2 hours at 4°C. Immunoprecipitates were washed twice with high-salt wash buffer (50 mM Tris pH 7.5; 500 mM NaCl; 0.1% NP-40; 20 mM EGTA; 50 mM NaF; 1 mM Na3VO4; 1 mM PMSF; 10 μg ml-1 leupeptin; 5 μg ml-1 aprotinin) and once with 50 mM Tris pH 7.6. Immunoprecipitated CDK1 was then incubated in kinase buffer (50 mM Tris pH 7.6, 100 μM EGTA) in the presence or absence of RO-3306 (300 nM) or NU6102 (500 nM) for 15 minutes on ice. 300 ng of substrate, MgCl2 (10 mM) and ATP (100 μM) was then added, and the reaction mixture incubated in a shaking incubator for 15 minutes at 30°C. For experiments involving radioactivity, 2 μCi [γ-32P] ATP was added to the reaction mixture. The reaction was terminated by the addition of 4X sample buffer, with subsequent steps (western blot) performed as above.
Mass spectrometry
GFP-ATG13 was immunoprecipitated from HEK293 GFP-ATG13 lysates as above. Coomassie-stained GFP-ATG13 or GST-tagged protein fragment gel bands were excised, destained, reduced, carbamidomethylated, and proteolytically digested (with trypsin or AspN) essentially as previously described (Webster and Oxley, 2009).
Digests were either analyzed directly, or were first enriched for phosphopeptides using titanium dioxide beads (Titansphere, GL Sciences). Peptides were separated on a reversed-phase column (0.075 × 150mm, Reprosil-Pur C18AQ, 2.1um particles) with a 30 min linear gradient from 2 to 40% acetonitrile (containing 0.1% formic acid) at a flow rate of 300 nl/min, using an UltiMate 3000 nanoHPLC (Thermo Scientific). The column was interfaced to a Q-Exactive mass spectrometer (Thermo Scientific) operating in either data-dependent MS2 mode (for peptide identification), or parallel reaction monitoring mode (for targeted peptide quantitation).
Mass spectral data were processed using Proteome Discoverer 1.4 (Thermo Scientific) and submitted to Mascot (Matrix Science) for database searching. All identified phosphopeptides were manually validated. Quantitative information from targeted runs was extracted from the MS1 and MS2 data using Skyline software (MacCoss Lab, University of Washington).
Quantification and Statistical Analysis
One-way and Two-way Anova (Tukey) were performed on paired raw-values as indicated using Graphpad Prism 8. For the purposes of figures p < 0.05 (∗), p < 0.01 (∗∗), p < 0.001 (∗∗∗), p < 0.0001 (∗∗∗∗). For the purposes of graphical representation, raw values were made relative to the untreated control sample. Where indicated ‘n’ is the number of independent biological replicates, and ‘SD’ is the standard deviation across these replicates.
Data and Code Availability
Source data are deposited in Mendeley data DOI: https://doi.org/10.17632/cp9rjyzfph.1
Acknowledgments
We thank members of the Cook lab, the Babraham Institute Flow Cytometry team, Anne Segonds-Pinchon, and Maria Manifava for their advice and support. This work was supported by Institute Strategic Programme grant BB/P013384/1 (BBS/E/B/000C0432 and BBS/E/B/000C0434) from the Biotechnology and Biological Sciences Research Council (S.J.C., N.T.K., and O.F.) and Cancer Research UK Career Development award C47718/A16337 (O.F.). R.I.O. is funded by a Medical Research Council PhD studentship, the Frank Edward Elmore Fund, and the James Baird Fund.
Author Contributions
Conceptualization, R.I.O. and S.J.C.; Methodology, R.I.O., S.A.W., D.O., A.M.K., K.B., R.G., H.O., and S.J.C.; Validation, A.M.K.; Analysis, R.I.O., S.A.W., D.O., and A.M.K.; Investigation, R.I.O., S.A.W., D.O., A.M.K., K.B., and O.F.; Resources, N.T.K. and S.J.C.; Writing – Original Draft, R.I.O. and S.J.C.; Writing – Review & Editing, R.I.O., O.F., N.T.K., and S.J.C.; Visualization, R.I.O. and S.J.C.; Supervision, Administration, & Funding Acquisition, S.J.C. All authors approved the submitted manuscript.
Declaration of Interests
The authors declare no competing interests.
Published: November 13, 2019
Footnotes
Supplemental Information can be found online at https://doi.org/10.1016/j.molcel.2019.10.016.
Contributor Information
Richard I. Odle, Email: richard.odle@babraham.ac.uk.
Simon J. Cook, Email: simon.cook@babraham.ac.uk.
Supplemental Information
References
- Andonegui-Elguera M.A., Cáceres-Gutiérrez R.E., Luna-Maldonado F., López-Saavedra A., Díaz-Chávez J., Cisneros-Soberanis F., Prada D., Mendoza-Pérez J., Herrera L.A. BUB1 and SURVIVIN proteins are not degraded after a prolonged mitosis and accumulate in the nuclei of HCT116 cells. Cell Death Discov. 2016;2:16079. doi: 10.1038/cddiscovery.2016.79. [DOI] [PMC free article] [PubMed] [Google Scholar]
- Balmanno K., Cook S.J. Sustained MAP kinase activation is required for the expression of cyclin D1, p21Cip1 and a subset of AP-1 proteins in CCL39 cells. Oncogene. 1999;18:3085–3097. doi: 10.1038/sj.onc.1202647. [DOI] [PubMed] [Google Scholar]
- Chadebech P., Truchet I., Brichese L., Valette A. Up-regulation of cdc2 protein during paclitaxel-induced apoptosis. Int. J. Cancer. 2000;87:779–786. [PubMed] [Google Scholar]
- Chang D.C., Xu N., Luo K.Q. Degradation of cyclin B is required for the onset of anaphase in Mammalian cells. J. Biol. Chem. 2003;278:37865–37873. doi: 10.1074/jbc.M306376200. [DOI] [PubMed] [Google Scholar]
- Chresta C.M., Davies B.R., Hickson I., Harding T., Cosulich S., Critchlow S.E., Vincent J.P., Ellston R., Jones D., Sini P. AZD8055 is a potent, selective, and orally bioavailable ATP-competitive mammalian target of rapamycin kinase inhibitor with in vitro and in vivo antitumor activity. Cancer Res. 2010;70:288–298. doi: 10.1158/0008-5472.CAN-09-1751. [DOI] [PubMed] [Google Scholar]
- Cope C.L., Gilley R., Balmanno K., Sale M.J., Howarth K.D., Hampson M., Smith P.D., Guichard S.M., Cook S.J. Adaptation to mTOR kinase inhibitors by amplification of eIF4E to maintain cap-dependent translation. J. Cell Sci. 2014;127:788–800. doi: 10.1242/jcs.137588. [DOI] [PubMed] [Google Scholar]
- Doménech E., Maestre C., Esteban-Martínez L., Partida D., Pascual R., Fernández-Miranda G., Seco E., Campos-Olivas R., Pérez M., Megias D. AMPK and PFKFB3 mediate glycolysis and survival in response to mitophagy during mitotic arrest. Nat. Cell Biol. 2015;17:1304–1316. doi: 10.1038/ncb3231. [DOI] [PubMed] [Google Scholar]
- Dooley H.C., Razi M., Polson H.E.J., Girardin S.E., Wilson M.I., Tooze S.A. WIPI2 links LC3 conjugation with PI3P, autophagosome formation, and pathogen clearance by recruiting Atg12-5-16L1. Mol. Cell. 2014;55:238–252. doi: 10.1016/j.molcel.2014.05.021. [DOI] [PMC free article] [PubMed] [Google Scholar]
- Eskelinen E.-L., Prescott A.R., Cooper J., Brachmann S.M., Wang L., Tang X., Backer J.M., Lucocq J.M. Inhibition of autophagy in mitotic animal cells. Traffic. 2002;3:878–893. doi: 10.1034/j.1600-0854.2002.31204.x. [DOI] [PubMed] [Google Scholar]
- Fielding A.B., Willox A.K., Okeke E., Royle S.J. Clathrin-mediated endocytosis is inhibited during mitosis. Proc. Natl. Acad. Sci. USA. 2012;109:6572–6577. doi: 10.1073/pnas.1117401109. [DOI] [PMC free article] [PubMed] [Google Scholar]
- Florey O., Kim S.E., Sandoval C.P., Haynes C.M., Overholtzer M. Autophagy machinery mediates macroendocytic processing and entotic cell death by targeting single membranes. Nat. Cell Biol. 2011;13:1335–1343. doi: 10.1038/ncb2363. [DOI] [PMC free article] [PubMed] [Google Scholar]
- Fujiwara Y., Kikuchi H., Aizawa S., Furuta A., Hatanaka Y., Konya C., Uchida K., Wada K., Kabuta T. Direct uptake and degradation of DNA by lysosomes. Autophagy. 2013;9:1167–1171. doi: 10.4161/auto.24880. [DOI] [PMC free article] [PubMed] [Google Scholar]
- Furuya T., Kim M., Lipinski M., Li J., Kim D., Lu T., Shen Y., Rameh L., Yankner B., Tsai L.-H., Yuan J. Negative regulation of Vps34 by Cdk mediated phosphorylation. Mol. Cell. 2010;38:500–511. doi: 10.1016/j.molcel.2010.05.009. [DOI] [PMC free article] [PubMed] [Google Scholar]
- Ganley I.G., Lam H., Wang J., Ding X., Chen S., Jiang X. ULK1.ATG13.FIP200 complex mediates mTOR signaling and is essential for autophagy. J. Biol. Chem. 2009;284:12297–12305. doi: 10.1074/jbc.M900573200. [DOI] [PMC free article] [PubMed] [Google Scholar]
- Garner A.P., Weston C.R., Todd D.E., Balmanno K., Cook S.J. Δ MEKK3:ER∗ activation induces a p38 α/β 2-dependent cell cycle arrest at the G2 checkpoint. Oncogene. 2002;21:8089–8104. doi: 10.1038/sj.onc.1206000. [DOI] [PubMed] [Google Scholar]
- Greenberg V.L., Zimmer S.G. Paclitaxel induces the phosphorylation of the eukaryotic translation initiation factor 4E-binding protein 1 through a Cdk1-dependent mechanism. Oncogene. 2005;24:4851–4860. doi: 10.1038/sj.onc.1208624. [DOI] [PubMed] [Google Scholar]
- Güttinger S., Laurell E., Kutay U. Orchestrating nuclear envelope disassembly and reassembly during mitosis. Nat. Rev. Mol. Cell Biol. 2009;10:178–191. doi: 10.1038/nrm2641. [DOI] [PubMed] [Google Scholar]
- Hay N., Sonenberg N. Upstream and downstream of mTOR. Genes Dev. 2004;18:1926–1945. doi: 10.1101/gad.1212704. [DOI] [PubMed] [Google Scholar]
- Heald R., McKeon F. Mutations of phosphorylation sites in lamin A that prevent nuclear lamina disassembly in mitosis. Cell. 1990;61:579–589. doi: 10.1016/0092-8674(90)90470-y. [DOI] [PubMed] [Google Scholar]
- Heesom K.J., Gampel A., Mellor H., Denton R.M. Cell cycle-dependent phosphorylation of the translational repressor eIF-4E binding protein-1 (4E-BP1) Curr. Biol. 2001;11:1374–1379. doi: 10.1016/s0960-9822(01)00422-5. [DOI] [PubMed] [Google Scholar]
- Hosokawa N., Hara T., Kaizuka T., Kishi C., Takamura A., Miura Y., Iemura S., Natsume T., Takehana K., Yamada N. Nutrient-dependent mTORC1 association with the ULK1-Atg13-FIP200 complex required for autophagy. Mol. Biol. Cell. 2009;20:1981–1991. doi: 10.1091/mbc.E08-12-1248. [DOI] [PMC free article] [PubMed] [Google Scholar]
- Itakura E., Kishi C., Inoue K., Mizushima N. Beclin 1 forms two distinct phosphatidylinositol 3-kinase complexes with mammalian Atg14 and UVRAG. Mol. Biol. Cell. 2008;19:5360–5372. doi: 10.1091/mbc.E08-01-0080. [DOI] [PMC free article] [PubMed] [Google Scholar]
- Itakura E., Mizushima N. Characterization of autophagosome formation site by a hierarchical analysis of mammalian Atg proteins. Autophagy. 2010;6:764–776. doi: 10.4161/auto.6.6.12709. [DOI] [PMC free article] [PubMed] [Google Scholar]
- Jacquin E., Leclerc-Mercier S., Judon C., Blanchard E., Fraitag S., Florey O. Pharmacological modulators of autophagy activate a parallel noncanonical pathway driving unconventional LC3 lipidation. Autophagy. 2017;13:854–867. doi: 10.1080/15548627.2017.1287653. [DOI] [PMC free article] [PubMed] [Google Scholar]
- Jakhar R., Luijten M.N.H., Wong A.X.F., Cheng B., Guo K., Neo S.P., Au B., Kulkarni M., Lim K.J., Maimaiti J. Autophagy governs protumorigenic effects of mitotic slippage-induced senescence. Mol. Cancer Res. 2018;16:1625–1640. doi: 10.1158/1541-7786.MCR-18-0024. [DOI] [PubMed] [Google Scholar]
- Jung C.H., Jun C.B., Ro S.-H., Kim Y.-M., Otto N.M., Cao J., Kundu M., Kim D.-H. ULK-Atg13-FIP200 complexes mediate mTOR signaling to the autophagy machinery. Mol. Biol. Cell. 2009;20:1992–2003. doi: 10.1091/mbc.E08-12-1249. [DOI] [PMC free article] [PubMed] [Google Scholar]
- Jung C.H., Ro S.-H., Cao J., Otto N.M., Kim D.-H. mTOR regulation of autophagy. FEBS Lett. 2010;584:1287–1295. doi: 10.1016/j.febslet.2010.01.017. [DOI] [PMC free article] [PubMed] [Google Scholar]
- Karanasios E., Stapleton E., Manifava M., Kaizuka T., Mizushima N., Walker S.A., Ktistakis N.T. Dynamic association of the ULK1 complex with omegasomes during autophagy induction. J. Cell Sci. 2013;126:5224–5238. doi: 10.1242/jcs.132415. [DOI] [PubMed] [Google Scholar]
- Kim J., Guan K.-L. Amino acid signaling in TOR activation. Annu. Rev. Biochem. 2011;80:1001–1032. doi: 10.1146/annurev-biochem-062209-094414. [DOI] [PubMed] [Google Scholar]
- Kim J., Kundu M., Viollet B., Guan K.-L. AMPK and mTOR regulate autophagy through direct phosphorylation of Ulk1. Nat. Cell Biol. 2011;13:132–141. doi: 10.1038/ncb2152. [DOI] [PMC free article] [PubMed] [Google Scholar]
- Kong D., Yamori T. ZSTK474 is an ATP-competitive inhibitor of class I phosphatidylinositol 3 kinase isoforms. Cancer Sci. 2007;98:1638–1642. doi: 10.1111/j.1349-7006.2007.00580.x. [DOI] [PMC free article] [PubMed] [Google Scholar]
- Li Z., Ji X., Wang D., Liu J., Zhang X. Autophagic flux is highly active in early mitosis and differentially regulated throughout the cell cycle. Oncotarget. 2016;7:39705–39718. doi: 10.18632/oncotarget.9451. [DOI] [PMC free article] [PubMed] [Google Scholar]
- Li L., Friedrichsen H.J., Andrews S., Picaud S., Volpon L., Ngeow K., Berridge G., Fischer R., Borden K.L.B., Filippakopoulos P., Goding C.R. A TFEB nuclear export signal integrates amino acid supply and glucose availability. Nat. Commun. 2018;9:2685. doi: 10.1038/s41467-018-04849-7. [DOI] [PMC free article] [PubMed] [Google Scholar]
- Liu M., Aneja R., Liu C., Sun L., Gao J., Wang H., Dong J.-T., Sarli V., Giannis A., Joshi H.C., Zhou J. Inhibition of the mitotic kinesin Eg5 up-regulates Hsp70 through the phosphatidylinositol 3-kinase/Akt pathway in multiple myeloma cells. J. Biol. Chem. 2006;281:18090–18097. doi: 10.1074/jbc.M601324200. [DOI] [PubMed] [Google Scholar]
- Liu L., Xie R., Nguyen S., Ye M., McKeehan W.L. Robust autophagy/mitophagy persists during mitosis. Cell Cycle. 2009;8:1616–1620. doi: 10.4161/cc.8.10.8577. [DOI] [PMC free article] [PubMed] [Google Scholar]
- Loukil A., Zonca M., Rebouissou C., Baldin V., Coux O., Biard-Piechaczyk M., Blanchard J.-M., Peter M. High-resolution live-cell imaging reveals novel cyclin A2 degradation foci involving autophagy. J. Cell Sci. 2014;127:2145–2150. doi: 10.1242/jcs.139188. [DOI] [PubMed] [Google Scholar]
- Ma X.M., Blenis J. Molecular mechanisms of mTOR-mediated translational control. Nat. Rev. Mol. Cell Biol. 2009;10:307–318. doi: 10.1038/nrm2672. [DOI] [PubMed] [Google Scholar]
- Ma H.T., Poon R.Y.C. Synchronization of HeLa cells. Methods Mol. Biol. 2017;1524:189–201. doi: 10.1007/978-1-4939-6603-5_12. [DOI] [PubMed] [Google Scholar]
- Mackeh R., Perdiz D., Lorin S., Codogno P., Poüs C. Autophagy and microtubules - new story, old players. J. Cell Sci. 2013;126:1071–1080. doi: 10.1242/jcs.115626. [DOI] [PubMed] [Google Scholar]
- Manifava M., Smith M., Rotondo S., Walker S., Niewczas I., Zoncu R., Clark J., Ktistakis N.T. Dynamics of mTORC1 activation in response to amino acids. eLife. 2016;5:e19960. doi: 10.7554/eLife.19960. [DOI] [PMC free article] [PubMed] [Google Scholar]
- Martina J.A., Puertollano R. Rag GTPases mediate amino acid-dependent recruitment of TFEB and MITF to lysosomes. J. Cell Biol. 2013;200:475–491. doi: 10.1083/jcb.201209135. [DOI] [PMC free article] [PubMed] [Google Scholar]
- Martina J.A., Chen Y., Gucek M., Puertollano R. MTORC1 functions as a transcriptional regulator of autophagy by preventing nuclear transport of TFEB. Autophagy. 2012;8:903–914. doi: 10.4161/auto.19653. [DOI] [PMC free article] [PubMed] [Google Scholar]
- Martina J.A., Diab H.I., Lishu L., Jeong-A L., Patange S., Raben N., Puertollano R. The nutrient-responsive transcription factor TFE3 promotes autophagy, lysosomal biogenesis, and clearance of cellular debris. Sci. Signal. 2014;7:ra9. doi: 10.1126/scisignal.2004754. [DOI] [PMC free article] [PubMed] [Google Scholar]
- Nam H.S., Benezra R. High levels of Id1 expression define B1 type adult neural stem cells. Cell Stem Cell. 2009;5:515–526. doi: 10.1016/j.stem.2009.08.017. [DOI] [PMC free article] [PubMed] [Google Scholar]
- Nandagopal N., Roux P.P. Regulation of global and specific mRNA translation by the mTOR signaling pathway. Translation (Austin) 2015;3:e983402. doi: 10.4161/21690731.2014.983402. [DOI] [PMC free article] [PubMed] [Google Scholar]
- Napolitano G., Esposito A., Choi H., Matarese M., Benedetti V., Di Malta C., Monfregola J., Medina D.L., Lippincott-Schwartz J., Ballabio A. mTOR-dependent phosphorylation controls TFEB nuclear export. Nat. Commun. 2018;9:3312. doi: 10.1038/s41467-018-05862-6. [DOI] [PMC free article] [PubMed] [Google Scholar]
- Papst P.J., Sugiyama H., Nagasawa M., Lucas J.J., Maller J.L., Terada N. Cdc2-cyclin B phosphorylates p70 S6 kinase on Ser411 at mitosis. J. Biol. Chem. 1998;273:15077–15084. doi: 10.1074/jbc.273.24.15077. [DOI] [PubMed] [Google Scholar]
- Park J.-M., Jung C.H., Seo M., Otto N.M., Grunwald D., Kim K.H., Moriarity B., Kim Y.-M., Starker C., Nho R.S. The ULK1 complex mediates MTORC1 signaling to the autophagy initiation machinery via binding and phosphorylating ATG14. Autophagy. 2016;12:547–564. doi: 10.1080/15548627.2016.1140293. [DOI] [PMC free article] [PubMed] [Google Scholar]
- Peter M., Nakagawa J., Dorée M., Labbé J.C., Nigg E.A. In vitro disassembly of the nuclear lamina and M phase-specific phosphorylation of lamins by cdc2 kinase. Cell. 1990;61:591–602. doi: 10.1016/0092-8674(90)90471-p. [DOI] [PubMed] [Google Scholar]
- Polson H.E.J., de Lartigue J., Rigden D.J., Reedijk M., Urbé S., Clague M.J., Tooze S.A. Mammalian Atg18 (WIPI2) localizes to omegasome-anchored phagophores and positively regulates LC3 lipidation. Autophagy. 2010;6:506–522. doi: 10.4161/auto.6.4.11863. [DOI] [PubMed] [Google Scholar]
- Puente C., Hendrickson R.C., Jiang X. Nutrient-regulated phosphorylation of ATG13 inhibits starvation-induced autophagy. J. Biol. Chem. 2016;291:6026–6035. doi: 10.1074/jbc.M115.689646. [DOI] [PMC free article] [PubMed] [Google Scholar]
- Ramírez-Valle F., Badura M.L., Braunstein S., Narasimhan M., Schneider R.J. Mitotic raptor promotes mTORC1 activity, G(2)/M cell cycle progression, and internal ribosome entry site-mediated mRNA translation. Mol. Cell. Biol. 2010;30:3151–3164. doi: 10.1128/MCB.00322-09. [DOI] [PMC free article] [PubMed] [Google Scholar]
- Roczniak-Ferguson A., Petit C.S., Froehlich F., Qian S., Ky J., Angarola B., Walther T.C., Ferguson S.M. The transcription factor TFEB links mTORC1 signaling to transcriptional control of lysosome homeostasis. Sci. Signal. 2012;5:ra42. doi: 10.1126/scisignal.2002790. [DOI] [PMC free article] [PubMed] [Google Scholar]
- Ruf S., Heberle A.M., Langelaar-Makkinje M., Gelino S., Wilkinson D., Gerbeth C., Schwarz J.J., Holzwarth B., Warscheid B., Meisinger C. PLK1 (polo like kinase 1) inhibits MTOR complex 1 and promotes autophagy. Autophagy. 2017;13:486–505. doi: 10.1080/15548627.2016.1263781. [DOI] [PMC free article] [PubMed] [Google Scholar]
- Russell R.C., Tian Y., Yuan H., Park H.W., Chang Y.-Y., Kim J., Kim H., Neufeld T.P., Dillin A., Guan K.-L. ULK1 induces autophagy by phosphorylating Beclin-1 and activating VPS34 lipid kinase. Nat. Cell Biol. 2013;15:741–750. doi: 10.1038/ncb2757. [DOI] [PMC free article] [PubMed] [Google Scholar]
- Sancak Y., Bar-Peled L., Zoncu R., Markhard A.L., Nada S., Sabatini D.M. Ragulator-Rag complex targets mTORC1 to the lysosomal surface and is necessary for its activation by amino acids. Cell. 2010;141:290–303. doi: 10.1016/j.cell.2010.02.024. [DOI] [PMC free article] [PubMed] [Google Scholar]
- Sancak Y., Peterson T.R., Shaul Y.D., Lindquist R.A., Thoreen C.C., Bar-Peled L., Sabatini D.M. The Rag GTPases bind raptor and mediate amino acid signaling to mTORC1. Science. 2008;320:1496–1501. doi: 10.1126/science.1157535. [DOI] [PMC free article] [PubMed] [Google Scholar]
- Schindelin J., Arganda-Carreras I., Frise E., Kaynig V., Longair M., Pietzsch T., Preibisch S., Rueden C., Saalfeld S., Schmid B. Fiji: an open-source platform for biological-image analysis. Nat. Methods. 2012;9:676–682. doi: 10.1038/nmeth.2019. [DOI] [PMC free article] [PubMed] [Google Scholar]
- Settembre C., Di Malta C., Polito V.A., Garcia Arencibia M., Vetrini F., Erdin S., Erdin S.U.S.U., Huynh T., Medina D., Colella P. TFEB links autophagy to lysosomal biogenesis. Science. 2011;332:1429–1433. doi: 10.1126/science.1204592. [DOI] [PMC free article] [PubMed] [Google Scholar]
- Settembre C., Zoncu R., Medina D.L., Vetrini F., Erdin S., Erdin S., Huynh T., Ferron M., Karsenty G., Vellard M.C. A lysosome-to-nucleus signalling mechanism senses and regulates the lysosome via mTOR and TFEB. EMBO J. 2012;31:1095–1108. doi: 10.1038/emboj.2012.32. [DOI] [PMC free article] [PubMed] [Google Scholar]
- Shah O.J., Ghosh S., Hunter T. Mitotic regulation of ribosomal S6 kinase 1 involves Ser/Thr, Pro phosphorylation of consensus and non-consensus sites by Cdc2. J. Biol. Chem. 2003;278:16433–16442. doi: 10.1074/jbc.M300435200. [DOI] [PubMed] [Google Scholar]
- Shang L., Chen S., Du F., Li S., Zhao L., Wang X. Nutrient starvation elicits an acute autophagic response mediated by Ulk1 dephosphorylation and its subsequent dissociation from AMPK. Proc. Natl. Acad. Sci. USA. 2011;108:4788–4793. doi: 10.1073/pnas.1100844108. [DOI] [PMC free article] [PubMed] [Google Scholar]
- Shuda M., Velásquez C., Cheng E., Cordek D.G., Kwun H.J., Chang Y., Moore P.S. CDK1 substitutes for mTOR kinase to activate mitotic cap-dependent protein translation. Proc. Natl. Acad. Sci. USA. 2015;112:5875–5882. doi: 10.1073/pnas.1505787112. [DOI] [PMC free article] [PubMed] [Google Scholar]
- Sit K.H., Paramanantham R., Bay B.H., Chan H.L., Wong K.P., Thong P., Watt F. Sequestration of mitotic (M-phase) chromosomes in autophagosomes: mitotic programmed cell death in human Chang liver cells induced by an OH∗ burst from vanadyl(4) Anat. Rec. 1996;245:1–8. doi: 10.1002/(SICI)1097-0185(199605)245:1<1::AID-AR1>3.0.CO;2-2. [DOI] [PubMed] [Google Scholar]
- Sloss O., Topham C., Diez M., Taylor S. Mcl-1 dynamics influence mitotic slippage and death in mitosis. Oncotarget. 2016;7:5176–5192. doi: 10.18632/oncotarget.6894. [DOI] [PMC free article] [PubMed] [Google Scholar]
- Sorokina I.V., Denisenko T.V., Imreh G., Tyurin-Kuzmin P.A., Kaminskyy V.O., Gogvadze V., Zhivotovsky B. Involvement of autophagy in the outcome of mitotic catastrophe. Sci. Rep. 2017;7:14571. doi: 10.1038/s41598-017-14901-z. [DOI] [PMC free article] [PubMed] [Google Scholar]
- Tacheva-Grigorova S.K., Santos A.J.M., Boucrot E., Kirchhausen T. Clathrin-mediated endocytosis persists during unperturbed mitosis. Cell Rep. 2013;4:659–668. doi: 10.1016/j.celrep.2013.07.017. [DOI] [PMC free article] [PubMed] [Google Scholar]
- Tseng L.-C., Chen R.-H. Temporal control of nuclear envelope assembly by phosphorylation of lamin B receptor. Mol. Biol. Cell. 2011;22:3306–3317. doi: 10.1091/mbc.E11-03-0199. [DOI] [PMC free article] [PubMed] [Google Scholar]
- Vassilev L.T., Tovar C., Chen S., Knezevic D., Zhao X., Sun H., Heimbrook D.C., Chen L. Selective small-molecule inhibitor reveals critical mitotic functions of human CDK1. Proc. Natl. Acad. Sci. USA. 2006;103:10660–10665. doi: 10.1073/pnas.0600447103. [DOI] [PMC free article] [PubMed] [Google Scholar]
- Vega-Rubin-de-Celis S., Peña-Llopis S., Konda M., Brugarolas J. Multistep regulation of TFEB by MTORC1. Autophagy. 2017;13:464–472. doi: 10.1080/15548627.2016.1271514. [DOI] [PMC free article] [PubMed] [Google Scholar]
- Velásquez C., Cheng E., Shuda M., Lee-Oesterreich P.J., Pogge von Strandmann L., Gritsenko M.A., Jacobs J.M., Moore P.S., Chang Y. Mitotic protein kinase CDK1 phosphorylation of mRNA translation regulator 4E-BP1 Ser83 may contribute to cell transformation. Proc. Natl. Acad. Sci. USA. 2016;113:8466–8471. doi: 10.1073/pnas.1607768113. [DOI] [PMC free article] [PubMed] [Google Scholar]
- Veldhoen R.A., Banman S.L., Hemmerling D.R., Odsen R., Simmen T., Simmonds A.J., Underhill D.A., Goping I.S. The chemotherapeutic agent paclitaxel inhibits autophagy through two distinct mechanisms that regulate apoptosis. Oncogene. 2013;32:736–746. doi: 10.1038/onc.2012.92. [DOI] [PubMed] [Google Scholar]
- Wada S., Neinast M., Jang C., Ibrahim Y.H., Lee G., Babu A., Li J., Hoshino A., Rowe G.C., Rhee J. The tumor suppressor FLCN mediates an alternate mTOR pathway to regulate browning of adipose tissue. Genes Dev. 2016;30:2551–2564. doi: 10.1101/gad.287953.116. [DOI] [PMC free article] [PubMed] [Google Scholar]
- Webster J., Oxley D. Humana Press; 2009. Protein Identification by Peptide Mass Fingerprinting using MALDI-TOF Mass Spectrometry; pp. 1117–1129. [DOI] [PubMed] [Google Scholar]
- Yuan H.-X., Russell R.C., Guan K.-L. Regulation of PIK3C3/VPS34 complexes by MTOR in nutrient stress-induced autophagy. Autophagy. 2013;9:1983–1995. doi: 10.4161/auto.26058. [DOI] [PMC free article] [PubMed] [Google Scholar]
Associated Data
This section collects any data citations, data availability statements, or supplementary materials included in this article.
Supplementary Materials
HEK293 cells expressing the tandem LC3 reporter mRFP-EGFP-LC3 were treated with paclitaxel for 4 h prior to transfer to live-cell imaging stage. Just prior to the 30 min point of acquisition, AZD8055 was added at a final concentration of 1 μM and imaging acquired for a further 2.5 h
Asynchronous HEK293 GFP-ATG13 H2B-mCherry cells were treated with AZD8055 (1 μM) for one h prior to transfer to a live-cell imaging incubator (GFP-ATG13 green; center: H2B-mCherry magenta; left). Similar results were obtained in 3 independent experiments.
3D reconstruction of cells imaged in Video S1 using Imaris software
Asynchronous HeLa GFP-TFEB H2B-mCherry were treated with AZD8055 (1 μM) for one h prior to transfer to a live-cell imaging incubator (GFP-TFEB green; center: H2B-mCherry magenta; left). Similar results were obtained in 3 independent experiments.
Data Availability Statement
Source data are deposited in Mendeley data DOI: https://doi.org/10.17632/cp9rjyzfph.1