

Abstract
Since 2007, most of humanity resides in urban areas, a trend which continues worldwide. Diseases usually associated with rural contexts are now emerging or newly recognised in cities. In the neighbourhood of São Bartolomeu in Salvador, Brazil, the prevalence of Schistosoma mansoni infection in 2011 was >20%. Following enrollment and treatment of a portion of the community, ~25% of the area underwent urban renewal. In 2015, we returned to enrol individuals who had previously participated and a cohort that had not taken part in 2011. Thus, infected individuals in one group experienced specific drug treatment plus improved living conditions and the second group only improved living conditions. Between 2011 and 2015 there were no organised treatment programs, but adequate sanitation increased from 69% to 92% coverage, household flooding decreased, and the presence of indoor toilets increased to 99% of households. Ownership of household appliances also increased significantly. The overall prevalence of schistosome infections was 6.2%. In 2015, the cohort first seen in 2011 had a higher prevalence (8.7%) than those first seen in 2015 (4.8%) and showed a few demographic differences. The 2011 cohort was older, more likely born in Salvador, less likely to have lived outside of Salvador, spent a greater percentage of their lifetime in Salvador, but more likely to have travelled. The population structure of the parasites from both cohorts underwent a marked change with similar increased component and infrapopulation differentiation and >10 fold decrease in effective population size. There was a 4–5 year shift in age-specific prevalence in 2015 for all compared with 2011. While praziquantel may have helped reduce prevalence, our evidence suggests that the structural changes and improvements in living conditions had the biggest impact on schistosomiasis in this community.
Keywords: Urbanisation, Population genetics, Elimination, Community-wide treatment, Sanitation, Differentiation, Effective population size
1. Introduction
The increasing urbanisation of humanity is naturally producing the urbanisation of human infections. It is predicted that by 2050, 70% of the world will live in cities (United Nations, 2015), and currently 30% of urbanites in low or middle income countries live in informal settlements or slums. In some scenarios, the number is expected to triple by 2050 (United Nations, 2013). Schistosomiasis is often considered a disease of rural populations, but there have always been infections with schistosomes in cities. Now the cities themselves are changing and, with them, the profile of the disease. Urbanisation of schistosomiasis is recognised as a growing problem in Africa (Sarda et al., 1985; Ernould et al., 2000; Matthys et al., 2010; Mwakitalu et al., 2014; Dabo et al., 2015), and it has been well documented in Brazil (Barreto, 1960; Guimaraes et al., 1993; Barbosa et al., 2011, 1998; Guimaraes and Tavares-Neto, 2006; Coura-Filho, 2005; Oliveira et al., 2013; Pinto et al., 2013; Blanton et al., 2015; Calasans et al., 2018;). Studies in Brazil (Brooker et al., 2006) and China (Shen et al., 1997) indicate there are significant differences between rural and urban schistosomiasis. Urbanisation and urban landscapes offer obstacles, and opportunities sometimes differ from rural areas. While population density and violence can be obstacles to control infection in the urban environment, population density may facilitate access to those infected, environmental modifications of these artificial sites are more easily and comprehensively accomplished, urban populations are often better off economically and have access to more resources (World Bank. Global Monitoring Report, 2013).
We have previously identified the neighbourhood of São Bartolomeu as an urban focus of schistosomiasis in the city of Salvador, Brazil (Guimaraes and Tavares-Neto, 2006; Blanton et al., 2015). In this neighbourhood, the prevalence in 2011 was 25% with 13% of these heavy infections defined as >400 eggs per gram (epg) of stool. In 2011, the project enrolled 1500 residents from areas with the highest prevalence based on a previous survey of school aged children (Guimaraes et al., 1993). Egg-positive individuals were treated with praziquantel and albendazole, for schistosomiasis and other helminths, respectively, and all those treated for S. mansoni were egg negative when examined 4–6 weeks later. Subsequently, the area underwent a period of urban renewal. Approximately 20% of the homes and inhabitants were removed and replaced with two-storey public housing with connections to the municipal sewer system. In 2015, the Municipal Health Department in collaboration with the Oswaldo Cruz Foundation Bahia (Brazil) initiated a program for control or elimination of schistosomiasis in São Bartolomeu employing methodology similar to that of our previous program from 2011. We evaluated the relative impacts of demographic changes, changes in sanitation and a previous mass treatment on the prevalence of S. mansoni infection and its population structure in the urban setting of São Bartolomeu, Salvador-BA, Brazil.
2. Materials and methods
2.1. Study site and population
The neighbourhood of São Bartolomeu (12° 54.141’ S, 38° 28.514’ W) borders a city park (São Bartolomeu Park) located in the northwestern part of Brazil’s fourth largest city, Salvador. In addition to an important historical site, the park forms a natural buffer between the densely populated portions of the city and a reservoir that until recently supplied drinking water for the city. In the 1970s the region was occupied by people coming from rural areas of the state, looking for work and better living conditions. In 2011, there were ~3600 residents within the 0.23 km2 geographic area of São Bartolomeu. One-third of this area is occupied by mangrove swamp where the Cobre River flows through the community on its way to the sea. In 2004 and again in 2011, an urban focus of schistosomiasis was identified in this neighbourhood (Guimaraes and Tavares-Neto, 2006; Blanton et al., 2015). In 2012, the state of Bahia implemented a project to improve housing and revitalise the park. People who built their residences inside the park and residents of some neighbourhood houses were relocated to other areas in the city of Salvador. Some returned later to newly constructed houses with satisfactory sanitation infrastructure. Of those who participated in the 2011 study, 549 were again identified and participated in 2015 (Fig. 1). In addition, 1105 residents were examined who did not participate in 2011.
Fig. 1.

Study Flow Chart. The shaded area represents samples collected in 2011; the unshaded area 2015. 2011T - all of the individuals enrolled, examined and if positive for Schistosoma mansoni in at least one of three stool tests, treated in 2011. 2015T - All of the individuals enrolled, examined and if positive for S. mansoni in at least one of three stool tests, treated in 2015. The 2015T group was composed of two cohorts. 2011C - the cohort that had been enrolled previously in 2011 and 2015C - the cohort first enrolled in 2015.
2.2. Study design, data and stool collection
In order to understand the effect of environmental and demographic changes on parasite populations, the study design included both a cohort and a cross-sectional study design. A focused study of the community was conducted in 2011 in which 1224 residents within a defined section of the neighbourhood answered a questionnaire and had stool examined on three different days for parasitic infections. This group has been previously described (Blanton et al., 2015). The total group c renewal in 2011 will be designated 2011T, and the total group examined post-urban renewal in 2015 will be 2015T. Further, the cohort examined in 2015 and previously seen in 2011 will be designated 2011C, and those examined only in 2015 will be 2015C (Fig. 1). In 2015, all households were approached by trained interviewers from the Department of Social Service of the Regional University of Bahia, Salvador. Study data was entered in a Research Electronic Data Capture (REDCap) database (Harris et al., 2009) hosted at the Oswaldo Cruz Foundation. Each household was also georeferenced for spatial analysis.
The Committee on Ethics in Research of the Oswaldo Cruz Foundation of Salvador, Bahia, the Brazilian National Committee on Ethics in Research and the Institutional Review Board for Human Investigation of University Hospitals Case Medical Center, Cleveland, Ohio, USA, approved the study design. All subjects provided written informed consent or in the case of minors, consent was obtained from their guardians. All aspects of the study have been conducted according to the principles expressed in the Declaration of Helsinki.
2.3. Infection detection and egg isolation
After collecting demographic data, each individual was asked to provide stool samples on three different days. All samples were examined for S. mansoni or geohelminth ova by qualified laboratory technicians using the Kato-Katz technique. Eggs were concentrated from a whole stool as described previously (Blanton et al., 2011). Briefly, stool was liquefied in 2% saline and eggs concentrated by selective sieving followed by a saline sedimentation. Concentrated sediment was kept at −20 °C until further analysis.
2.4. DNA extraction and genotyping
DNA was extracted from the sediment by a standard phenol: chloroform protocol and treated with hexadecyltrimethylammonium bromide bromide (CTAB) to remove PCR inhibitors (Ausubel, 1987). For genotyping, 2 μl of a 200 μl final volume of DNA were used for PCR with each set of nine primer pairs to amplify their corresponding microsatellite locus. Amplicons from this reaction were then multiplexed with 2–3 other amplified loci for capillary electrophoresis and genotyping on an Applied Biosystems 3730xl DNA Analyzer (Applied Biosystems, Carlsbad, CA, USA). Peaks were analysed with PeakScanner software version 2.0 (Applied Biosystems, Carlsbad, CA, USA). Non-matching duplicates, peaks not conforming to the step-wise mutation model and peaks <100 pixels in height were eliminated. Jost’s D (Jost, 2008) between replicates was calculated, and where this was >0.01, they were re-examined or eliminated. Allele frequencies were calculated based on the ratio between individual peak heights and the sum of peak heights for each marker (Blanton et al., 2011).
2.5. Data analysis
Descriptive, univariate analysis and multivariate logistic regression statistics were performed in Epi Info 7.2.2.6 (https://www.cdc.gov/epiinfo/index.html). Continuous variables were evaluated with the Kruskal-Wallis test. Categorical comparisons were performed by a chi-square test using Yates’ correction or a Fisher-Exact test when appropriate. A two-sided P value <0.05 was considered significant for all analyses. Effect sizes were expressed as odds ratios (ORs) and Hedges’ g for chi-square and Student’s T-test, respectively. Socioeconomic variables were used to determine economic classification based on the Criteria for Economic Classification Brazil of the Brazilian Association of Research Companies, São Paulo (Criteria for Economic Classification Brazil] 2013. http://www.abep.org/Servicos/Download.aspx?id=03).
For genetic analyses, Jost’s D was calculated with the software Spade (Chao and Shen, 2010. https://chao.shinyapps.io/SpadeR/) and effective population size (Ne) with MLNe (Arntzen and Wallis, 2006). Sensitivity analysis was performed for all population genetic indices by iteratively removing one marker and recalculating these values to determine if one marker skewed the result.
3. Results
3.1. Total and cohort population characteristics
The population in 2011 and 2015 showed few demographic differences (Table 1). The 2011 population was slightly younger on average, had lived a greater percentage of their life in Salvador and travelled less outside of the city. The effect sizes of these differences were small, however. Households without refrigerators went from 6% to 3% (P < 0.05, OR, 2.1), and those with computers rose from 25% to 35% (P < 0.01, OR, 1.7), which suggests an improvement in disposable income. The major differences between the populations in 2011 and 2015 were for living conditions and S. mansoni infection. In 2011, fewer residents had piped water or adequate sewage disposal, and more homes were flooded.
Table 1.
Characteristics of all São Bartolomeu, Salvador, Brazil, study participants in 2011 and 2015.
| Characteristics | 2011 |
2015 |
Pb | Effect sizec | 95% CIe | ||||
|---|---|---|---|---|---|---|---|---|---|
| Totala | n | % or Mean ± S.D. | Totala | n | % or Mean ± S.D. | ||||
| Male Sex | 1508 | 721 | 48% | 1654 | 739 | 45% | ns | 0.88 | 0.77–1.01 |
| Age | 1507 | 29.1 ± 17.4 | 1561 | 31.9 ± 19.3 | <0.05 | 0.15d | - | ||
| Born in Salvador | 1508 | 1179 | 78% | 1494 | 1146 | 77% | ns | 0.92 | 0.77–1.09 |
| % life in Salvador | 1508 | 90.8 ± 20.1 | 1479 | 88.4 ± 20.6 | <0.05 | 0.12d | |||
| Lived outside Salvador | 1508 | 336 | 22% | 1470 | 369 | 25% | ns | 1.17 | 0.99–1.38 |
| Any travel outside last year | 1499 | 496 | 33% | 1467 | 560 | 37% | <0.05 | 1.25 | 1.07–1.45 |
| Piped water | 1329 | 1322 | 99% | 1509 | 1494 | 99% | ns | - | - |
| Indoor toilet | 1315 | 1262 | 96% | 1502 | 1480 | 99% | <0.01 | 2.83 | 1.71–4.67 |
| Adequate sanitationf | 1297 | 890 | 69% | 1496 | 1383 | 92% | <0.01 | 5.60 | 4.47–7.01 |
| Flooding | 1505 | 742 | 49% | 1480 | 460 | 31% | <0.01 | 0.46 | 0.40–0.54 |
| S. mansoni prevalence | 1224 | 302 | 24.7% | 1158 | 72 | 6.2% | <0.01 | 0.20 | 0.15–0.27 |
| S. mansoni intensityh | 302 | 206.3 ± 508.6 | 71 | 159.2 ± 286.9 | ns | 0.11 | - | ||
Total varies according to availability of data. Percentages are estimates over this total.
Two-tailed P value. ns, not significant. For categorical variables, Yates; chi-square test or Fisher-Exact test were used when appropriate. For continuous variables, a Kruskal-Wallis test for two groups for used.
Odds ratio for categorical variables.
Hedges’ g, standardised means for continuous variables where <0.2 is conventionally considered a small effect.
Confidence interval
Connection to septic tank or sewer, otherwise toilet flushes to rivers or streams.
Mean Schistosoma mansoni eggs per gram of feces.
The 2011C cohort consisted of 549 of the 1239 (44%) individuals that participated in 2011, while there were 1105 in the 2015C group. In 2015, the 2011C cohort differed from the 2015C cohort by being on average slightly older and living a greater percentage of their lifetime in Salvador (Table 2). A smaller percentage had lived outside Salvador, but a larger percentage had travelled outside of the city in the preceding year. None of these variables had an OR >2 or <0.5 or Cohen’s d >0.2. The differences with the largest effect size between the 2011C and 2015C cohorts were the prevalence and intensity of infection.
Table 2.
Characteristics of study cohorts in 2015.
| Characteristics | 2011Ca |
2015C |
Effect size |
95% CIf | |||||
|---|---|---|---|---|---|---|---|---|---|
| Totalb | n | % or Mean ± S.D.c | Totalb | n | % or Mean ± S.D. | Pc | ORd or Hedge’s ge | ||
| Male Sex | 549 | 244 | 44 | 1105 | 495 | 45 | ns | 0.99 | 0.80–1.21 |
| Age | 543 | 33.5 ± 17.7 | 1018 | 31.4 ± 20.0 | ns | 0.11e | |||
| Born in Salvador | 538 | 428 | 80 | 956 | 718 | 75 | ns | 1.2897 | 0.99–1.67 |
| % life in Salvador | 535 | 90.9 ± 17.8 | 944 | 86.9 ± 21.9 | ns | 0.20e | |||
| Lived outside Salvador | 535 | 111 | 21 | 935 | 258 | 28 | <0.01 | 1.46 | 1.13–1.88 |
| Any travel outside last year | 527 | 358 | 32 | 940 | 549 | 42 | <0.05 | 0.66 | 0.53–0.83 |
| SES (Estimated mean family income) | |||||||||
| Status B/C (R$4,418–1024/month)g | 524 | 313 | 60 | 985 | 579 | 59 | ns | 0.96 | 0.77–1.19 |
| Status D/E (R$714–447/month)g | 211 | 40 | 406 | 41 | - | - | |||
| Piped water | 524 | 523 | 100 | 980 | 966 | 99 | ns | - | - |
| Indoor toilet | 523 | 511 | 98 | 974 | 964 | 99 | ns | - | - |
| Adequate sanitationh | 522 | 490 | 94 | 969 | 888 | 92 | ns | 0.72 | 0.47–1.09 |
| Flooding | 537 | 181 | 34 | 943 | 279 | 30 | ns | 0.83 | 0.66–1.04 |
| Schistosoma mansoni prevalence | 424 | 37 | 8.7 | 734 | 35 | 4.8 | <0.05 | 0.52 | 0.32–0.85 |
| S. mansoni intensity (epg)i | 424 | 190.1 ± 376.5 | 734 | 125.5 ± 133.1 | ns | 0.26e | |||
2011C - the cohort first examined in 2011 with conditions of 2015; 2015C - the cohort first examined in 2015; all cohorts in Sâo Bartolomeu, Salvador, Bahia, Brazil.
Total varies according to availability of data. Percentages were calculated over this total.
SES, social economic status (Brazilian Association of Research Companies, 2013).
cTwo-tailed P value; ns, not significant. For categorical variables; Yates’ chi-square test or a Fisher-Exact test were used when appropriate. For continuous variables, a Kruskal/Wallis test for two groups was used.
Odds ratio
Standardised means (Hedges’ g) for continuous variables where <0.2 is conventionally considered a small effect.
Confidence interval
Status - Brazilian Association of Research Companies economic status classification
Connection to septic tank or sewer, otherwise toilets flush to rivers or streams.
Epg log-transformed mean of parasite eggs per gram
3.2. Infection and risk factors
Of the 302 S. mansoni infections identified, 29 were not treated either because they moved or had a contraindication. Of the 273 treated, 187 were negative on follow-up, four were persistently positive and 82 failed to have repeat examinations. The community-wide prevalence decreased four-fold (24% to 6%) between 2011 and 2015. The decrease in prevalence was most marked in the youngest children, 0–10 years old. In addition, while the peak prevalence in 2011 was in 11–15 year olds, in 2015 the peak prevalence shifted 5 years to 16–20 year olds (Fig. 2). The intensity was lower for most age groups in 2015, although the average was not different.
Fig. 2.

Studies in 2011 and 2015; age-specific Schistosoma mansoni infection prevalence and intensity. The prevalence and intensity (arithmetic average -eggs per gram of feces (epg)) of S. mansoni infection among participants found to be infected in respective years.
The incidence or reinfection rate over this 4 year period was 1.7% per year. When examined in 2015, the prevalence and intensity of the 2011C group were higher than the 2015C cohort. We found 116 individuals who were not present in the neighbourhood in 2011, but only 20 had immigrated in the last 5 years, and the rest had been born since 2011. The prevalence of S. mansoni infection was no different in these recent immigrants than that of long-term residents.
While male sex, younger age, birth in Salvador, never living or travelling outside Salvador and poor sanitation were associated with infection in 2011, only male sex and living and travelling outside of Salvador were risk factors in 2015 (Supplementary Table S1). Infected individuals in 2011 were less likely to have lived outside Salvador, less likely to have travelled outside the city or to have adequate sanitation compared with those infected in 2015 (Table 3). Except for sanitation, the effect sizes for these variables were relatively small. Travel outside Salvador and the percentage of lifetime lived in Salvador were not associated. Those infected in the two cohorts differed in that the 2011C cohort was younger, more likely born in Salvador, spent a longer percentage of their lifetime in Salvador, were less likely to have ever lived outside of Salvador and more likely to have travelled outside of the city. The effect sizes were modest, except for the age difference (Table 4). Infection risk factors in 2015 by cohort are provided in Supplementary Table S1.
Table 3.
Comparison of Schistosoma mansoni-infected residents of São Bartolomeu, Salvador, Bahia, Brazil in 2011 and 2015.
| Study Characteristics |
2011Ta |
2015Ta |
Comparisons |
||||||
|---|---|---|---|---|---|---|---|---|---|
| Totalb | n | % | Total | n | % | Pc | ORd | 95% CIe | |
| Male sex | 302 | 202 | 66.9 | 72 | 53 | 73.6 | ns | 0.72 | 0.40–1.29 |
| Age, years | 302 | 26.6 ± 16.1 | 62 | 30.3 ± 14.6 | nsf | ||||
| Born in Salvador | 302 | 253 | 83.8 | 63 | 52 | 82.5 | ns | 1.69 | 0.87–3.29 |
| % life in Salvador | 302 | 94.6 ± 14.7 | 62 | 90.6 ± 20.4 | nsf | ||||
| Lived outside Salvador | 302 | 46 | 15.2 | 62 | 10 | 16.1 | <0.05 | 0.48 | 0.24–0.96 |
| Any travel last year | 302 | 77 | 25.6 | 60 | 16 | 26.7 | <0.05 | 0.53 | 0.30–0.96 |
| Adequate sanitationg | 302 | 152 | 60.6 | 61 | 54 | 88.5 | <0.01 | 0.13 | 0.06–0.30 |
| Flooding | 302 | 146 | 48.5 | 62 | 18 | 29.0 | ns | 0.83 | 0.47–1.47 |
| Occupational water contact | 298 | 82 | 27.5 | 58 | 5 | 8.6 | ns | 2.04 | 0.78–5.38 |
All individuals infected with S. mansoni in 2011 (2011T) and all infected in 2015 regardless of prior treatments (2015T).
Total varies according to availability of data. Percentage is an estimate over this total.
Pearson’s or Yates’ corrected chi-square test; two-tailed P value. ns, not significant.
Odds ratio.
Confidence interval.
Hedges’ g, standardised means for continuous variables where <0.2 is conventionally considered a small effect.
Connection to septic tank or sewer, otherwise toilets flush to rivers or streams.
Table 4.
Comparison between praziquantel treated cohorts and non-examined, non-treated cohorts of Schistosoma mansoni-infected residents from São Bartolomeu, Salvador, Bahia, Brazil in 2015.
| Study Characteristics |
2011Ca |
2015C |
Comparisons |
||||||
|---|---|---|---|---|---|---|---|---|---|
| Totalb | n | % | Total | n | % | Pc | Effect sized | 95% CIf | |
| Male sex | 37 | 27 | 73.0 | 35 | 26 | 74.3 | Ns | 1.07 | 0.37–3.06 |
| Age | 37 | 25.4 ± 14.4 | 26 | 36.1 ± 16.4 | <0.01 | 0.70e | |||
| Born in Salvador | 36 | 33 | 91.7 | 27 | 19 | 70.4 | <0.05 | 0.22 | 0.05–0.91 |
| % life in Salvador | 36 | 96.3 ± 6.9 | 26 | 82.8 ± 28.9 | <0.05 | 0.70e | |||
| Lived outside Salvador | 36 | 2 | 5.6 | 26 | 8 | 30.8 | <0.05 | 7.56 | 1.45–39.40 |
| Any travel last year | 34 | 10 | 29.4 | 26 | 6 | 23.1 | <0.05 | 0.36 | 0.14–0.91 |
| Adequate sanitationg | 35 | 32 | 91.4 | 26 | 22 | 84.6 | ns | 0.52 | 0.10–2.53 |
| Flooding | 36 | 13 | 36.1 | 26 | 5 | 19.2 | ns | 0.42 | 0.13–1.38 |
| Occupational water contact | 35 | 3 | 8.6 | 23 | 2 | 8.7 | ns | 1.02 | 0.16 – 6.60 |
Only those infected with S. mansoni for the cohort first examined in 2011 with conditions of 2015 (2011C); the cohort first examined in 2015 (2015C).
Total varies according to availability of data. Percentage is an estimate over this total.
Pearson’s or Yates’ corrected chi-square test or a Fisher’s exact were used where indicated; two-tailed P value. ns, not significant.
Odds ratio
Hedges’ g, standardised means for continuous variables where <0.2 is conventionally considered a small effect.
Confidence interval
Connection to septic tank or sewer, otherwise toilets flush to rivers or streams.
3.3. Parasite population structure
Parasite population structure can be partitioned as those parasites within an individual host (infrapopulation) or those within the whole community of hosts (component population). Component populations can represent geographic or temporal groupings. There was a high degree of genetic differentiation between the component populations in 2011 and 2015 (Table 5). A similar high degree of component population differentiation (Dc) exists between the cohorts 2011C and 2015C, and the total component population 2011T. The two cohorts had similarly low differentiation from the total 2015 component population. Between the two cohorts examined in 2015, however, there was a small degree of differentiation above that expected (Dc = 0.023), suggesting they were not completely drawn from the same genetic pool. (Fig. 3). Mean pairwise comparisons between all 2011 infrapopulations (Di) was 0.071 ± 0.063 (Table 6). In 2015, the mean Di increased to 0.183 ± 0.178. The mean Dis within each cohort in 2015 were 0.164 ±0.161 for 2011Cand0.197 ±0.194 for2015C. Ne decreased more than 10 fold (Table 7). Sensitivity analysis resulted in less than 1% difference between values averaged after removing one microsatellite versus using all 10 markers. Microsatellite marker characteristics and Di by marker and cohort are provided in Supplementary Tables S2 and S3. Infrapopulation allele numbers for 2011 and 2015 are included in Supplementary Data S1 and S2, respectively.
Table 5.
Schistosoma mansoni component population differentiation.
| Dca between year and cohorts | |||
|---|---|---|---|
| 2015T | 2011C | 2015C | |
| 2011T | 0.301 | 0.306 | 0.303 |
| 2015T | 0.004 | 0.008 | |
| 2011C | 0.023 | ||
2011T - all subjects examined in 2011 prior to urban renewal.
2015T - all subjects examined in 2015 post urban renewal.
2011C - the cohort first examined in 2011 and reexamined in 2015 post urban renewal.
2015C - the cohort first examined in 2015 post urban renewal.
The mean Jost D between total allele frequencies for populations composed of all subjects examined in 2011 or 2015 or cohorts within the population examined in 2015, all from São Bartolomeu, Salvador, Bahia, Brazil.
Fig. 3.

Differentiation (Dc) between component populations and sub-populations surveyed in 2015. The shaded area represents samples collected in 2011; the unshaded area 2015. 2011T - parasites from all Schistosoma mansoni-infected individuals examined in 2011. 2015T - parasites from all S. mansoni-infected individuals examined in 2015.2011C - parasites collected in 2015 from individuals enrolled in 2011. 2015C - parasites collected in 2015 from individuals not previously enrolled.
Table 6.
Schistosoma mansoni population structure compared.
| Dia | S.D. | |
|---|---|---|
| 2011T | 0.071 | 0.063 |
| 2015T | 0.183 | 0.178 |
| 2011C | 0.164 | 0.161 |
| 2015C | 0.197 | 0.194 |
2011T - all subjects examined in 2011 prior to urban renewal.
2015T - all subjects examined in 2015 post urban renewal.
2011C - the cohort first examined in 2011 and reexamined in 2015 post urban renewal.
2015C - the cohort first examined in 2015 post urban renewal.
The mean pairwise Jost D between infrapopulations for all subjects examined in 2011 or 2015 or cohorts within the population examined in 2015, all from São Bartolomeu, Salvador, Bahia, Brazil.
Table 7.
Schistosoma mansoni population structure compared.
| Nea | (95%CIb) | |
|---|---|---|
| 2011T | 19,342 | (29,497–3850) |
| 2015T | 1437 | (1410–1453) |
| 2011C | 1079 | (1062–1093) |
| 2015C | 1185 | (1161–1206) |
2011T - all subjects examined in 2011 with conditions of 2011.
2015T - all subject examined in 2015 with conditions of 2015.
2011C - the cohort first examined in 2011 with conditions of 2015.
2015C - the cohort first examined in 2015.
Effective population size.
Confidence interval.
3.4. Geographic distribution
Households with at least one infected occupant were dispersed throughout the sampled area among houses with no one infected (Fig. 4). In 2011, there was a slightly higher prevalence in the areas inside the park. Houses were removed from within the park after 2011, and between 2011 and 2015, new standardised housing replaced informal structures north of the mangrove. For the 2015 survey, a new area was included south of the mangrove swamp that occupies the center of the community. In 2015, households with infected occupants were again dispersed throughout the community with no clear focal hotspots.
Fig. 4.
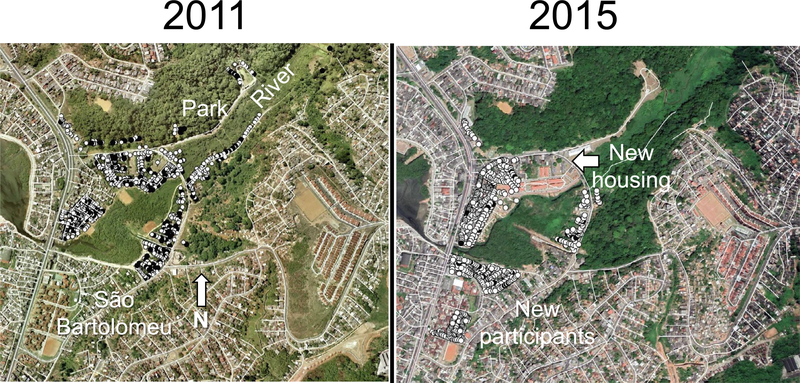
Distribution of households in São Bartolomeu, Salvador, Brazil, with and without a Schistosoma mansoni-infected member. Houses were georeferenced using a handheld geo positioning device or Google Earth. Maps were produced using qGIS v. 2.18.15 QGIS Development Team, 2015. QGIS Geographic Information System (https://qgis.org/en/site/). Black circles mark households with at least one infected member. White circles mark households with no infected members.
4. Discussion
By definition, population density is higher in urban than rural areas, and in Brazil this also implies physical and social differences. In urban areas, the population density, education level and base income are higher, as is violence. There is less contact with surface waters for most urbanites (Ernould et al., 2000). Urban areas have greater health resources, and environmental interventions that directly affect a large number of people are more easily accomplished. For schistosomiasis, some clinical features of urban disease set it apart from rural disease. In urban areas, infections have lower intensity and an older age distribution. In common with infections in rural areas, there is significant spatial clustering, although the focal nature of the disease is even more evident over short distances in the urban environment (Brooker et al., 2006).
Urbanisation has been a key global process in the last century and promises to change the human relationship with the physical environment and our exposure to pathogens well into this one. Parasitic infections are also influenced by the new context in which hosts and vectors encounter pathogens. An urban renewal program in Brazil has provided a unique opportunity to compare the effect of antiparasitic treatment versus structural changes in the landscape of an urban community. Following treatment for S. mansoni infection in one section of the neighbourhood of São Bartolomeu, there was an increase in adequate sewer coverage from 68% to 92%, a decrease in flooded households from 49% to 31% and an apparent increase in disposable income across the neighbourhood. Within the same neighbourhood, a cohort of residents and parasites experienced the effects of both interventions (2011C), while another was only exposed to improvements in living conditions (2015C). While both groups had a higher prevalence of S. mansoni infection than the state average (4.1%, Brazilian Ministry of Health, 2018. http://www.saude.gov.br/boletins-epidemiologicos) the 4 years without community-wide treatment has not seen a return to 2011 levels. The treated and untreated cohorts do not appear very different demographically, socioeconomically (Table 2) or geographically (Fig. 4). The overall shift in age-specific prevalence by 4–5 years for the whole community further supports the importance of the improvements in living conditions. Thus, changes in the overall parasite population likely owe more to the changes in living conditions than a single round of praziquantel treatment for a section of the community.
During a 7 year period from 2004 to 2011 we reported little differentiation (Jost’s d = 0.007) between parasite populations in São Bartolomeu (Blanton et al., 2015). The marked differentiation (Jost’s d = 0.301) between 2011 and 2015 begs explanation. This large differentiation is not likely the result of immigration. While this has been a big factor in the rapid urbanisation of Salvador, immigration rates appear to be reaching a plateau as rural populations decline (Perz, 2000). Brazil in general is more urbanised than the US. In our study, we were able to identify only 23 immigrants arriving in the last 5 years, and only one of these was infected. This was also reflected in the overall risk being lower in those with a smaller percentage of their lifetime spent in the city.
It is possible that within the small area of a neighbourhood there are multiple well differentiated subpopulations of schistosomes, and that one or a few key sources were eliminated between 2011 and 2015, leaving the other well-differentiated subpopulations. This might explain the differentiation between 2011C and 2015C parasites, but such a scenario seems unlikely and is not consistent with our experience in other communities. A more likely source of this differentiation is genetic drift due to a bottleneck. One interpretation of Ne is as a measure of the susceptibility of the population to genetic drift. The São Bartolomeu population of S. mansoni experienced a steep decline in Ne over the four years between sampling. This reduced the likelihood of individuals acquiring the same parasite genotypes and resulted in increased differentiation between infrapopulations. The population was, therefore, more susceptible to drift, and this most likely accounts for the change in overall genetic population structure.
Parasites from both cohorts demonstrate the same degree of marked differentiation from the 2011 population and are similarly close to the 2015 component population. Parasite populations, however, do demonstrate moderate differentiation between the cohorts in 2015 despite overlapping areas of residence within a few city blocks. For multiple historical reasons, the two cohorts are not entirely comparable. Those first seen in 2011 (2011C) were originally selected for residing in a part of the community that appeared to have a higher prevalence of disease, and while reducing their prevalence by more than two-fold, they continued to have a higher prevalence even post-treatment and changes in living conditions. By all other measures, however, the cohorts were equivalent (Table 2), until only those infected were compared (Table 4). Those who were part of the original cohort and became reinfected were younger, were more likely born in Salvador, less likely to have lived outside Salvador, but more likely to have travelled in the last year. The age and nature of exposure to Salvador itself were the major differences between the cohorts for those who were or became infected, and might be responsible for a differential acquisition of parasite genotypes. In addition, the 2011C cohort acquired their 2015 parasites over a period of 4 years, while the 2015C cohort may have acquired theirs over decades. While drift may explain the differentiation seen over time, there also appear to be differences in the behaviour of those infected that resulted in differentiation in these subpopulations.
In terms of other limitations, we further note that differences in the magnitude of statistical effect size might not directly translate to differences in functional effect. They indicated the strength of the association, but are not necessarily causative. Some samples could not be genotyped for some markers, however, the sensitivity analysis indicated that no single marker was skewing the results. In an unpublished study (unpublished data), we found that 10–15 markers produced indices similar to the use of 25 markers, so the absence of a few markers should not bias the results.
In a previous study (Blanton et al., 2015), we found no component population differentiation over a 7 year period in São Bartolomeu when there was no intervention. In rural Bahia, where all infected residents in the community were treated, little differentiation was observed 3 years after the first round of treatment, while Ne fell by more than 10 fold (Blanton et al., 2011). The marked differentiation observed, coupled with the 5 year shift in age-specific prevalence, strongly suggest that this was a community-wide effect, most consistent with the improvements made in living conditions. Urban living clearly has certain advantages that today increasingly pull rural populations into cities. While the ability to effect environmental changes for the health of a large number of individuals is probably not a major consideration for most immigrants to the cities, it is one of the potential benefits that public health agencies can take advantage of when working in conjunction with city planners and government.
Supplementary Material
Acknowledgements
This work was supported by National Institutes of Health (NIH, USA) grants R01 A1069195 and R01 A1121330. The Salvador Municipal Secretary of Health (Brazil) and the Fiocruz-Bahia (Brazil) contributed materials, transportation and personnel for the completion of this work.
Footnotes
Appendix A. Supplementary data
Supplementary data to this article can be found online at https://doi.org/10.1016/j.ijpara.2019.10.003.
References
- Arntzen JW, Wallis GP, 2006. Restricted gene flow in a moving hybrid zone of the newts Triturus cristatus and T. marmoratus in Western France. Evolution (NY) 45, 805 10.2307/2409691. [DOI] [PubMed] [Google Scholar]
- Ausubel FM, 1987. Current Protocols in Molecular Biology. Greene Pub. Associates, Hoboken, New Jersey. [Google Scholar]
- Barbosa CS, Gonçalves JF, Albuquerque Y, Barbosa FS, 1998. Urban schistosomiasis in Itamaracá Island, Pernambuco, Brazil: epidemiological factors involved in the recent endemic process. Mem. Inst. Oswaldo Cruz 93 (Suppl 1), 265–266. 10.1590/S0074-02761998000700049. [DOI] [PubMed] [Google Scholar]
- Barbosa CS, Leal-Neto OB, Gomes ECS, de Araujo KCGM, Domingues ALC, 2011. The endemisation of schistosomiasis in Porto de Galinhas, Pernambuco, Brazil, 10 years after the first epidemic outbreak. Mem. Inst. Oswaldo Cruz 106, 878–883. 10.1590/S0074-02762011000700014. [DOI] [PubMed] [Google Scholar]
- Barreto A, 1960. [Schistosomiasis mansoni in the City of Salvador, Bahia. Studies on the Vector, Host/Parasite Relationships and Epidemiological Aspects] Esquistossomose mansonica na Cidade do Salvador. Estudo do vetor, relates parasito-hospedeiro e aspectos epi. Bol. Fund G Moniz 16,1–80. [Google Scholar]
- Blanton RE, Barbosa LM, Reis EA, Carmo TM, dos Santos CRA, Costa JM, Aminu PT, Blank WA, Reis RB, Guimarães IC, Silva LK, Reis MG, 2015. The relative contribution of immigration or local increase for persistence of urban schistosomiasis in Salvador, Bahia, Brazil. PLoS Negl. Trop. Dis 9 10.1371/journal.pntd.0003521. [DOI] [PMC free article] [PubMed] [Google Scholar]
- Blanton RE, Blank WA, Costa JM, Carmo TM, Reis EA, Silva LK, Barbosa LM, Test MR, Reis MG, 2011. Schistosoma mansoni population structure and persistence after praziquantel treatment in two villages of Bahia, Brazil. Int. J. Parasitol 41, 1093–1099. 10.1016/j.ijpara.2011.06.002. [DOI] [PMC free article] [PubMed] [Google Scholar]
- Brooker S, Alexander N, Geiger S, Moyeed RA, Stander J, Fleming F, Hotez PJ, Correa-Oliveira R, Bethony J, 2006. Contrasting patterns in the small-scale heterogeneity of human helminth infections in urban and rural environments in Brazil. Int J Parasitol 36, 1143–1151 [pii] 10.1016/j.ijpara.2006.05.009. [DOI] [PMC free article] [PubMed] [Google Scholar]
- Calasans TAS, Souza GTR, Melo CM, Madi RR, de Lourdes Sierpe Jeraldo V, 2018. Socioenvironmental factors associated with Schistosoma mansoni infection and intermediate hosts in an urban area of northeastern Brazil. PLoS One. 10.1371/journal.pone.0195519. [DOI] [PMC free article] [PubMed] [Google Scholar]
- Coura-Filho P, 2005. Distribuição da esquistossomose no espaço urbano. 1. O caso da região metropolitana de Belo Horizonte, Minas Gerais, Brasil. Cad. Saude Publica 13, 245–255. 10.1590/s0102-311×1997000200014. [DOI] [PubMed] [Google Scholar]
- Dabo A, Diarra AZ, Machault V, Touré O, Niambélé DS, Kanté A, Ongoiba A, Doumbo O, 2015. Urban schistosomiasis and associated determinant factors among school children in Bamako, Mali, West Africa. Infect. Dis. Poverty 4 10.1186/2049-9957-4-4. [DOI] [PMC free article] [PubMed] [Google Scholar]
- Ernould JC, Kaman A, Labbo R, Couret D, Chippaux JP, 2000. Recent urban growth and urinary schistosomiasis in Niamey, Niger. Trop Med. Int. Heal (5), 431–437 https://doi.org/tmi577 [pii]. [DOI] [PubMed] [Google Scholar]
- Guimaraes CT, de Souza CP, Carvalho Odos S, Katz N, 1993. Urban focus of schistosomiasis in a metropolitan area in a southeastern region of Brazil. Rev. Saude Publica 27, 210–213. [DOI] [PubMed] [Google Scholar]
- Guimaraes IC, Tavares-Neto J, 2006. Urban transmission of schistosomiasis in children from a neighborhood of Salvador, Bahia. Rev Soc Bras Med Trop 39, 451–455. https://doi.org/S0037-86822006000500006 [pii]. [DOI] [PubMed] [Google Scholar]
- Harris PA, Taylor R, Thielke R, Payne J, Gonzalez N, Conde JG, 2009. Research Electronic Data Capture (REDCap)-A metadata-driven methodology and workflow process for providing translational research informatics support. J. Biomed. 1nf 42, 377–381. 10.1016/j.jbi.2008.08.010. [DOI] [PMC free article] [PubMed] [Google Scholar]
- Jost L, 2008. GST and its relatives do not measure differentiation. Mol. Ecol 17, 4015–4026. 10.1111/j.1365-294X.2008.03887.x. [DOI] [PubMed] [Google Scholar]
- Matthys B, Koudou BG, N’Goran EK, Vounatsou P, Gosoniu L, Koné M, Gisse G, Utzinger J, 2010. Spatial dispersion and characterisation of mosquito breeding habitats in urban vegetable-production areas of Abidjan, Côte d’1voire. Ann. Trop. Med. Parasitol 104, 649–666. 10.1179/136485910×12851868780108. [DOI] [PubMed] [Google Scholar]
- Mwakitalu ME, Malecela MN, Mosha FW, Simonsen PE, 2014. Urban schistosomiasis and soil transmitted helminthiases in young school children in Dar es Salaam and Tanga, Tanzania, after a decade of anthelminthic intervention. Acta Trop. 133, 35–41. 10.1016/j.actatropica.2014.01.012. [DOI] [PubMed] [Google Scholar]
- Oliveira DS, Santos VB, Melo AGS, Lima AS, Carvalho CD, Allegretti SM, de Melo CM, Madi RR, Jeraldo RR, de Lourdes Sierpe Jeraldo V, 2013. Schistosomiasis mansoni in urban Northeast Brazil: 1nfluence of rainfall regime on the population dynamics of Biomphalaria sp. Rev. Soc. Bras. Med. Trop 46, 654–657. 10.1590/0037-8682-1486-2013. [DOI] [PubMed] [Google Scholar]
- Perz SG, 2000. The rural exodus in the context of economic crisis, globalization and reform in Brazil. 1nt. Migr. Rev 34, 842–881. 10.2307/2675947. [DOI] [Google Scholar]
- Pinto HA, Mati VLT, de Melo AL, 2013. The Pampulha reservoir remains a potential urban focus of schistosomiasis mansoni in Brazil: Changes in the occurrence patterns of Biomphalaria species and a new record of the parasite. Rev. Soc. Bras. Med. Trop 46, 478–483. 10.1590/0037-8682-0099-2013. [DOI] [PubMed] [Google Scholar]
- Sarda RK, Simonsen PE, Mahikwano LF, 1985. Urban transmission of urinary schistosomiasis in Dar es Salaam, Tanzania. Acta Trop 42, 71–78. [PubMed] [Google Scholar]
- Shen G, Li Q, La D, Zhang S, 1997. Special features of acute infection due to Schistosoma japonicum in urban and rural areas in China. Southeast Asian J. Trop. Med. Public Heal 28, 280–284. [PubMed] [Google Scholar]
- United Nations, 2015. World Urbanization Prospects: The 2014 Revision. United Nations, New York. [Google Scholar]
- United Nations, 2013. World Economic & Social Survey: Sustainable Development Challenges. United Nations, New York. [Google Scholar]
- World Bank. Global Monitoring Report 2013, 2013. Rural-Urban Dynamics and the Millennium Development Goals, Washington, DC: World Bank. The World Bank and the International Monetary Fund, Washington, DC. [Google Scholar]
Associated Data
This section collects any data citations, data availability statements, or supplementary materials included in this article.