

Abstract
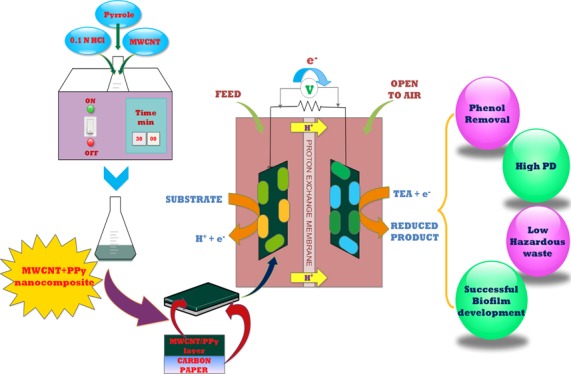
The study presents the comparative bioelectrochemical treatment of phenol in anodic and cathodic compartments of four identical dual chambered microbial fuel cells (MFCs) with bare and multiwalled carbon nanotube/polypyrrole (MWCNT/PPy)-coated electrodes, respectively. It was observed that systems performing biocathodic treatment of phenol performed better as compared to the systems performing bioanodic treatment. The maximum power densities for bioanodic phenol treatment using bare and coated electrodes were found to be 469.038 and 560.719 mW/m2, while for biocathodic treatment, they were observed to be 604.804 and 650.557 mW/m2, respectively. The MFCs performing biocathodic treatment of phenol consistently showed higher chemical oxygen demand removal efficiency, Coulombic efficiency, and power density and indicated the better performance of the biocathodic bare (B-MFC) and coated (C-MFC) MFCs as compared to the bioanodic B-MFC and C-MFC. UV/vis spectrophotometry revealed that the MWCNT/PPy-coated carbon paper worked significantly better in the treatment of phenol with admirable treatment obtained within a week of the experiment as compared to the system with bare carbon paper. Cyclic voltammetry asserted better electrochemical activity of the MFC systems with coated electrodes in the treatment of phenol. The electrochemical impedance spectroscopy data also supported the better performance of biocathodic phenol treatment with lower internal and charge transfer resistances. The scanning electron microscopy images confirmed the active biofilm formation on the electrode surface. The study indicates MFC as a viable option for the treatment of recalcitrant chemical compounds with energy recovery.
1. Introduction
Waste management is one of the major environmental concerns the world is facing at present. Different industries like chemical and petroleum produce a wide variety of wastes that have the cumulative effect in polluting the environment. Aromatic organic compounds are frequently observed as a common constituent present in the effluents from these industries. These organic compounds represent a group of potentially hazardous compounds that can impart serious health concerns. These organic compounds often present difficulty in treatment because of their complex nature and affect all life forms alike when discharged untreated. It is therefore crucial to treat these aromatic contaminants into biodegradable and less toxic compounds before discharging off into the water bodies.
Phenols are environmental pollutants that find their way into water bodies from various sources. Phenol is released in effluents from industries like coal gasification, oil refineries, paper and pulp, pharmacy, pesticides, fertilizers, dyes, and other chemicals.1,2 They have been listed under the category of priority pollutants by the US Environmental Protection Agency (USEPA) as they can be harmful to living organisms even at low concentrations.3 Their exposure can be hazardous to human health as it may lead to respiratory problems, irritation to the eyes and mucous membrane with their long-term exposure may even lead to cancer.4 Ingestion, inhalation, or skin absorption of phenol may even lead to fatality in severe cases.5 Studies have suggested that phenols tend to inhibit microbial activity at concentrations higher than 5.5 mg/L. The World Health Organization (WHO) has regulated phenol concentration of 1 μg/L in drinking water.5 Thus, it is of utmost importance to treat the wastewater contaminated with phenol properly before being discharged into water bodies. Conventional methods of treatment like solvent extraction, chemical oxidation, ion exchange, and physical adsorption have been widely used to treat wastewater contaminated with phenol but these methods present the limitations of high cost, low efficiency, and harmful byproduct generation.3
Recently, bioelectrochemical systems have proved to be efficient technology in the treatment of toxic pollutants at no extra treatment cost. Microbial fuel cell (MFC) is a category of bioelectrochemical systems that treats the organic contaminant under the action of microorganisms acting as catalysts and generates bioenergy in the form of electrical power.6 MFC, thus, is considered a promising technology for harvesting green energy and clean water by treating waste coming from industries. Various types of organic wastes have been successfully treated with MFC technology like leachates,7 dyes,8,9 and chlorophenols.10 Multiple studies have reported the treatment of phenol in a MFC under both anaerobic and aerobic conditions but no study currently compares the treatment of phenol under anaerobic (bioanodic) and aerobic (biocathodic) conditions of MFC and presents an overall performance under different external conditions.1,3,4
Even though the MFC is a remarkable environmentally friendly technology, the power output from the system is still too low for practical application of the technology notably because of the restrained interaction between the microbial community and the electrode thereby limiting the electron transfer.11 Different factors affect the performance of the MFC by interfering with the biofilm and electrode interaction, among which the electrode materials have been noted to play a significant role12 as the rate of electron transfer between the electrode and biofilm interface formed, playing a critical role in the current and power output of MFC is largely governed by the conductivity, stability, and biocompatibility of the electrode involved.13 Carbon materials like carbon paper, cloth, and felt are the most widely used electrode materials in the MFC because of their low cost, admirable electrical conductivity, biocompatibility, noncorrosiveness, and chemical stability;14 however, they show low electrocatalytic activity for the electrode microbial growth.15 For the improved power output, different researchers have focussed on both cathodic and anodic modification, however, many researchers consider the anode to be a limiting factor for high power generation as it directly influences bacterial growth and the rate of electron transfer between the anode and microbes,15 making it a prime focus to improve the morphological and chemical properties of the bioanodes. Thus, a high performing anode material with excellent conductivity, high surface to volume ratio, and high microbial affinity with economic stability is essentially the main approach for the improved cell performance. While designing and fabricating a new anode, the two crucial points to be considered are high stability and performance of the synthesized electrode with better porosity to achieve higher bacterial adhesion to the surface thus improving the exoelectrogenic electron transfer.11,16 Carbon nanotubes (CNTs), since their discovery by Ijiima et al. in 1991, have been the center of attention and are recently receiving considerable interest in the fabrication of electrodes because of their unique properties like high thermal and electrical conductivity, high surface to volume ratio, superior mechanical strength, and light weightedness.17,18 However, CNTs can be toxic and inhibit cell growth therefore CNTs are incorporated with other compounds to modify their properties.19 Conducting polymers like polyaniline (PANI) and polypyrrole (PPy) due their conductive, biocompatible, and stable nature have recently been incorporated in CNTs to obtain new nanocomposites with enhanced properties and used for electrode modification.20 The hybrid nanocomposites with unique features of individual components like better mechanical strength and high surface area to volume ratio from CNTs and biocompatibility and stability from polypyrrole can substantially improve the biofilm–electrode interaction on the synthesized electrode thus improving the MFC output.21 Zou et al. (2008) synthesized the CNT/polypyrrole nanocomposites, studied the performance of the MFC utilizing glucose as the substrate, and reported that the performance of the MFC system improved when the coated electrode was used as an anode as compared to the bare carbon paper.19 Mishra et al. (2016) coated the multiwalled CNTs manganese oxide/polypyrrole (MWCNT-MnO2/PPy) nanocomposite on carbon cloth and observed that the performance of the MFC in terms of power density (PD) was improved dramatically.15
The focus of the present study is to demonstrate the performance of the MFC in treating higher concentrations of phenol anaerobically and aerobically in dual-chambered MFCs. Most of the works previously performed using MWCNT/PPy nanocomposite-coated electrodes have employed simple carbon sources. Zou et al. (2008) used glucose as the substrate while utilizing CNT/PPy-modified carbon paper electrode, whereas Roh and Woo (2015) used a lactate-enriched carbon source while using the carbon felt electrode.19,22 However, in practical application the waste is seldom composed of simple carbon sources and is more likely to be composed of toxic, recalcitrant compounds. The novelty of this study lies in its comparative analysis of toxic phenol waste under varying environmental conditions and studying the impact of the MWCNT/PPy-coated electrode on MFC performance. The scanning electron microscopy (SEM) was used to confirm the successful coating and effective biofilm formation on the electrodes. The study further presents the effect of the nanocomposite-coated electrode on the performance of MFC treating phenol. Electrochemical behavior of phenol treating MFC with coated and bare electrodes has also been compared and substantial results in terms of PD and Coulombic efficiency (CE) have been drawn.
2. Results
2.1. Characterization of the Synthesized Nanocomposite Using Fourier-Transform Infrared Spectroscopy and X-ray Diffraction Spectroscopy
To confirm the synthesis of MWCNT/PPy nanocomposites, Fourier-transform infrared (FTIR) spectroscopy of the synthesized material was performed. Figure 1a shows the FTIR spectra of the functionalized MWCNT, PPy, and MWCNT/PPy nanocomposites. For, functionalized MWCNT, the characteristic bands were observed at 1034, 1392, 1626, 1742, and 3438 cm–1 corresponding to the C–O stretching, C=C stretching, and C=O stretching vibration of the −COOH group which is displayed as a result of acid treatment and −OH stretching, respectively.23 For PPy, the fundamental asymmetric and symmetric ring vibrations were obtained at 1550 and 1468 cm–1, −C–H in-plane vibrations as can be seen in the graph were obtained at 1300 and 1042 cm–1, and −C–H out-of-plane vibration at 912 cm–1 with a C–N stretching peak observed at 1188 cm–1. The spectrum of MWCNT/PPy showed the characteristic PPY and MWCNT peaks with a small shift as a result of the interaction between PPY and MWCNT nanocomposites. The PPY peak in MWCNT/PPy appeared at 896 cm–1 attributed to −C–H out-of-plane deformation, 1038 and 1300 cm–1 for −C–H in-plane deformation, 1302 cm–1 for C–N stretching with a characteristic pyrrole ring symmetric and asymmetric peak at 1462 and 1546 cm–1, respectively.19,24
Figure 1.
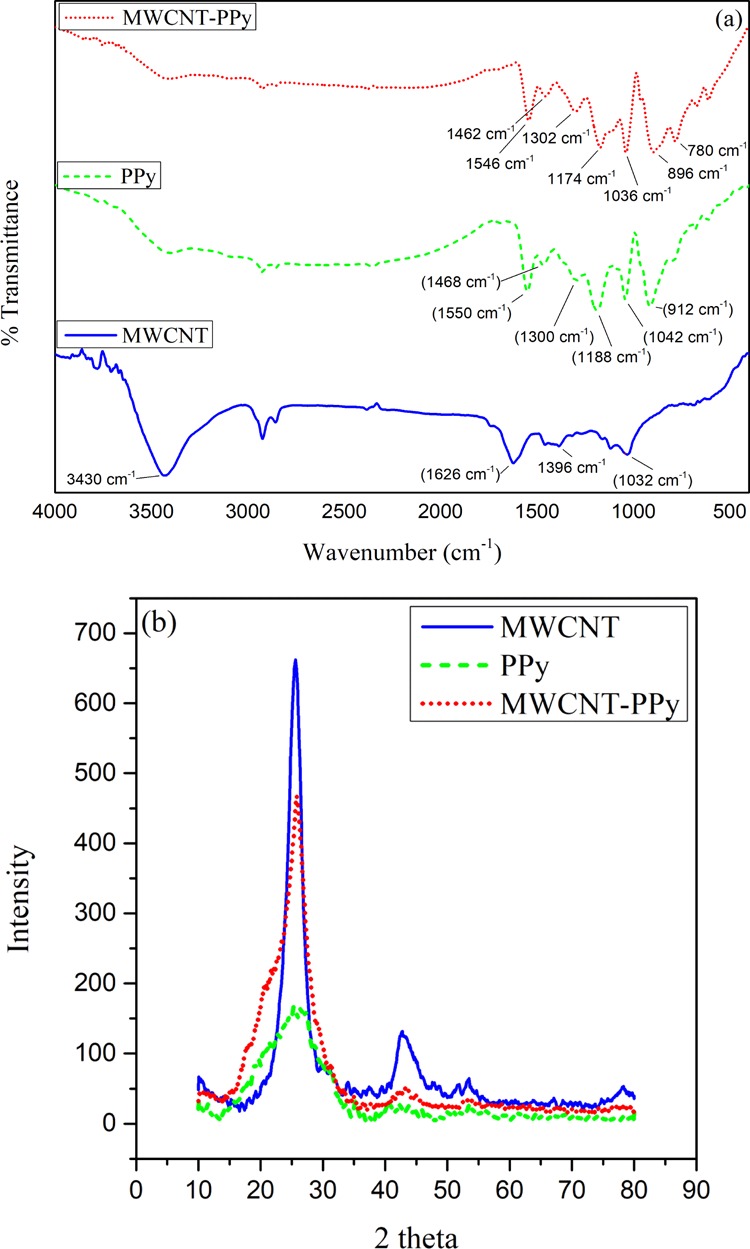
(a) FTIR analysis and (b) XRD plot of as synthesized MWCNT, PPy, and MWCNT/PPy nanocomposites.
Figure 1b shows the X-ray diffraction (XRD) plot that reveals diffraction patterns of functionalized nanotubes, PPy and the synthesized nanocomposite. At the 2θ values of 25.55 and 42.75°, two well-resolved diffraction peaks were observed in the XRD plot of the functionalized MWCNT. A single broad peak of PPy at 22.75° justifies its amorphous nature. The XRD sequence of the MWCNT/PPy nanocomposite reveals the characteristic peaks of MWCNTs (at 25.8 and 43.4°). However, PPy inclusion to MWCNT marginally decreased the intensity and broadened the diffraction peaks, which could be an indication of the reduced crystallinity of the CNTs as also suggested by Ghasemi et al. (2015).20,25 The change in the diffraction peak indicates the successful synthesis of the nanocomposites.
2.2. Bioelectricity Generation and Cell Voltage Profile of MFCs Treating Phenol
The energy recovery in terms of output voltage was recorded for all four MFCs treating the phenol under anaerobic and aerobic conditions, respectively. Experimental results revealed that the treatment of phenol under different conditions in the MFC could generate different electric outputs. The graphs of the voltage (mV) plotted across time (h) at different phenolic concentrations have been presented in Supporting Information, Figure S1a,b. For the bioanodic and biocathodic (bare MFC) B-MFC systems, after the acclimation period, the first experimental concentration was introduced and an immediate voltage output of 85 and 87 mV was recorded for bioanodic and biocathodic B-MFC, respectively. Both the MFCs displayed a significant difference in the performance in terms of voltage generation. From the plot it can be observed that biocathodic B-MFC performed better in terms of voltage recovery as compared to the bioanodic B-MFC. As soon as a drop to around 100 mV in the voltage was recorded with the exhaustion of the substrate, a fresh feed of glucose (co-substrate) was added into the system. The peaks appearing in the graph signifies the fresh feed of glucose to the reactor. The peak voltage output was observed to be 664 mV for bioanodic B-MFC while for biocathodic B-MFC the maximum voltage output was recorded to be 754 mV. The highest voltage recovery for both the setups was recorded for the 200 mg/L phenol batch. It was also observed that the voltage output declined as the phenol concentration amplified for both the reactors. This decrease in the voltage recovery could be linked to the rising toxicity of phenol that inhibited the performance of the microbial community present in the reactors. Similar observations reporting the retarded performance of the MFC in the presence of high concentrations of toxicants have also been presented by other research groups.26 The performance of the biocathodic B-MFC in terms of energy recovery was nearly 14% higher as compared to the bioanodic B-MFC representing that the MFC performed better when toxicants like phenol are present in the aerobic chamber. Different environmental conditions (anaerobic and aerobic) provided could have also resulted in the dissimilitude between the performances of the two reactors. The lower voltage recovery in the case of the bioanodic B-MFC can possibly be related to either the toxic effect of phenol on the anaerobic community leading to decreased electron generation or because of the utilization of the produced electrons in the reduction of phenol thus lowering the overall electron availability at the anode and hence the performance.27 In the biocathodic B-MFC on the other hand, the electron recovery is more prominent as the toxic phenol is present in the cathodic chamber thereby not affecting the anaerobic microbial community degrading the substrate to release electrons. These recovered electrons travel through the circuit to the cathodic chamber to be accepted by the terminal electron acceptor, thus generating higher electric output.
2.3. Power Generation and Wastewater Treatment Efficiencies
Electric power was used as an important parameter in monitoring the long term performance of the system. Organic removal was also monitored throughout the study in terms of chemical oxygen demand (COD) removal efficiency. The highest PDs for the systems treating phenolic wastewater using bare electrodes were calculated to be 469.038 and 604.804 mW/m2 for the bioanodic B-MFC and biocathodic B-MFC, respectively. The peak in the PD curve was observed every time a fresh cycle of glucose (co-substrate) was introduced into the system, and a sink in the PD represents the consumption of the available substrate by the microbial community. A lower PD is observed in the case of bioanodic B-MFC contrary to the biocathodic B-MFC, which suggested that the electrons generated in the anodic chamber could have dissipated by the phenol present in the same chamber for its reduction thereby acting as an electron acceptor and reducing the availability of electrons at the electrode to flow across the circuit that eventually results in lowering the PD of the bioanodic B-MFC. Alternatively, in the case of the biocathodic B-MFC, as phenol is present in the cathodic chamber, a greater flux of electrons is produced in the anodic chamber flow through the circuit, thus producing a higher power output. The performance of both the systems decreased as the concentration of the phenol in the system increased which can be a manifestation of the toxic effect of phenol on the microbial community present thus retarding the overall performance.
Further, a comparative analysis of phenol treatment using a MWCNT/PPy nanocomposite-coated anode was also performed and the power recovery was better for the MFCs utilizing coated anodes under both anaerobic and aerobic conditions. The highest PDs achieved for coated anodes performing bioanodic and biocathodic treatment are 560.719 and 650.557 mW/m2, respectively, which could be because of the better electron transfer between the microbial community and anode as also suggested by Zou et al. (2008).19 A similar pattern of diminished performance with increasing concentration was followed by the MFCs utilizing coated electrodes which again shows that phenol toxicity affected the overall performance of the system.
The efficiencies of all the systems in treating the wastewater were estimated in terms of COD removal efficiency. For both the setups, the phenolic concentration of 200 mg/L displayed the highest COD removal efficiencies of 77.24 and 82.17% for bioanodic and biocathodic B-MFC, respectively. The highest PD achieved in affiliation with the COD indicates that the energy output was achieved at the expense of COD removal. It was observed during the study that the performance of the biocathodic B-MFC was better as compared to the bioanodic B-MFC throughout the span of the study. Figure 2a,b presents the PD generated and COD removal efficiency achieved using bare carbon paper electrodes during the study. In comparison to the B-MFCs, the systems utilizing nanocomposite-coated electrodes (C-MFCs) performed excellently with admirable treatment achieved within a week of operation with the highest COD removal efficiencies of 80.548 and 82.169% for the bioanodic C-MFC and biocathodic C-MFC. Figure 2c,d presents the performance of the electrode-modified MFC at the best performing phenolic concentration of 200 mg/L.
Figure 2.
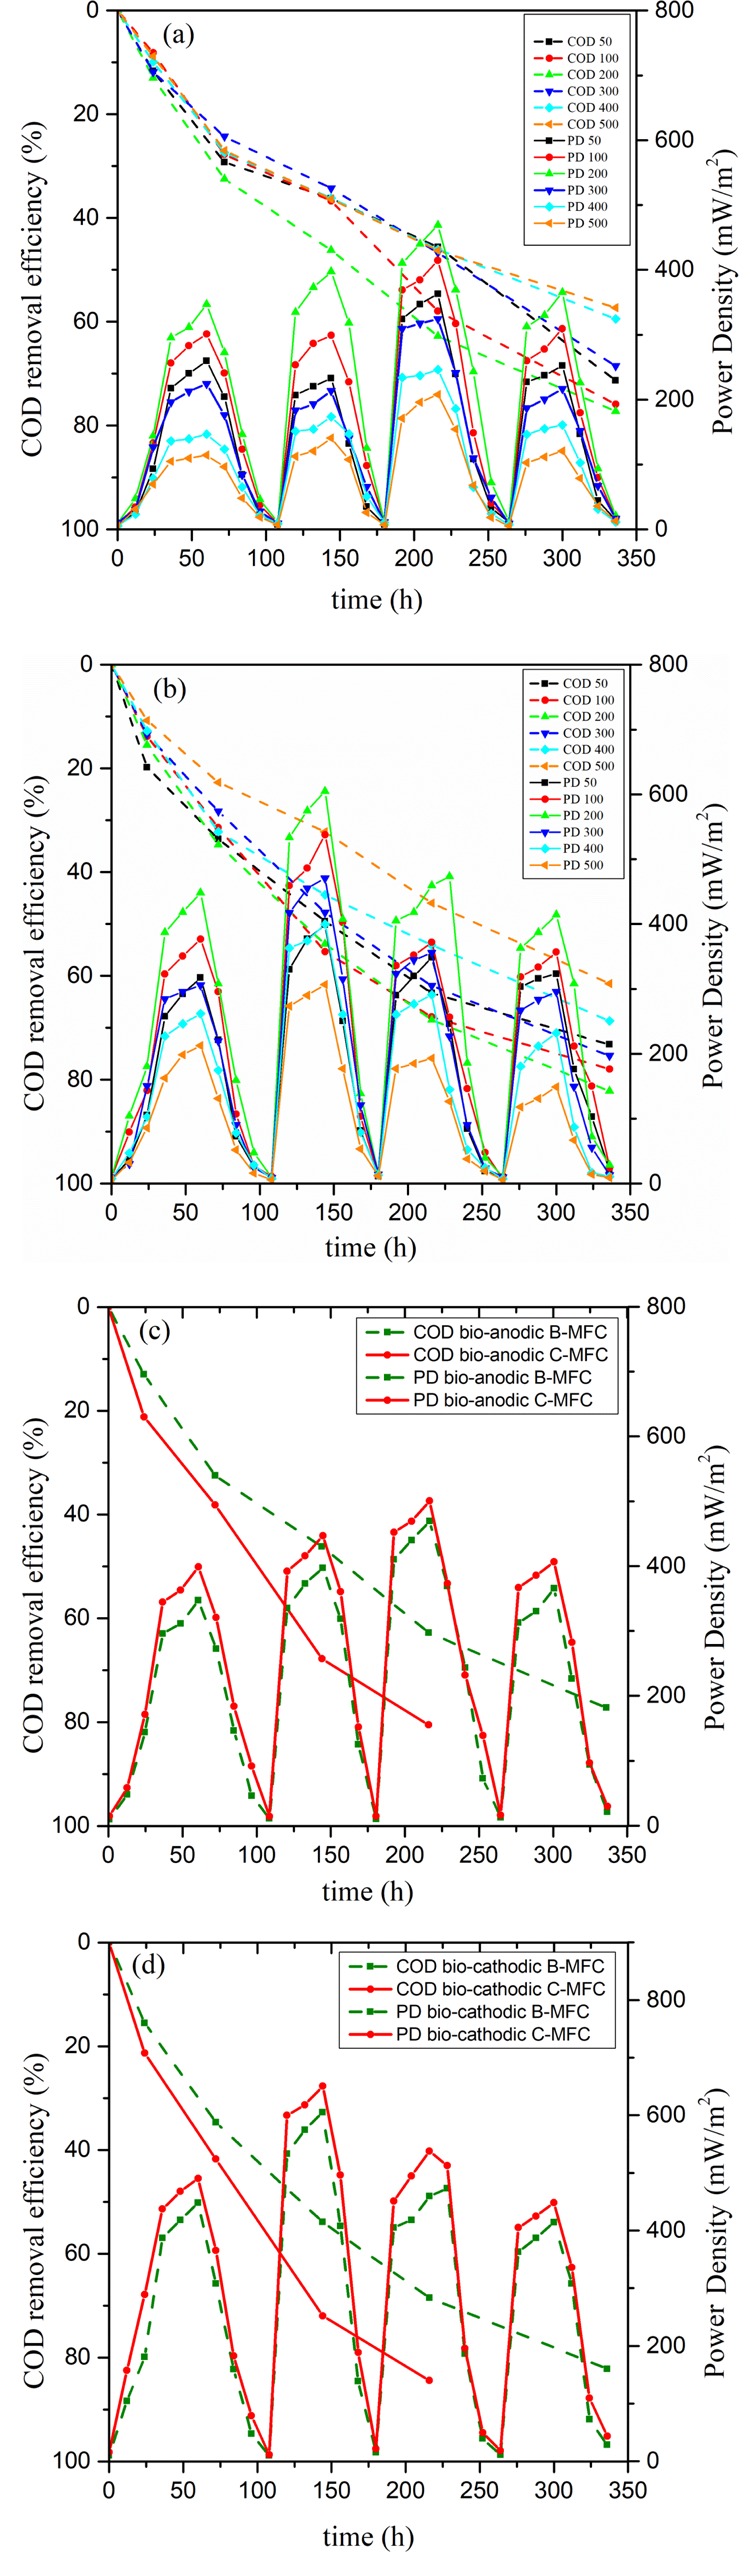
Power density and COD removal efficiency for (a,b) at different phenol concentrations in bioanodic and biocathodic B-MFCs and (c,d) bare and coated anode at 200 mg/L concentration.
2.4. CE Observed during Phenolic Treatment in the MFC
The output energy efficiency of the MFC systems was estimated in terms of the CE. At a phenolic concentration of 200 mg/L, the 24 h CE was observed to be maximum and it was found to be 2.220 and 2.315% for bioanodic and biocathodic B-MFCs, respectively. The performance in terms of the CE decreased with the increase in the concentration of phenol indicating the toxic effect of phenol on the microbial community, thereby affecting the performances of both the setups.28 The lower CE could also be due to the lower surface to volume ratio that also affected the microbial biofilm growth in the system, thus further affecting the performance of the MFC.29 The consistently lower performance of the bioanodic B-MFC as compared to the biocathodic B-MFC also suggests that the toxic nature of phenol present in the anodic chamber affects the production of electrons thereby affecting the CE and MFC performance. Figure 3a presents the CE of bioanodic and biocathodic B-MFCs, respectively. The comparatively low PDs and CEs could be the result of a lower surface area to volume ratio of the system as has also been reported by Penteado et al. (2018).30
Figure 3.
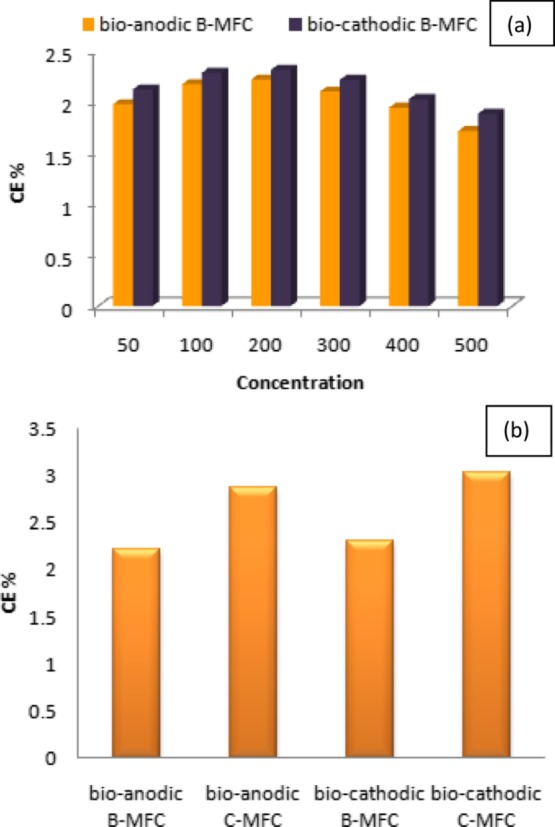
CE for (a) anaerobically and aerobically treated phenol at different concentrations and (b) bare and modified electrode at a phenol concentration of 200 mg/L.
The comparative analysis of the bare and MWCNT/PPy-modified electrode revealed the enhanced CE in the case of nanocomposite-modified systems, however, it was demonstrated from the results obtained that the biocathodic C-MFC still performed better as compared to the bioanodic C-MFC. Figure 3b presents the comparative CEs of B-MFCs and C-MFCs at the best performing phenolic concentration of 200 mg/L. As can be seen from the graph, the highest CEs for bioanodic and biocathodic C-MFCs were 2.87 and 3.03%, respectively.
2.5. UV/Visible Analysis of Phenol
UV/vis spectroscopy was conducted to investigate the phenol treatment efficiency of the four MFCs by scanning the effluent sample in the wavelength range of 200–700 nm. Figure S2a–d (Supporting Information) shows the UV/vis spectra for bioanodic and biocathodic B-MFCs and bioanodic and biocathodic C-MFCs, respectively, treating 200 mg/L of phenol. A characteristic absorption peak for phenol was observed at 270 nm.31 The highest intensity was observed on the first day of the experiment as can be seen in the graph, and the decrease in absorbance with time indicates the degradation of phenol.
The comparative study of the MFCs utilizing a bare and coated anode revealed that the treatment of phenol was quickly performed (within a week) for C-MFCs as compared to the B-MFCs (15 days) indicating that the anode coating improved the treatment efficiency greatly which could be because of the better assimilation of the substrate to produce electrons.
2.6. Scanning Electron Microscope and Energy-Dispersive X-ray Spectrometry Analyses for Observation of Bacterial Adhesion
The SEM imaging was performed to confirm the growth of the microbial community in all the systems treating phenol with coated and bare electrodes and it attested to the presence of microbial communities in all the systems (Figure 4a–f). However, the type and dominance of the microbial community varied widely for coated and bare electrodes with mainly the spherical community dominating when bare anodes were used. Contrarily, in the case of the systems using MWCNT/PPy-coated electrodes, the microbial community majorly present was rod-shaped as observed from SEM images. Energy-dispersive X-ray spectrometry revealed the elemental composition of bare and MWCNT/PPy-coated electrodes and the sludge treating the systems. It was observed to be nearly similar for all the systems with the elemental dominance of Na, K, Al, Zn, Fe, Mg, and Si in the sludge from the micronutrients added (Figure S3).
Figure 4.
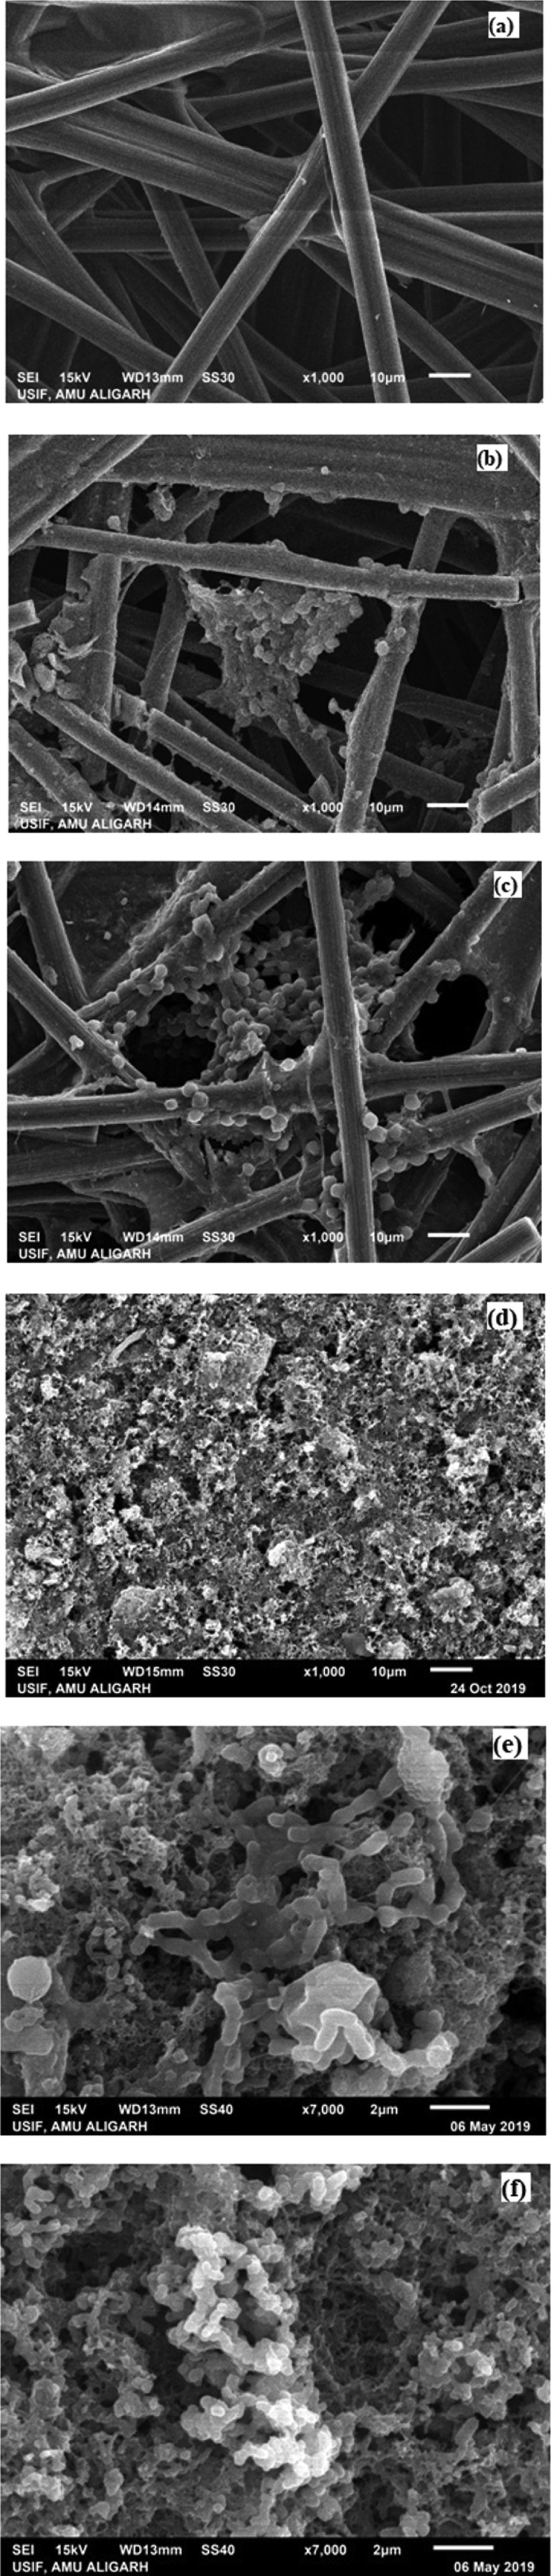
Scanning electron micrographs of (a) plain carbon paper, (b,c) bioanodic and biocathodic B-MFC carbon paper anodes, (d) MWCNT/PPy nanocomposite-coated carbon paper and (e,f) bioanodic and biocathodic C-MFC carbon paper anodes coated with MWCNT/PPy, respectively.
2.7. Electrochemical Analysis Using Cyclic Voltammetry and Electrochemical Impedance Spectroscopy
To reveal the biocatalytic activity of the anodic biofilm in the four MFCs, cyclic voltammetry (CV) was performed and the voltammograms were compared for bare and MWCNT/PPy-coated carbon paper anodes. A better electrocatalytic activity was observed in the biocathodic B-MFC as compared to the bioanodic B-MFC with evident redox peaks, whereas no distinguishable reduction peak was observed in the bioanodic B-MFC. The results depicted in the Figure 5a,b show well-defined redox peaks for the MFC with MWCNT/PPy-coated carbon paper electrodes as compared to the bare carbon paper electrode utilizing MFCs. The results confirm the improved electrocatalytic activities in the case of bioanodic and biocathodic C-MFCs as compare to B-MFCs with well-defined redox peaks in the former. As can be seen from Figure 5a, a diminished oxidation peak at 0.089 V is present with no distinguishable reduction peak in the case of bioanodic B-MFC. However, prominent oxidation peaks at 0.192 and 0.445 V are observed with two reduction peaks at 0.217 and −0.182 V for bioanodic C-MFC. Likewise in the case of the biocathodic B-MFC, diminished oxidation and reduction peaks are observed at 0.122 and 0.197 V while for the C-MFC a more pronounced oxidation peak at 0.348 V with a prominent reduction peak at −0.209 V was observed. Similar results have also been observed by Zou et al. (2008) while utilizing MWCNT/PPy-modified anode for the assimilation of glucose in the MFC.19 The improved redox profile in the case of the modified electrodes could be due to the better electron transfer efficiency between the microbial community and the electrode, as has been suggested by Khilari et al. (2015).32
Figure 5.
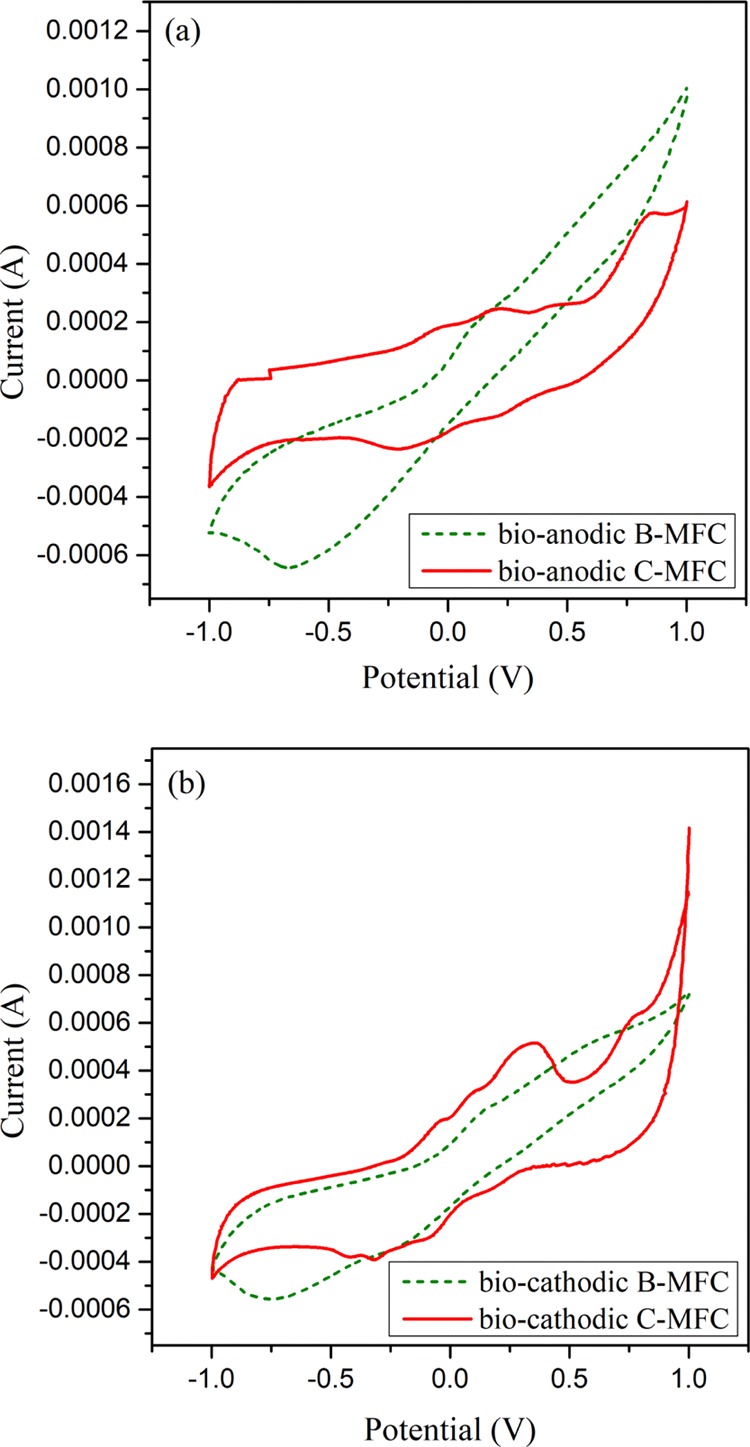
Cyclic voltammograms of MFCs with bare and MWCNT/PPy-modified anode treating phenol under (a) bioanodic (anaerobic) and (b) biocathodic (aerobic) conditions.
Electrochemical impedance spectroscopy (EIS) serves as an important technique to elucidate the electrochemical phenomenon taking place in the system. The technique has been widely used to derive the internal resistance of MFC systems which can be broadly divided into 3 main components viz. ohmic resistance (RΩ), charge transfer resistance (Rct), and diffusion resistance (Rd).33,34 As shown in Figure 6 the EIS spectra of bioanodic and biocathodic B-MFCs were plotted and a significant difference was observed possibly owing to the different environmental conditions present in the system. The equivalent circuit models have been presented for both the systems and were obtained by fitting the data with the circuit model. The equivalent circuit for the bioanodic MFC shows ohmic and charge transfer resistance while for the biocathodic MFC, the circuit presents the additional element of warburg impedance representing the diffusion resistance presented by the biofilm.35 The significant presence of diffusion resistance in the biocathodic MFC with only glucose in the anodic chamber could be because of the dense biofilm developed at the anode offering slight resistance across the biofilm comparative to the bioanodic MFC. The resistance of the solution is represented by ohmic resistance while the charge transfer resistance depicts the activation losses presented by electron transfer from the solution to the electrode.36 The ohmic and charge transfer resistances determined for both the systems were found to be 315 and 58 Ω for the bioanodic B-MFC and 270 and 54 Ω for the biocathodic B-MFC. Biocathodic B-MFC was observed to have low ohmic and charge transfer resistances as compared to the bioanodic B-MFC which also favors the observed better PD results (Figure 6). The results indicate that although the dense biofilm present in the biocathodic MFC offers additional resistance, the lower ohmic and charge transfer resistances significantly improve the performance of the biocathodic system as compared to the bioanodic system.
Figure 6.
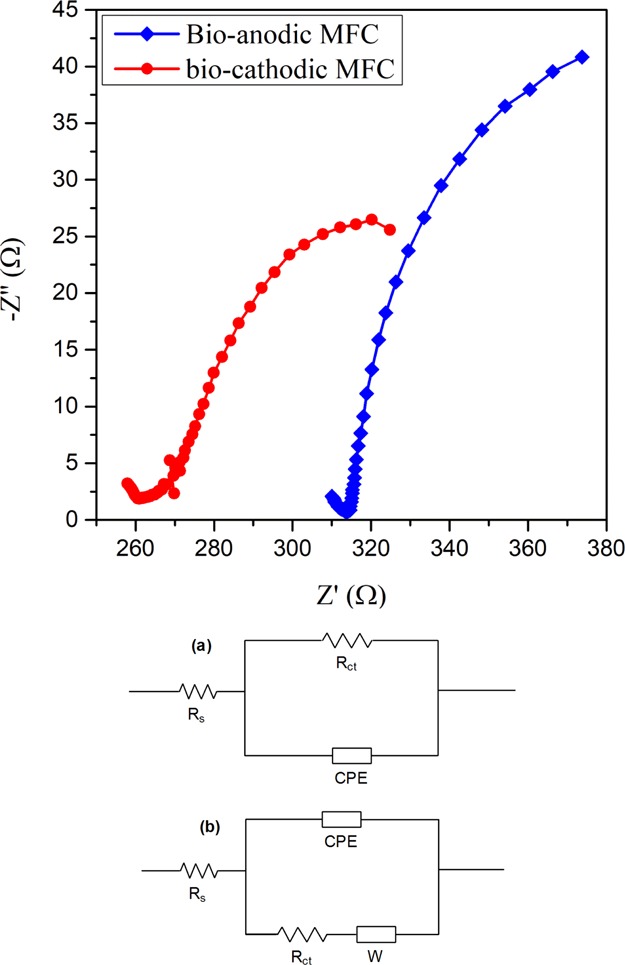
EIS spectra for bioanodic and biocathodic MFCs treating phenol with circuit diagram for (a) bioanodic MFC and (b) biocathodic MFC.
3. Conclusions
The MFC has in the past couple of decades, garnered considerable attention as an environmental and economically feasible technology for the elimination of chemical toxicants from various wastewater discharges. The study presented the comparative analysis of phenol treatment under anaerobic and aerobic conditions using bare and MWCNT/PPy nanocomposite-modified carbon paper anode. The results of the study displayed that the MFCs treating phenol under aerobic conditions (both B-MFC and C-MFC) performed better as compared to treatment of phenol under anaerobic conditions. The results also depicted that the increase in the concentration of phenol beyond 200 mg/L had a derogatory effect on the performance of MFCs. The results conclude that toxic phenol can be better treated under aerobic conditions in the MFC and the treatment efficiency can be greatly improved with the use of MWCNT/PPy-modified electrodes. However, it is crucial that the influent concentration is monitored before treatment to obtain superior performance.
4. Materials and Method
4.1. Chemicals
Carbon paper electrodes and Nafion 117 membrane were obtained from Vinpro Technologies (Hyderabad, India), and the Pyrrole monomer was obtained from Merck KGaA (Darmstadt, Germany). All the other chemicals were obtained from Thermo Fisher Scientific India Pvt. Ltd. (Mumbai, India) unless stated otherwise and were used as received.
4.2. Preparation of CNT-PPy Nanocomposite-Coated Electrode
4.2.1. Functionalization of CNT via Acid Treatment
The functionalization of MWCNT prior to the synthesis of MWCNT/PPy nanocomposites was done via the oxidative route through acid treatment in accordance with Okpalugo et al. (2005) and Mehdinia et al. (2014).37,38 For acid treatment, 1 g of MWCNT was refluxed with a mixture of the HNO3/H2SO4 (3:1) solution at room temperature for 15 h. Later, the treated concoction was filtered followed by washing with distilled water until the pH was neutralized. The washed precipitate was dried at 80 °C for 4 h to remove the moisture before being further used for nanocomposite synthesis.
4.2.2. Synthesis of MWCNT/PPy Nanocomposites
Functionalized MWCNT (0.2 g) was added to the 0.1 M HCl solution (150 mL) and sonicated for about 0.5 h at room temperature to disperse the MWCNTs evenly. A separate 100 mL of the solution of 0.67 g of PPy in 0.1 M HCl was prepared and added to the above solution of MWCNT in HCl. The suspension thus obtained was sonicated at the temperature of 0–5 °C with a dropwise addition of the solution of 0.82 g of ammonium per sulphate in 50 mL of 0.1 M HCl. The suspension was further sonicated for a period of 4 h at the temperature of 0–5 °C. After 4 h, the MWCNT/PPy composite was filtered and washed using distilled water. The precipitate was further washed with methanol until the colorless filtrate was observed. The precipitate thus obtained was dried under a vacuum for 24 h at room temperature.39Figure 7 presents the pictorial representation of MWCNT/PPy nanocomposite synthesis.
Figure 7.

Flow diagram of MWCNT/PPy nanocomposite-modified carbon paper anodes.
4.2.3. Electrode Coating
For electrode preparation, an even layer of 5 mg/cm2 of the MWCNT/PPy nanocomposite was deposited on the carbon paper surface. It was achieved by mixing a fixed amount of nanocomposites synthesized with 1 mL of polyvinylidene difluoride/n-methyl-2-pyrrolidone solution. The thus obtained black paste was hand-coated evenly on the surface of the electrode, pressed, and dried at 80 °C for 4 h.19
4.3. MFC Setup
Four identical MFC devices consisting of two cubical chambers each separated by Nafion-117 acting as proton exchange membranes were constructed. The effective working volume for each chamber was 200 mL. The carbon papers with a 20 cm2 surface area were used in both the setups as electrodes. Electrode pretreatment was done in accordance with Scott et al. (2008)40 to improve the performance of the MFC. For pretreatment, the electrodes were first washed in acetone followed by boiling for 15 min in 1.0 M HCl and finally rinsing with deionized water. Nafion-117 was also pretreated in accordance with our previous work10 in order to achieve higher permeability. A 470 Ω external load41,42 was applied and the electrodes were connected through a copper wire. To minimize the effect of changing environmental conditions, all experiments were performed in a temperature-controlled room with periodic stirring.
4.4. Inoculation and Operation
The study was performed to examine the effect of two variables on the systems—(i) effect of environmental conditions (anaerobic and aerobic) provided for phenolic wastewater treatment and (ii) effect of nanocomposite-coated electrode on MFC performance. The inoculum was collected from Okhla Sewage Treatment Plant, New Delhi with a mixed microbial community. To prepare the system before starting the experiment, the MFCs performing bioanodic phenol treatment (B-MFC and C-MFC with bare and coated electrode, respectively) were substrate-acclimated by inoculating the anodic chamber with the anaerobic sludge and feeding gradually with increasing concentrations of phenol (10–40 mg/L), and mineral salt media was added containing glucose (1 g/L) to sustain the growth of microbes. The cathodic chamber were filled with the phosphate buffer solution and opened to the ambient air without any external aeration. Conversely, the MFCs performing biocathodic treatment were inoculated with the anaerobically acclimated sludge in the anodic chamber with glucose to support the microbes and act as the electron donor while the aerobically acclimated inoculum added in the cathodic chamber along with phenol. The mineral salt media used to support the microbial community was prepared in accordance with Khan et al. (2017).43 Phosphate buffer solution (NaH2PO4, Na2HPO4; pH 7.2; 0.1 M) was added at the start of the experiment to maintain the initial pH close to neutral. After the sludge was successfully acclimatized for a period of 30 days, the solution was replaced with 50 mg/L as the first experimental phenol concentration and the circuit was closed. The concentration of phenol was stepwise increased from 50 to 500 mg/L during the study. A constant glucose concentration of 1 g/L was maintained and replenished every time the voltage dropped around 100 mV throughout the study. The systems were operated for a period of 15 days for each concentration and the samples were collected periodically for different analyses. The experiments were carried out at the controlled temperature of 30 ± 2 °C in duplicates.
5. Analyses
Samples for different analyses were collected over regular intervals of time from all the reactors. An automated digital multimeter was used to record the voltage generated across the external load (Kehao KH200, Xiamen Kehao Automation Co., Ltd, Fujian, China). PD was calculated from the voltage recorded across the applied resistance and reported in mW/m2. The CE was evaluated to determine the efficiency of the system in recovering the electrons produced as current. Standard methods were followed to determine the overall change in COD over time as the MFCs treat the waste.44 The overall treatment of phenol in the reactors was confirmed by performing the UV/visible spectrophotometry in the range of 200–700 nm while the change in the concentration of phenol was determined by measuring the change in absorbance at 270 nm (PerkinElmer Lambda 45, PerkinElmer, California, USA). CV analysis was performed to confirm the electroactivity in the system using an electrochemical analyzer (Autolab PGSTAT302N, Metrohm Autolab, Utrecht, Netherlands). The cycle was run with the anode as the working electrode, the cathode as the counter, and the Ag/AgCl electrode was used as the reference electrode at a scan rate of 10 mV/s with the potential window in the range of −1.0 to +1.0 V. EIS was also performed using the electrochemical analyzer (Autolab PGSTAT302N, Metrohm Autolab, Utrecht, Netherlands) under the two electrode system with the anode as the working electrode and cathode acting as counter and reference electrodes. The EIS analysis was conducted over the frequency range of 10 kHz to 5 mHz under the OCV conditions with a perturbation of 10 mV aptitude.45 The obtained EIS curve was fitted and simulated to obtain the equivalent electrical circuit. To confirm the accumulation of the biofilm on the surface of the electrodes used and the change in the elemental composition, SEM coupled with EDX was performed (JSM-6510LV, Jeol, Tokyo, Japan) following the pretreatment in accordance with our previous work.10
Acknowledgments
The authors are thankful to Aligarh Muslim University, Aligarh for providing necessary research facilities and University Grant Commission for departmental research support in the form of DRS II Grant. The authors are also thankful to the Council of Science and Technology, Uttar Pradesh (CST/1585) for funding this work.
Glossary
Abbreviations
- B-MFC
bare-microbial fuel cell
- CE
coulombic efficiency
- C-MFC
coated-microbial fuel cell
- CNT
carbon nanotube
- COD
chemical oxygen demand
- CV
cyclic voltammetry
- EDX
electron-dispersive X-ray spectroscopy
- EIS
electrochemical impedance spectroscopy
- FTIR
Fourier-transform infrared spectroscopy
- MFC
microbial fuel cell
- MWCNT
multiwalled carbon nanotubes
- PD
power density
- PPy
polypyrrole
- SEM
scanning electron microscopy
- XRD
X-ray diffraction spectroscopy
Supporting Information Available
The Supporting Information is available free of charge at https://pubs.acs.org/doi/10.1021/acsomega.9b02981.
Voltage output for bioanodic and biocathodic B-MFCs; UV/vis spectra of phenol treatment for coated and uncoated MFCs; and EDX spectra of bare, coated, and biofilm-coated carbon paper electrodes (PDF)
The authors declare no competing financial interest.
Supplementary Material
References
- Luo H.; Liu G.; Zhang R.; Jin S. Phenol Degradation in Microbial Fuel Cells. Chem. Eng. J. 2009, 147, 259–264. 10.1016/j.cej.2008.07.011. [DOI] [Google Scholar]
- Hosseini S. H.; Borghei S. M. The Treatment of Phenolic Wastewater Using a Moving Bed Bio-Reactor. Process Biochem. 2005, 40, 1027–1031. 10.1016/j.procbio.2004.05.002. [DOI] [Google Scholar]
- Song T.-s.; Wu X.-y.; Zhou C. C. Effect of Different Acclimation Methods on the Performance of Microbial Fuel Cells Using Phenol as Substrate. Bioprocess Biosyst. Eng. 2014, 37, 133–138. 10.1007/s00449-013-0975-6. [DOI] [PubMed] [Google Scholar]
- Friman H.; Schechter A.; Nitzan Y.; Cahan R. Phenol Degradation in Bio-Electrochemical Cells. Int. Biodeterior. Biodegrad. 2013, 84, 155–160. 10.1016/j.ibiod.2012.04.019. [DOI] [Google Scholar]
- Al-Khalid T.; El-Naas M. H. Aerobic Biodegradation of Phenols: A Comprehensive Review. Crit. Rev. Environ. Sci. Technol. 2012, 42, 1631–1690. 10.1080/10643389.2011.569872. [DOI] [Google Scholar]
- Khan M. D.; Khan N.; Sultana S.; Joshi R.; Ahmed S.; Yu E.; Scott K.; Ahmad A.; Khan M. Z. Bioelectrochemical Conversion of Waste to Energy Using Microbial Fuel Cell Technology. Process Biochem. 2017, 57, 141–158. 10.1016/j.procbio.2017.04.001. [DOI] [Google Scholar]
- Gálvez A.; Greenman J.; Ieropoulos I. Landfill Leachate Treatment with Microbial Fuel Cells; Scale-up through Plurality. Bioresour. Technol. 2009, 100, 5085–5091. 10.1016/j.biortech.2009.05.061. [DOI] [PubMed] [Google Scholar]
- Han T. H.; Khan M. M.; Kalathil S.; Lee J.; Cho M. H. Simultaneous Enhancement of Methylene Blue Degradation and Power Generation in a Microbial Fuel Cell by Gold Nanoparticles. Ind. Eng. Chem. Res. 2013, 52, 8174–8181. 10.1021/ie4006244. [DOI] [Google Scholar]
- Khan M. Z.; Singh S.; Sultana S.; Sreekrishnan T. R.; Ahammad S. Z. Studies on the Biodegradation of Two Different Azo Dyes in Bioelectrochemical Systems. New J. Chem. 2015, 39, 5597–5604. 10.1039/c5nj00541h. [DOI] [Google Scholar]
- Khan N.; Khan M. D.; Ansari M. Y.; Ahmad A.; Khan M. Z. Bio-Electrodegradation of 2,4,6-Trichlorophenol by Mixed Microbial Culture in Dual Chambered Microbial Fuel Cells. J. Biosci. Bioeng. 2019, 127, 353–359. 10.1016/j.jbiosc.2018.08.012. [DOI] [PubMed] [Google Scholar]
- Mashkour M.; Rahimnejad M.; Mashkour M.; Bakeri G.; Luque R.; Oh S.-E. Application of Wet Nanostructured Bacterial Cellulose as a Novel Hydrogel Bioanode for Microbial Fuel Cells. ChemElectroChem 2017, 4, 648–654. 10.1002/celc.201600868. [DOI] [Google Scholar]
- Muthukumar H.; Mohammed S. N.; Chandrasekaran N.; Sekar A. D.; Pugazhendhi A.; Matheswaran M. Effect of Iron Doped Zinc Oxide Nanoparticles Coating in the Anode on Current Generation in Microbial Electrochemical Cells. Int. J. Hydrogen Energy 2019, 44, 2407–2416. 10.1016/j.ijhydene.2018.06.046. [DOI] [Google Scholar]
- Santoro C.; Babanova S.; Artyushkova K.; Cornejo J. A.; Ista L.; Bretschger O.; Marsili E.; Atanassov P.; Schuler A. J. Influence of Anode Surface Chemistry on Microbial Fuel Cell Operation. Bioelectrochemistry 2015, 106, 141–149. 10.1016/j.bioelechem.2015.05.002. [DOI] [PMC free article] [PubMed] [Google Scholar]
- Cui H.-F.; Du L.; Guo P.-B.; Zhu B.; Luong J. H. T. Controlled Modification of Carbon Nanotubes and Polyaniline on Macroporous Graphite Felt for High-Performance Microbial Fuel Cell Anode. J. Power Sources 2015, 283, 46–53. 10.1016/j.jpowsour.2015.02.088. [DOI] [Google Scholar]
- Mishra P.; Jain R. Electrochemical Deposition of MWCNT-MnO2/PPy Nano-Composite Application for Microbial Fuel Cells. Int. J. Hydrogen Energy 2016, 41, 22394–22405. 10.1016/j.ijhydene.2016.09.020. [DOI] [Google Scholar]
- Mashkour M.; Rahimnejad M.; Mashkour M. Bacterial Cellulose-Polyaniline Nano-Biocomposite: A Porous Media Hydrogel Bioanode Enhancing the Performance of Microbial Fuel Cell. J. Power Sources 2016, 325, 322–328. 10.1016/j.jpowsour.2016.06.063. [DOI] [Google Scholar]
- Akbari E.; Buntat Z. Benefits of using carbon nanotubes in fuel cells: a review. Int. J. Energy Res. 2017, 41, 92–102. 10.1002/er.3600. [DOI] [Google Scholar]
- Yazdi A. A.; D’Angelo L.; Omer N.; Windiasti G.; Lu X.; Xu J. Carbon Nanotube Modification of Microbial Fuel Cell Electrodes. Biosens. Bioelectron. 2016, 85, 536–552. 10.1016/j.bios.2016.05.033. [DOI] [PubMed] [Google Scholar]
- Zou Y.; Xiang C.; Yang L.; Sun L.-X.; Xu F.; Cao Z. A Mediatorless Microbial Fuel Cell Using Polypyrrole Coated Carbon Nanotubes Composite as Anode Material. Int. J. Hydrogen Energy 2008, 33, 4856–4862. 10.1016/j.ijhydene.2008.06.061. [DOI] [Google Scholar]
- Ghasemi M.; Daud W. R. W.; Hassan S. H. A.; Jafary T.; Rahimnejad M.; Ahmad A.; Yazdi M. H. Carbon Nanotube/Polypyrrole Nanocomposite as a Novel Cathode Catalyst and Proper Alternative for Pt in Microbial Fuel Cell. Int. J. Hydrogen Energy 2016, 41, 4872–4878. 10.1016/j.ijhydene.2015.09.011. [DOI] [Google Scholar]
- Yellappa M.; Sravan J. S.; Sarkar O.; Reddy Y. V. R.; Mohan S. V. Modified Conductive Polyaniline-Carbon Nanotube Composite Electrodes for Bioelectricity Generation and Waste Remediation. Bioresour. Technol. 2019, 284, 148–154. 10.1016/j.biortech.2019.03.085. [DOI] [PubMed] [Google Scholar]
- Roh S.-H.; Woo H.-G. Carbon Nanotube Composite Electrode Coated with Polypyrrole for Microbial Fuel Cell Application. J. Nanosci. Nanotechnol. 2015, 15, 484–487. 10.1166/jnn.2015.8404. [DOI] [PubMed] [Google Scholar]
- Mi H.; Zhang X.; Xu Y.; Xiao F. Synthesis, characterization and electrochemical behavior of polypyrrole/carbon nanotube composites using organometallic-functionalized carbon nanotubes. Appl. Surf. Sci. 2010, 256, 2284–2288. 10.1016/j.apsusc.2009.10.053. [DOI] [Google Scholar]
- Mubarak N. M.; Wong J. R.; Tan K. W.; Sahu J. N.; Abdullah E. C.; Jayakumar N. S.; Ganesan P. Immobilization of Cellulase Enzyme on Functionalized Multiwall Carbon Nanotubes. J. Mol. Catal. B: Enzym. 2014, 107, 124–131. 10.1016/j.molcatb.2014.06.002. [DOI] [Google Scholar]
- Guo H.; Zhu H.; Lin H.; Zhang J. Polypyrrole-multi-walled carbon nanotube nanocomposites synthesized in oil-water microemulsion. Colloid Polym. Sci. 2008, 286, 587–591. 10.1007/s00396-007-1828-0. [DOI] [Google Scholar]
- Jayashree C.; Sweta S.; Arulazhagan P.; Yeom I. T.; Iqbal M. I. I.; Banu J. R. Electricity Generation from Retting Wastewater Consisting of Recalcitrant Compounds Using Continuous Upflow Microbial Fuel. Biotechnol. Bioprocess Eng. 2015, 20, 753–759. 10.1007/s12257-015-0017-0. [DOI] [Google Scholar]
- Miran W.; Nawaz M.; Jang J.; Lee D. S. Chlorinated Phenol Treatment and in Situ Hydrogen Peroxide Production in a Sulfate-Reducing Bacteria Enriched Bioelectrochemical System. Water Res. 2017, 117, 198–206. 10.1016/j.watres.2017.04.008. [DOI] [PubMed] [Google Scholar]
- Catal T.; Bermek H.; Liu H. Removal of Selenite from Wastewater Using Microbial Fuel Cells. Biotechnol. Lett. 2009, 31, 1211–1216. 10.1007/s10529-009-9990-8. [DOI] [PubMed] [Google Scholar]
- Di Lorenzo M.; Scott K.; Curtis T. P.; Head I. M. Effect of Increasing Anode Surface Area on the Performance of a Single Chamber Microbial Fuel Cell. Chem. Eng. J. 2010, 156, 40–48. 10.1016/j.cej.2009.09.031. [DOI] [Google Scholar]
- Penteado E. D.; Fernandez-Marchante C. M.; Zaiat M.; Gonzalez E. R.; Rodrigo M. A. Optimization of the performance of a microbial fuel cell using the ratio electrode-surface area/anode-compartment volume. Braz. J. Chem. Eng. 2018, 35, 141–146. 10.1590/0104-6632.20180351s20160411. [DOI] [Google Scholar]
- Sonawane R. S.; Dongare M. K. Sol-Gel Synthesis of Au/TiO2 Thin Films for Photocatalytic Degradation of Phenol in Sunlight. J. Mol. Catal. A: Chem. 2006, 243, 68–76. 10.1016/j.molcata.2005.07.043. [DOI] [Google Scholar]
- Khilari S.; Pandit S.; Varanasi J. L.; Das D.; Pradhan D. Bifunctional Manganese Ferrite/Polyaniline Hybrid as Electrode Material for Enhanced Energy Recovery in Microbial Fuel Cell. ACS Appl. Mater. Interfaces 2015, 7, 20657–20666. 10.1021/acsami.5b05273. [DOI] [PubMed] [Google Scholar]
- Dai H.; Yang H.; Liu X.; Zhao Y.; Liang Z. Performance of Sodium Bromate as Cathodic Electron Acceptor in Microbial Fuel Cell. Bioresour. Technol. 2016, 202, 220–225. 10.1016/j.biortech.2015.12.008. [DOI] [PubMed] [Google Scholar]
- Hou J.; Liu Z.; Zhang P. A New Method for Fabrication of Graphene/Polyaniline Nanocomplex Modified Microbial Fuel Cell Anodes. J. Power Sources 2013, 224, 139–144. 10.1016/j.jpowsour.2012.09.091. [DOI] [Google Scholar]
- He Z.; Mansfeld F. Exploring the Use of Electrochemical Impedance Spectroscopy (EIS) in Microbial Fuel Cell Studies. Energy Environ. Sci. 2009, 2, 215–219. 10.1039/b814914c. [DOI] [Google Scholar]
- Sekar N.; Ramasamy R. P. Electrochemical Impedance Spectroscopy for Microbial Fuel Cell Characterization. J. Microb. Biochem. Technol. 2013, S6, 004. 10.4172/1948-5948.S6-004. [DOI] [Google Scholar]
- Okpalugo T. I. T.; Papakonstantinou P.; Murphy H.; McLaughlin J.; Brown N. M. D. High Resolution XPS Characterization of Chemical Functionalised MWCNTs and SWCNTs. Carbon 2005, 43, 153–161. 10.1016/j.carbon.2004.08.033. [DOI] [Google Scholar]
- Mehdinia A.; Ziaei E.; Jabbari A. Multi-Walled Carbon Nanotube/SnO2 Nanocomposite: A Novel Anode Material for Microbial Fuel Cells. Electrochim. Acta 2014, 130, 512–518. 10.1016/j.electacta.2014.03.011. [DOI] [Google Scholar]
- Fan J.; Wan M.; Zhu D.; Chang B.; Pan Z.; Xie S. Synthesis, Characterizations, and Physical Properties of Carbon Nanotubes Coated by Conducting Polypyrrole. J. Appl. Polym. Sci. 1999, 74, 2605–2610. 10.1002/(sici)1097-4628(19991209)74:11<2605::aid-app6>3.0.co;2-r. [DOI] [Google Scholar]
- Scott K.; Cotlarciuc I.; Head I.; Katuri K. P.; Hall D.; Lakeman J. B.; Browning D. Fuel cell power generation from marine sediments: Investigation of cathode materials. J. Chem. Technol. Biotechnol. 2008, 83, 1244–1254. 10.1002/jctb.1937. [DOI] [Google Scholar]
- Sultana S.; Khan M. D.; Sabir S.; Gani K. M.; Oves M.; Khan M. Z. Bio-electro degradation of azo-dye in a combined anaerobic-aerobic process along with energy recovery. New J. Chem. 2015, 39, 9461–9470. 10.1039/c5nj01610j. [DOI] [Google Scholar]
- Damiano L.; Jambeck J. R.; Ringelberg D. B. Municipal Solid Waste Landfill Leachate Treatment and Electricity Production Using Microbial Fuel Cells. Appl. Biochem. Biotechnol. 2014, 173, 472–485. 10.1007/s12010-014-0854-x. [DOI] [PubMed] [Google Scholar]
- Khan N.; Khan M. D.; Nizami A.-S.; Rehan M.; Shaida A.; Ahmad A.; Khan M. Z. Energy Generation through Bioelectrochemical Degradation of Pentachlorophenol in Microbial Fuel Cell. RSC Adv. 2018, 8, 20726–20736. 10.1039/c8ra01643g. [DOI] [PMC free article] [PubMed] [Google Scholar]
- American Society For Testing And Materials . Standard test methods for chemical oxygen demand (dichromate oxygen demand) of water. D1252-95. ASTM Annual Book of Standards; American Society Testing & Materials: Philadelphia, Pa, 1995. [Google Scholar]
- Zhang Y.; Sun J.; Hou B.; Hu Y. Performance Improvement of Air-Cathode Single-Chamber Microbial Fuel Cell Using a Mesoporous Carbon Modified Anode. J. Power Sources 2011, 196, 7458–7464. 10.1016/j.jpowsour.2011.05.004. [DOI] [Google Scholar]
Associated Data
This section collects any data citations, data availability statements, or supplementary materials included in this article.