

Abstract
Objectives
While mental health services provided by general practitioners and psychiatrists can be billed to public health insurance programs in Canada, services provided by psychologists, social workers and other non-physician providers cannot. This study assesses the extent to which access to mental health services varies by income after first taking into account the higher concentration of mental health needs at lower income levels.
Method
Data from the Canadian Community Health Survey 2013–2014 are used to calculate need-standardized concentration indices for access to mental health services.
Results
More pro-rich utilization of mental health services provided by non-physicians and more equitable utilization of physician services is found for psychologists and general practitioners, but not for social workers, nurses and psychiatrists. Unmet need for healthcare for mental health problems is found to be more pro-poor than unmet need for physical health problems.
Conclusion
By standardizing for inequitable distribution of mental health need, this study provides strong evidence that income-based inequity in access to mental health services is an issue under Canada’s two-tier system, particularly with regard to general practitioners and psychologists. For other types of providers, the results suggest that inequities in service utilization vary not just by Medicare coverage but also by service settings and target populations. Despite these variations, greater inequities in unmet need for mental health care than for physical health care suggest that inequity is the dominant reality for Canadians. The results provide a baseline that could be used to assess the equity impacts of policy reforms.
Keywords: Mental health, Access, Equity, Income, Canada, Concentration index
Résumé
Objectifs
Au Canada, les omnipraticiens et les psychiatres peuvent facturer leurs services de santé mentale aux programmes publics d’assurance-santé, mais les psychologues, les travailleurs sociaux et les fournisseurs autres que les médecins ne le peuvent pas. Nous avons cherché à évaluer si l’accès aux services de santé mentale varie selon le revenu, en tenant compte au préalable de la plus forte concentration de besoins en santé mentale aux niveaux de revenu inférieurs.
Méthode
À l’aide des données de l’Enquête sur la santé dans les collectivités canadiennes de 2013–2014, nous avons calculé des indices de concentration standardisés selon les besoins pour l’accès aux services de santé mentale.
Résultats
Nous avons constaté que l’utilisation des services de santé mentale fournis par les non-médecins est déséquilibrée en faveur des populations plus aisées; l’utilisation des services médicaux offerts par les psychologues et les omnipraticiens est plus équitable, mais ce n’est pas le cas pour les services des travailleurs sociaux, des infirmières et des psychiatres. Le besoin insatisfait de soins de santé pour les troubles de santé mentale est plus présent dans les populations démunies que le besoin insatisfait de soins de santé pour les troubles de santé physique.
Conclusion
En standardisant la distribution inéquitable des besoins en santé mentale, cette étude donne de fortes indications que les inégalités d’accès aux services de santé mentale fondées sur le revenu constituent un problème dans le système à deux vitesses du Canada, surtout en ce qui concerne les omnipraticiens et les psychologues. Pour les autres types de fournisseurs, les résultats indiquent que les inégalités dans l’utilisation des services ne varient pas seulement selon le régime public d’assurance-maladie, mais aussi selon le milieu de services et la population cible. Malgré ces écarts, les inégalités plus prononcées dans le besoin insatisfait de soins de santé mentale que de soins de santé physique donnent à penser que les inégalités sont la réalité dominante pour nos concitoyens et nos concitoyennes. Nos résultats constituent une base de référence qui peut servir à évaluer les répercussions des réformes de politiques sur l’équité.
Mots-clés: Santé mentale, Accès, Équité, Revenu, Canada, Indice de concentration
Introduction
Access to healthcare for mental health problems in Canada has been constrained by gaps in funding and public health insurance coverage dating back to the original hospital and physician insurance policies set in the 1950s and 1960s (Bartram and Lurie 2017). Funding stands between 5 and 7% of overall public spending on health, compared with 13% in the United Kingdom (Hewlett and Moran 2014; Jacobs et al. 2010; Wang et al. 2017). While mental health services provided by general practitioners (GPs) and psychiatrists can be billed directly to provincial and territorial health insurance plans, services provided by psychologists, social workers and other non-physician providers cannot. Under this two-tier system, two thirds of Canadians are estimated to have access to employment-based benefits that provide at least some degree of coverage for non-physician mental health services such as psychotherapy (Canadian Life and Health Insurance Association 2018). The remaining third either seek services that are available to varying degrees through publicly funded clinics across the country, pay out-of-pocket despite being least likely to be able to afford to do so, or go without. These differences in financial barriers are most pronounced for psychologists, who tend to be more concentrated in private practice than other non-physician providers (Hunsley et al. 2013).
These gaps and inequities in public health insurance coverage have likely contributed to high rates of unmet need for mental health services in Canada. For example, of the estimated 12% of Canadians aged 15 and over who reported having a need for counselling in 2012, one third reported that this need was either unmet or partially met (Sunderland and Findlay 2013). The equity picture is less clear. Regression analyses have generally identified need as the key factor determining utilization of mental health services, suggesting that public health insurance is reducing financial barriers to access as intended by policy-makers (Vasiliadis et al. 2005; Vasiliadis et al. 2009). At the same time, utilization has also been found to be more concentrated at higher income and education levels, which points to inequities in access (Hunsley et al. 1999; Vasiliadis et al. 2009). Access to psychiatrists has been found to be more concentrated at lower income levels everywhere in Ontario except for Toronto, where utilization is highest in the highest income quintile (Kurdyak et al. 2014).
To shed more light on this equity question, this study uses concentration indices (CIs) to measure the extent to which access to mental health services in Canada varies by income, after first standardizing for the fact that mental health needs are themselves more concentrated at lower income levels. In the context of Canada’s two-tier system, two specific hypotheses are tested. First, utilization of non-physician providers is expected to be more concentrated at higher income levels than utilization of physician providers, which is expected to be more equitably distributed across income levels (H1). Second, unmet need for healthcare for mental health problems is expected to be more concentrated at lower income levels than unmet need for healthcare for physical health problems (H2). This study is timely as significant new investments are being made to address this policy challenge. In 2017, the federal government started a 10-year $5 billion targeted transfer to support provincial and territorial efforts to improve access to mental health services. Provincial and territorial governments have begun to announce investments in areas such as structured psychotherapy, e-mental health services, and primary care networks. The results of this study provide a baseline that could be used to assess the equity impacts of these policy reforms.
Methods
Following the guidelines set out by O’Donnell and the World Bank (O’Donnell and World Bank 2008), this study uses data from the Canadian Community Health Survey to calculate need-standardized CIs for access to mental health services. This method was designed for measuring inequities in access to health services using population health survey data, after standardizing for the fact that health needs are inequitably distributed across the income gradient and after controlling for the influence of demographic variables such as education and rural residence on access. Need-standardized CIs of access to mental health services in Canada can shed light on the impact of the current two-tier mental health policy and can also contribute to the emerging body of CI-based research on inequities in health and mental health.
Just as Gini-coefficients measure income inequity by calculating how much of the share of income is taken up by the bottom 10% of population, the top 1% and so on, CIs were developed to measure how the share of various health and social outcomes is distributed along an income distribution. CIs are related to the diagrammatic approach of concentration curves. As can be seen in Fig. 1, these curves plot the share of a variable (such as a health outcome) accounted for by cumulative proportions of individuals in the population ranked from poorest to richest. When the cumulative proportion matches the share of the variable, the curve is a straight line at a 45° angle called the ‘line of equality’. When the outcome is concentrated at lower income levels, the line bows above this line (a pro-poor distribution), and when it is concentrated at higher income levels, the line bows below (a pro-rich distribution). A CI is calculated as twice the area between the concentration curve and the ‘line of equality’ with a range of values between − 1 and + 1. Negative values represent a pro-poor distribution, positive values represent a pro-rich distribution and zero values represent an equal distribution. An unequal distribution can also be considered inequitable, insofar as a health or social outcome is more concentrated at higher and lower income levels and thus invokes concerns about justice and fairness.
Fig. 1.
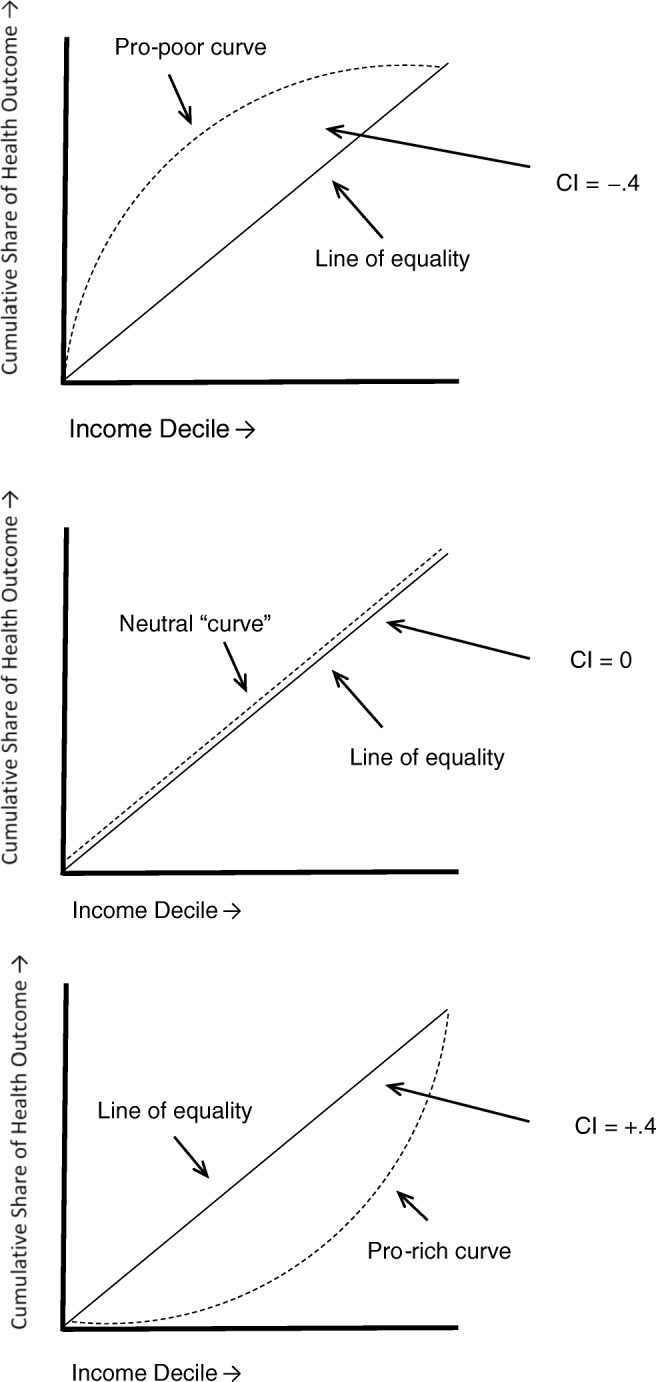
Illustrative example of concentration curves and concentration indices (CI)
CIs are increasingly being used to measure inequities in health outcomes and in access to healthcare (Grignon et al. 2010; Hosseinpoor et al. 2012; Hua et al. 2017; Jiménez-Rubio et al. 2008; Tavares and Zantomio 2017; Zhang et al. 2015). Higher concentrations of mental health problems (measured by CIs) have been found at lower income levels in former Soviet Union countries, the UK, Canada and Australia (Enticott et al. 2017; Goryakin et al. 2015; Mangalore et al. 2007). CI-based research has also found higher concentrations of mental health service utilization at higher income levels in the UK and Australia (Jokela et al. 2013; Meadows et al. 2015; Meadows and Tylee 2013). As this CI research did not standardize for need, these inequities in utilization would have been even greater if the higher concentration of mental health problems at lower income levels was first taken into account. This study is complementary to a comparative analysis of need-standardized CIs for access to mental health services using population health survey data from Canada and Australia (Bartram 2017); this Canada-only analysis includes a fuller range of mental health service providers, a comparison of unmet physical and mental health care needs, and illustrative concentration curves that were not possible in the comparative study.
Data and statistics
Data are drawn from the Canadian Community Health Survey (CCHS) Annual 2013–2014. The CCHS Annual is a cross-sectional survey on health status, health care utilization and health determinants for the Canadian population. It is a self-report survey with large sample (age 12+, N~65,000 annually) designed to provide reliable estimates at the health region level in all provinces and territories. The CCHS Annual has some core content and other content that is optional for provincial and territorial governments. The CCHS Annual excludes members of the Canadian Forces, as well as people who live on reserve, in institutional settings such as long-term care and hospitals, or in prison. Individual-level microdata were accessed through Statistics Canada’s Research Data Centre Program, and Stata was used for the statistical analysis.
Four kinds of variables are needed to apply O’Donnell and World Bank (2008) method for calculating need-standardized income-based inequities in access to mental health services: outcome, need, non-need (control), and ranking variables (see Table 1 for frequencies). As indicators of access, both past-year professional service utilization for mental health problems and past-year unmet need for health care are included as dichotomous outcome variables. Professional service utilization variables include GPs, psychiatrists, psychologists, nurses and social workers, and were gathered from respondents in Newfoundland and Labrador, Quebec, Ontario, Manitoba, British Columbia, the Northwest Territories and Nunavut. The service utilization sample size was 86,764 (after 9.1% of 95,477 observations were dropped due to missing values). The unmet need variables include unmet need for health care for physical health problems and for mental health problems, and were gathered in Newfoundland and Labrador, Ontario, Alberta and the Northwest Territories. The unmet need sample sizes were 56,007 for physical health problems and 54,659 for mental health problems (after 6.5% and 8.7% of 59,877 observations were dropped respectively due to missing values).
Table 1.
Descriptive statistics: outcome, need, non-need and ranking variables (weighted), CCHS 2013–2014
| Variable | Utilization sample (%)* | Unmet need sample (%)† |
|---|---|---|
| Outcome | ||
| Util: GP | 6.4 | NA |
| Util: psychiatrist | 2.3 | NA |
| Util: psychologist | 2.9 | NA |
| Util: nurse | 0.6 | NA |
| Util: social worker | 2.8 | NA |
| Unmet need: mental | NA | 1.1 |
| Unmet need: physical | NA | 6.7 |
| Need | ||
| Age 12–24 | 18.7 | 19.3 |
| Age 25–34 | 15.7 | 16.0 |
| Age 35–44 | 15.9 | 16.2 |
| Age 45–54 | 17.1 | 17.2 |
| Age 55–64 | 15.9 | 15.0 |
| Age 65–74 | 10.5 | 9.5 |
| Age 75–84 | 4.9 | 4.6 |
| Age 85+ | 1.3 | 1.2 |
| Female | 51.2 | 50.8 |
| Male | 48.8 | 49.2 |
| Poor/fair mental health | 6.2 | 6.7 |
| Poor/fair physical health | NA | 10.4 |
| Non-need | ||
| Educ: Less than secondary | 6.4 | 5.7 |
| Educ: Secondary | 11.4 | 12.8 |
| Educ: Some post-secondary | 3.9 | 3.2 |
| Educ: Post-secondary grad. | 78.3 | 78.3 |
| Immigrant | 26.2 | 29.1 |
| Non-urban | 25.0 | 24.0 |
| Non-need/ranking | Mean (Gini) | Mean (Gini) |
| Equiv. household income | $52,236 (.399) | $58,273 (.416) |
*Provinces and territories include NL, QC, ON, MB, BC, NT and NU
†Provinces and territories include NL, ON, AB and NT
A probit function is used to estimate expected access based on the three need variables: age, sex and self-reported poor/fair mental health. Self-reported mental health was chosen as the mental health need variable based on a sensitivity analysis of more in-depth data from CCHS 2012 Mental Health. This analysis found comparable income gradients for poor/fair mental health and a more objective mental health need indicator: meeting diagnostic screening criteria for any mood disorder. Further, regardless of whether self-reported mental health, mood disorders, or low-threshold distress was used as the need variable, comparable standardized CI results were found for GP and psychologist utilization. To control for potential bias, education, immigrant status, residence in non-urban areas and equivalized household income are also included as non-need variables in the probit function, set to their mean sample values. Household income is equivalized (divided by the square root of household size) to account for differences in purchasing power.
Next, need-standardized access is calculated by subtracting the predicted access from the actual access, and adding back the mean of predicted access for each observation. Finally, income-based inequities in access to mental health services are measured by calculating CIs for actual access and need-standardized access. In order to use equivalized household income as a ranking variable, a small random unique amount has been added to each observation to ensure that each value is unique. Through these calculations, a need-standardized CI measures any residual inequity that remains after the distribution of access that can be predicted based on need is subtracted from the actual distribution of access.
Results
The results presented in Table 2 confirm that there is an income gradient in the distribution of mental health need, with a pro-poor CI of − .252 (95% confidence interval[ci] = − 0.264, − 0.240) for the distribution of poor/fair mental health by equivalized household income. This result underscores the importance of first standardizing for need before measuring income-based inequity in access to mental health services.
Table 2.
Actual and need-standardized concentration indices (weighted), CCHS 2013–2014
| Variable | CI | CIst |
|---|---|---|
| Poor/fair mental health | − 0.252* (− 0.264, − 0.240) | NA |
| Utilization | ||
| GP | − 0.036* (− 0.051, − 0.022) | + 0.010 (− 0.004, + 0.024) |
| Psychiatrist | − 0.145* (− 0.170, − 0.120) | − 0.063* (− 0.087, − 0.039) |
| Psychologist | + 0.066* (+ 0.043, + 0.088) | + 0.096*(+ 0.074, + 0.118) |
| Nurse | − 0.141* (− 0.191, − 0.092) | − 0.070* (− 0.119, − 0.021) |
| Social worker | − 0.078* (− 0.101, − 0.055) | − 0.020 (− 0.042, + 0.002) |
| Unmet healthcare need | ||
| Mental health problem | − 0.237* (− 0.284, − 0.190) | − 0.135* (− 0.180, − 0.089) |
| Physical health problem | − 0.110* (− 0.120, − 0.084) | − 0.060* (− 0.077, − 0.042) |
Ninety-five percent confidence intervals in parentheses. CIst calculated by (a) standardizing for age, sex and self-reported poor/fair mental health, (b) controlling for education, immigration, non-urban residence and equivalized household income, and (c) ranking by equivalized household income
*p < 0.05
The next set of results reported in Table 2 compares the degree of income-based inequity in the distribution of the utilization of professional health services as provided by GPs and psychiatrists, which are fully covered by public health insurance, with the distribution of the services of psychologists, nurses and social workers, which are not covered. As predicted in H1, the need-standardized CI for utilization of psychologists is pro-rich at + 0.096 (95% ci = + 0.074, + 0.118) and is close to equitable for GPs at + 0.010 (95% ci = − 0.004, + 0.024). As can be seen in Fig. 2, the pro-poor concentration curve for psychologists bows down and the concentration curve for GPs tracks close to the 45° line of equality. After standardizing for need, the lower-income half of the population takes up roughly half of the share of people who report using GPs for a mental health problem, but only about 40% of the share for psychologist services. However, the need-standardized CIs for nurses at − 0.070 (95% ci = − 0.119, − 0.021) and social workers at − 0.020 (95% ci = − 0.042, + 0.002) are also close to line of equality rather than being pro-rich as predicted in H1, and the need-standardized CI for psychiatrists at − 0.063 (95% ci = − 0.087, − 0.039) is unexpectedly pro-poor as can be seen by the concentration curve bowing above the line of equality.
Fig. 2.

Need-standardized concentration curves for utilization, CCHS 2013–2014
The final set of results compares the degree of income-based inequity in the distribution of unmet need for healthcare for mental health and physical health problems. As predicted in H2, the need-standardized CI for unmet need for healthcare for mental health problems is more pro-poor at − 0.135 (95% ci = − 0.180, − 0.089) than for physical health problems at − 0.060 (95% ci = − 0.077, − 0.042). While both concentration curves in Fig. 3 bow above the line of equality, the mental health curve is more pronounced.
Fig. 3.

Need-standardized concentration curves for unmet need for healthcare, CCHS 2013–2014
Discussion
To be equitably distributed, access to mental health services has to be as concentrated at lower income levels as mental health need. By standardizing for this pro-poor distribution of need, this study provides strong evidence that income-based inequity in the distribution of access to mental health services is an issue in Canada. The first hypotheses predicting more pro-rich utilization of mental health services provided by non-physicians and more equitable utilization of physician services (H1) were confirmed for psychologists and GPs, but not for social workers, nurses, and psychiatrists. As predicted in the second hypothesis (H2), unmet need for healthcare for mental health problems was found to be more pro-poor than unmet need for physical health problems. While need is clearly a factor in determining access to mental health services, the findings from this study suggest that an equity gap remains between those services covered and not covered by Medicare.
The findings regarding utilization of different types of service providers suggest that Canada’s two-tier system has equity impacts, but largely with regard to GPs and psychologists. On the first tier, mental health services provided by GPs are fully covered by public health insurance. On the second tier, the services of psychologists working in private practice are either covered by employment-based benefits or paid for out-of-pocket, meaning that the financial barriers are generally the highest for Canadians with the lowest incomes. Moreover, where GPs tend to provide more biologically based mental health services (including a focus on prescription medications), psychologists provide services such as psychotherapy that focus more on psychosocial factors. Accordingly, the results point to inequities in access not just to mental health services in general, but to the kind of comprehensive care that can address the complex interplay of biological, psychological and social factors known to contribute to mental health problems.
The results for other types of providers suggest that income-based inequities in service utilization vary not just by Medicare coverage but also by service settings and target populations. The utilization of the two other types of non-physician providers in the study was relatively equitable. While some social workers also work in private practice, they are professionally oriented toward working with marginalized populations and may also be more likely than psychologists to work in publicly funded settings such as hospitals and community mental health centres. While nurses are not able to bill directly to provincial and territorial health insurance plans, they generally work in publicly funded healthcare settings such as primary care and hospitals.
The utilization of psychiatrists, the other type of physician provider, was even more concentrated at lower income levels than would be predicted based on need. Psychiatrists may work more with lower-income people because of the higher incidence of more serious mental illnesses at lower income levels. This study uses the broad binomial categories of poor/fair vs good/very good/excellent mental health as the mental health need variable; if the study had standardized for a more graduated indicator of mental health need, the pro-poor results for psychiatrists may have been less pronounced. Moreover, as psychiatrists are covered by public health insurance and psychologists are not, lower-income Canadians may be more likely to either be referred to or seek out psychiatric services. To the extent that lower-income people living with mental health problems have less social support and face more stigma, they may also be more likely to be hospitalized for mental illnesses or present at emergency departments where psychiatrists are likely to be encountered.
The comparison between unmet need for health care for physical and mental health problems in Canada provides a broader perspective on income-based inequities in access. While there are variations in the results for utilization, the finding of greater inequities in unmet need for mental health care suggests that inequity is the dominant reality for Canadians. This broad finding may be driven by the financial barriers in access to psychologist services.
A key limitation of the study is its inability to measure income-based inequities in other potential access barriers such as stigma, language of service provision or a preference to self-manage a mental health problem. These barriers are considered predisposing factors in the dominant theory of access to healthcare and have been found to influence access to mental health services in Canada (Anderson 1995; Sunderland and Findlay 2013). While these variables are included in the CCHS Annual, it was not possible to calculate meaningful CIs as they are only collected from the subsample of respondents with unmet needs. Future research could use qualitative methods to explore how these predisposing factors interact with financial barriers in access to mental health services, particularly among lower-income Canadians. This study is also limited by its use of self-reported survey data, which relies on people’s ability to accurately report their mental health status, use of services, income and so forth. Although administrative data are generally limited to physician and hospital-based services, future research could use need-standardized CIs to assess income-based inequities in re-hospitalizations for mental illness within 30 days as an indicator of inequities in access to mental health services in the community.
Conclusion
With the $5 billion targeted federal mental health transfer rolling out through 2027, there is a critical window of opportunity to set a baseline and track results. When standardized for need, CIs are a strong, high-level indicator of income-based inequity that could be used to track changes in income-based inequities in access to mental health services. To support these objectives, Statistics Canada will need to have robust data on access to mental health services, both utilization and unmet need, for all provinces and territories rather than just those who opt-in to one component or another. Further, tracking changes in stigma will be critical for contextualizing changes in access; to the extent that stigma is decreasing, more and more people are likely to seek care, thus potentially driving up both utilization rates and unmet need. Gaps in both public and private administrative data also need to be addressed, particularly at the community level.
Without making income-based equity a clear objective, there is a strong risk that efforts to improve access across the population will not reduce inequities (and may even widen the gap). A dual focus is needed, to both lift the average levels of access across the population and reduce disparities between income groups. Efforts to reduce disparities should focus on increasing the utilization of psychological services among lower-income Canadians, as well as ensuring that lower-income Canadians with mental health problems are no more likely to have an unmet need for care than lower-income Canadians with physical health problems.
Acknowledgements
The author thanks Jennifer M. Stewart and Allan M. Maslove for their advice and comments on earlier versions of this paper.
Funding information
This work was supported by Statistics Canada’s Carleton Ottawa Outaouais Local Research Data Centre.
Compliance with ethical standards
Conflict of interest
The author declares no conflict of interest.
Footnotes
Publisher’s note
Springer Nature remains neutral with regard to jurisdictional claims in published maps and institutional affiliations.
References
- Anderson RM. Revisiting the behavioral model and access to medical care: Does it matter? Journal of Health and Social Behavior. 1995;36:1–10. doi: 10.2307/2137284. [DOI] [PubMed] [Google Scholar]
- Bartram, M. (2017). Government structure and equity in access to psychotherapy: a study of Canada, with comparisons to Australia and the United Kingdom (Doctoral dissertation). https://catalogue.library.carleton.ca/record=b4463850.
- Bartram M, Lurie S. Closing the mental health gap: The long and winding road? Canadian Journal of Community Mental Health. 2017;36(2):5–18. doi: 10.7870/cjcmh-2017-021. [DOI] [Google Scholar]
- Canadian Life and Health Insurance Association. (2018). Canadian life and health insurance facts. https://www.clhia.ca/web/clhia_lp4w_lnd_webstation.nsf/resources/Factbook_2/$file/2018+FB+EN.pdf. Accessed 6 January 2019.
- Enticott JC, Lin E, Shawyer F, Russell G, Inder B, Patten S, Meadows G. Prevalence of psychological distress: How do Australia and Canada compare? The Australian and New Zealand Journal of Psychiatry. 2017;52(3):227–238. doi: 10.1177/0004867417708612. [DOI] [PubMed] [Google Scholar]
- Goryakin Y, Suhrcke M, Roberts B, McKee M. Mental health inequalities in 9 former Soviet Union countries: Evidence from the previous decade. Social Science & Medicine. 2015;124:142–151. doi: 10.1016/j.socscimed.2014.11.021. [DOI] [PubMed] [Google Scholar]
- Grignon M, Hurley J, Wang L, Allin S. Inequity in a market-based health system: Evidence from Canada’s dental sector. Health Policy. 2010;98(1):81–90. doi: 10.1016/j.healthpol.2010.05.018. [DOI] [PubMed] [Google Scholar]
- Hewlett E, & Moran V (2014). Making mental health count: The social and economic costs of neglecting mental health care. OECD Health Policy Studies, OECD Publishing. doi:10.1787/9789264208445-en. Accessed 6 January 2019.
- Hosseinpoor AR, Itani L, Petersen PE. Socio-economic inequality in oral healthcare coverage: Results from the world health survey. Journal of Dental Research. 2012;91(3):275–281. doi: 10.1177/0022034511432341. [DOI] [PubMed] [Google Scholar]
- Hua X, Erreygers G, Chalmers J, Laba T-L, Clarke P. Using administrative data to look at changes in the level and distribution of out-of-pocket medical expenditure: An example using Medicare data from Australia. Health Policy. 2017;121(4):426–433. doi: 10.1016/j.healthpol.2017.02.003. [DOI] [PubMed] [Google Scholar]
- Hunsley J, Lee CM, Aubry T. Who uses psychological services in Canada? Canadian Psychology/Psychologie Canadienne. 1999;40(3):232–240. doi: 10.1037/h0086839. [DOI] [Google Scholar]
- Hunsley J, Ronson A, Cohen KR. Professional psychology in Canada: A survey of demographic and practice characteristics. Professional Psychology: Research and Practice. 2013;44(2):118–126. doi: 10.1037/a0029672. [DOI] [Google Scholar]
- Jacobs P, Dewa C, Lesage A, Vasiliadis H-M, Escober C, Mulvale G, … Institute of Health Economics. (2010). Edmonton, Alta.: Institute of Health Economics. https://www.ihe.ca/publications/the-cost-of-mental-health-and-substance-abuse-services-in-canada. Accessed 6 January 2019.
- Jiménez-Rubio D, Smith PC, Van Doorslaer E. Equity in health and health care in a decentralised context: Evidence from Canada. Health Econ. 2008;17(3):377–392. doi: 10.1002/hec.1272. [DOI] [PubMed] [Google Scholar]
- Jokela M, Batty GD, Vahtera J, Elovainio M, Kivimaki M. Socioeconomic inequalities in common mental disorders and psychotherapy treatment in the UK between 1991 and 2009. The British Journal of Psychiatry. 2013;202(2):115–120. doi: 10.1192/bjp.bp.111.098863. [DOI] [PubMed] [Google Scholar]
- Kurdyak P, Stukel TA, Goldbloom D, Kopp A, Zagorski BM, Mulsant BH. Universal coverage without universal access: A study of psychiatrist supply and practice patterns in Ontario. Open Medicine: A Peer-Reviewed, Independent, Open-Access Journal. 2014;8(3):e87–e99. [PMC free article] [PubMed] [Google Scholar]
- Mangalore R, Knapp M, Jenkins R. Income-related inequality in mental health in Britain: The concentration index approach. Psychol Medicine. 2007;37(7):1037. doi: 10.1017/S003329170600969X. [DOI] [PubMed] [Google Scholar]
- Meadows GN, Enticott JC, Inder B, Russell GM, Gurr R. Better access to mental health care and the failure of the Medicare principle of universality. The Medical Journal of Australia. 2015;202(4):190–194. doi: 10.5694/mja14.00330. [DOI] [PubMed] [Google Scholar]
- Meadows GN, Tylee AT. Socioeconomic disadvantage and psychotherapy. The British Journal of Psychiatry. 2013;202(2):86–88. doi: 10.1192/bjp.bp.111.104489. [DOI] [PubMed] [Google Scholar]
- O’Donnell O, World Bank, editor. Analyzing health equity using household survey data: A guide to techniques and their implementation. Washington, D.C: World Bank; 2008. [Google Scholar]
- Sunderland A, Findlay LC. Perceived need for mental health care in Canada: Results from the 2012 Canadian community health survey–mental health. Statistics Canada Health Reports. 2013;24(9):3–9. [PubMed] [Google Scholar]
- Tavares LP, Zantomio F. Inequity in healthcare use among older people after 2008: The case of southern European countries. Health Policy. 2017;121(10):1063–1071. doi: 10.1016/j.healthpol.2017.08.011. [DOI] [PubMed] [Google Scholar]
- Vasiliadis H-M, Lesage A, Adair C, Boyer R. Service use for mental health reasons: Cross-provincial differences in rates, determinants, and equity of access. Canadian Journal of Psychiatry. 2005;50(10):614–619. doi: 10.1177/070674370505001007. [DOI] [PubMed] [Google Scholar]
- Vasiliadis H-M, Tempier R, Lesage A, Kates N. General practice and mental health care: Determinants of outpatient service use. Canadian Journal of Psychiatry. 2009;54(7):468–476. doi: 10.1177/070674370905400708. [DOI] [PubMed] [Google Scholar]
- Wang J, Jacobs P, Ohinmaa A, Dezetter A, Lesage A. Public expenditures for mental health services in Canadian provinces. Canadian Journal of Psychiatry. 2017;63(4):250–256. doi: 10.1177/0706743717741059. [DOI] [PMC free article] [PubMed] [Google Scholar]
- Zhang X, Wu Q, Shao Y, Fu W, Liu G, Coyte PC. Socioeconomic inequities in health care utilization in China. Asia-Pacific Journal of Public Health. 2015;27(4):429–438. doi: 10.1177/1010539514565446. [DOI] [PubMed] [Google Scholar]