

Abstract
Objective
Canadian colorectal cancer screening rates differ across income strata. In the United States, disparities across income strata worsen in rural areas. In Canada, differences in screening across income strata have not been explored by levels of urbanization. This project aimed to estimate up-to-date colorectal cancer (UTD-CRC) screening across income strata by levels of urbanization.
Methods
Data from the Canadian Community Health Survey (2013/2014) were used to estimate the prevalence of UTD-CRC screening by income quintiles for Canadians aged 50–74 years. UTD-CRC screening was defined as fecal occult blood testing within 2 years or colonoscopy/sigmoidoscopy within 10 years before the survey. Levels of urbanization were defined per Statistics Canada Metropolitan Influenced Zone classifications. Weighted proportions of UTD-CRC screening were calculated and logistic regression was used to assess the effect of income by levels of urbanization.
Results
Self-reported UTD-CRC screening prevalence among Canadians was 52.0%. UTD-CRC screening rates by income ranged from 47.8% (Q1-low) to 54.0% (Q5-high). Across all levels of urbanization, higher income was associated with increased odds of UTD-CRC screening compared to the lowest income quintile (Urban-ORQ5 = 1.49, 95% CI 1.17–1.89; Rural-ORQ5 = 1.42, 95% CI 1.02–1.99; Remote-ORQ5 = 1.54, 95% CI 1.02–2.31). Higher education (ORpost-secondary = 1.30, 95% CI 1.14–1.49), increasing age (OR70–74 = 2.88, 95% CI 2.39–3.47), and not identifying as an immigrant (OR = 1.45, 95% CI 1.19–1.75) were associated with an increased odds of UTD-CRC screening.
Discussion
Half of Canadians report UTD-CRC screening but across levels of urbanization, higher income was associated with higher screening rates. Efforts are needed to understand and address inequities, particularly among low-income populations.
Keywords: Colorectal cancer, Cancer screening, Cancer prevention, Levels of urbanization, Income, Health inequity
Résumé
Objectif
Les taux de dépistage canadiens du cancer colorectal diffèrent selon les tranches de revenu. Aux États-Unis, les disparités selon les tranches de revenu sont accentuées dans les régions rurales. Au Canada, les différences dans les taux de dépistage selon les tranches de revenu n’ont pas été explorées par niveaux d’urbanisation. Notre projet visait à estimer le dépistage récent du cancer colorectal (DR-CCR) selon les tranches de revenu et les niveaux d’urbanisation.
Méthode
Nous avons utilisé les données de l’Enquête sur la santé dans les collectivités canadiennes (2013–2014) pour estimer la prévalence du DR-CCR par quintile de revenu pour les Canadiennes et les Canadiens de 50 à 74 ans. Le DR-CCR a été défini comme étant la recherche de sang occulte dans les selles au cours des 2 années antérieures ou une coloscopie/sigmoïdoscopie au cours des 10 années antérieures à l’enquête. Les niveaux d’urbanisation ont été définis en fonction des « zones d’influence des régions métropolitaines » de Statistique Canada. Nous avons calculé les proportions pondérées de DR-CCR et évalué l’effet du revenu selon le niveau d’urbanisation au moyen d’analyses de régression logistique.
Résultats
La prévalence autodéclarée du DR-CCR dans la population canadienne était de 52%. Le DR-CCR selon le revenu allait de 47,8% (Q1-faible) à 54% (Q5-élevé). Pour l’ensemble des niveaux d’urbanisation, le revenu élevé était associé à une probabilité accrue de DR-CCR comparativement au quintile de revenu le plus faible (RCQ5-Zone urbaine = 1,49, IC de 95% 1,17-1,89; RCQ5-Zone rurale = 1,42, IC de 95% 1,02-1,99; RCQ5-Région éloignée = 1,54, IC de 95% 1,02-2,31). Les études supérieures (RCpostsecondaire = 1,30, IC de 95% 1,14-1,49), l’âge avancé (RC70–74 ans = 2,88, IC de 95% 2,39-3,47) et le fait de ne pas être immigrant (RC = 1,45, IC de 95% 1,19-1,75) étaient associés à une probabilité accrue de DR-CCR.
Discussion
La moitié des Canadiens et des Canadiennes déclarent avoir subi un dépistage récent du cancer colorectal, mais pour l’ensemble des niveaux d’urbanisation, le revenu élevé est associé à des taux de dépistage supérieurs. Il faudrait déployer des efforts pour comprendre et aborder les inégalités, en particulier dans les populations à faible revenu.
Mots-clés: Cancer colorectal, Dépistage du cancer, Prévention du cancer, Niveaux d’urbanisation, Revenu, Inégalités de santé
Introduction
Colorectal cancer (CRC) is the second and third leading cause of cancer death among Canadian males and females, respectively (Canadian Cancer Society’s Advisory Committee on Cancer Statistics 2015). In an effort to reduce the cancer burden, the Canadian Task Force on Preventive Health Care released their recommendations for CRC screening in 2001 (Canadian Task Force on Preventive Health Care 2001). Population-based CRC screening aims to reduce CRC mortality through early detection and removal of pre-cancerous polyps or early-stage cancers (Canadian Cancer Society’s Advisory Committee on Cancer Statistics 2015; Canadian Task Force on Preventive Health Care 2016). Most Canadian jurisdictions have implemented a CRC screening program that provides publicly funded access to those recommended for CRC screening (Singh et al. 2015). Despite this, up-to-date colorectal cancer (UTD-CRC) screening is not evenly distributed across different levels of income (Canadian Partnership Against Cancer 2014; Honein-AbouHaidar et al. 2013; Kerner et al. 2015; Singh et al. 2015) and the rural-urban continuum (Canadian Partnership Against Cancer 2014; Honein-AbouHaidar et al. 2013; Kerner et al. 2015).
In 2010, Honein-AbouHaidar et al. found that Ontario residents living in low-income neighbourhoods were less likely to report UTD-CRC screening compared to those living in high-income neighbourhoods (Honein-AbouHaidar et al. 2013). Inequities among low-income groups may be related to health literacy, perceived benefits and barriers, and awareness of screening programs (Canadian Partnership Against Cancer 2014; von Wagner et al. 2009; Wardle et al. 2004; Whitaker et al. 2011). Additionally, Canadians living in rural regions have been found to be less likely to report UTD-CRC compared to urban counterparts (Canadian Partnership Against Cancer 2014; Honein-AbouHaidar et al. 2013; Kerner et al. 2015). Ontario residents living in rural areas were less likely to report UTD-CRC screening compared to their urban counterparts (Honein-AbouHaidar et al. 2013). Rural-urban disparities have been attributed to transport barriers to accessing CRC screening clinics, and a limited number of family physicians and specialists in rural communities (Canadian Partnership Against Cancer 2014; Cotterill et al. 2005; Kerner et al. 2015). Low-income and rural effects for screening uptake have also been observed globally in the United Kingdom, the US, and France (Klabunde et al. 2011; Pornet et al. 2014; von Wagner et al. 2011). The relationship between UTD-CRC and social factors, such as income and rurality, suggest that social determinants of health are closely linked to screening practices, even in the context of universal access, with population health impacts in vulnerable groups (Canadian Partnership Against Cancer 2014; Kerner et al. 2015; Klabunde et al. 2011; Pornet et al. 2014; von Wagner et al. 2011).
The design and implementation of CRC screening programs should be underpinned by knowledge of regional screening patterns and disparities. Population-based screening can address the CRC mortality, in which low-income and rural populations show higher mortality rates relative to high-income and urban counterparts (Canadian Partnership Against Cancer 2014; Torabi et al. 2014). Given the disparities in Canadian CRC screening (Canadian Partnership Against Cancer 2014; Honein-AbouHaidar et al. 2013; Kerner et al. 2015; Singh et al. 2015), despite universal access, and the evidence-deficit concerning screening practices across income strata by levels of urbanization (Singh et al. 2011), there is a need to examine UTD-CRC screening rates across income strata by levels of urbanization in Canada. Evaluating Canadian CRC screening programs will help identify vulnerable populations and inform screening program priorities. In this study, we aim to quantify the effect of income on UTD-CRC screening and highlight important differences across levels of urbanization.
Methods
Self-reported data were obtained from the 2013/2014 Canadian Community Health Survey (CCHS). The CCHS is a national cross-sectional survey that collects health information and is conducted every two years by Statistics Canada (Statistics Canada 2015a). The survey was gathered using multistage cluster sampling. Data are collected on Canadians aged 12 years and older in all provinces and territories of Canada. Data are not collected on members of the Canadian Forces and those residing on First Nations Reserves, in institutions, and in some remote regions. Exclusions represent less than 3% of the Canadian population (Statistics Canada 2015a). In-person and telephone interviews were administered to 128,310 participants, representing an overall person-level response rate of 87.3% (Statistics Canada 2015a). A description of sampling and interviewing methods is available from Statistics Canada (Statistics Canada 2015a).
For this study, the sample included respondents aged 50–74 years. Questions regarding CRC screening were an optional component in the CCHS survey administered to respondents in six provinces. These six included Alberta, New Brunswick, Newfoundland and Labrador, Quebec, Prince Edward Island, and Manitoba (n = 24,350). Only respondents with valid responses to the main study variables for household income deciles and CRC screening, as well as for confounders of age, sex, identifying as an immigrant, and the respondent’s highest level of education, were included. Respondents with invalid responses (i.e., Do not Know, Refusal, Not Stated, and Not Applicable) for CRC screening (n = 381), household income deciles (n = 377), highest level of education (n = 394), and identified as an immigrant (n = 675) were excluded (7.5% of CRC screening respondents aged 50–74). There were 22,523 respondents (17.6% of the original sample) who met the inclusion criteria (Fig. 1).
Fig. 1.
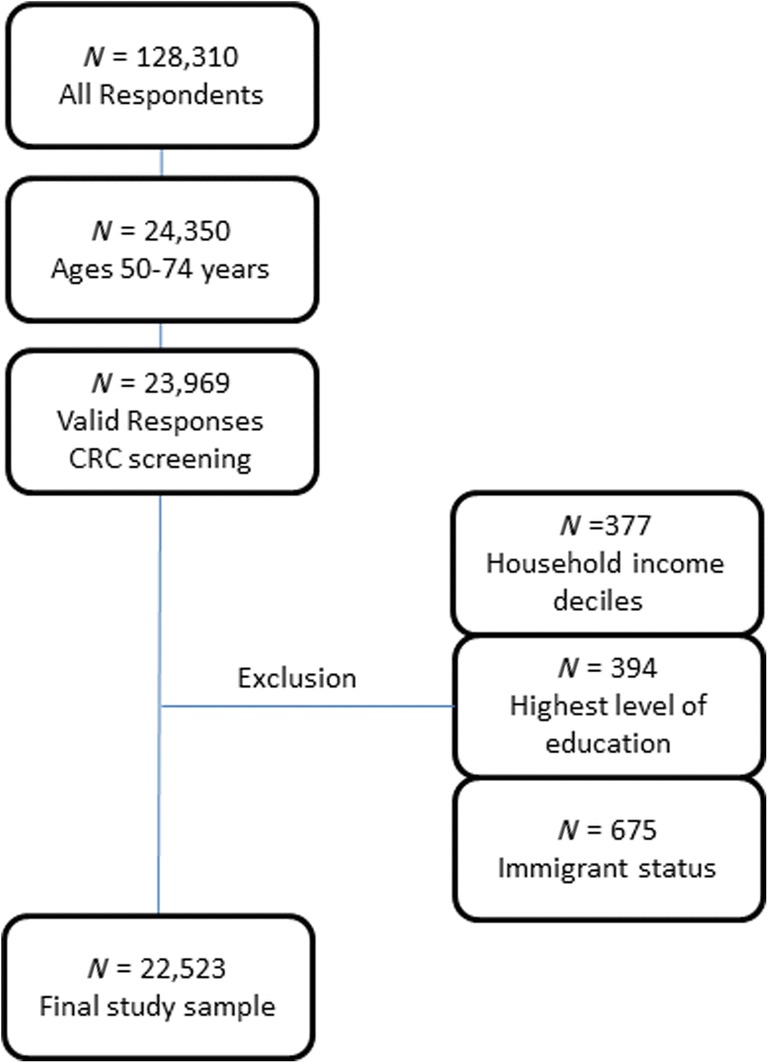
Flow diagram of baseline population, exclusion criteria, and the final study sample
Definition of the outcome variable UTD-CRC screening
UTD-CRC screening was a dichotomous variable (yes or no) defined according to the Canadian CRC screening guidelines (Canadian Task Force on Preventive Health Care 2016). That is, respondents between the ages of 50 and 74 years who had exposure to fecal occult blood test (FOBT), including guaiac FOBT (gFOBT) or immunochemical FOBT (iFOBT or FIT [fecal immunochemical test]) within the past 2 years and/or flexible sigmoidoscopy/colonoscopy within the past 10 years were classified as up-to-date (Canadian Task Force on Preventive Health Care 2016). To determine UTD-CRC screening status, respondents were asked four questions on the presence and timing of screening tests: “Have you ever had an FOBT?”, “When was the last time you had an FOBT?”, “Have you ever had a colonoscopy/sigmoidoscopy?”, and “When was the last time you had a colonoscopy/sigmoidoscopy?” Respondents were asked whether tests were conducted as part of “routine screening.” However, previous studies have shown that individuals do not reliably distinguish between routine and non-routine screening (i.e., a targeted screen because of a suspected problem) (Schenck et al. 2007; Singh et al. 2015). Therefore, exposure to any of these tests was used to indicate UTD-CRC screening.
Definition of explanatory variables income and levels of urbanization, as well as potential confounders
Household income deciles at the health region level were aggregated to quintiles for analysis. Levels of urbanization were determined by the Metropolitan Influenced Zone (MIZ) classification developed by Statistics Canada (Statistics Canada 2015b). The MIZ classification is based on population density and considers the commuting flow between rural and small towns and larger centres (Statistics Canada 2015b). MIZs are used as a proxy for a population’s access to health, educational, and financial services (Canadian Partnership Against Cancer 2014; du Plessis et al. 2001; Statistics Canada 2015b). Seven MIZ classifications were grouped into three categories for analysis, similar to categories published in the literature (Canadian Partnership Against Cancer 2014; Lagacé et al. 2007): urban (highest level of urbanization), rural, and remote (lowest level of urbanization). Urban was defined as census metropolitan areas (CMAs) and census agglomerations (CAs). MIZs are assigned on the basis of the share of the workforce that commutes to any CMA or CA (Statistics Canada 2015b). Rural was defined as Strong and Moderate MIZ (5% to < 50% MIZ) (Statistics Canada 2015b). Remote was defined as Weak and No MIZ (0% to < 5%) (Statistics Canada 2015b). The effect of potential confounders, including age (5-year groupings), sex (male, female), identified as an immigrant (yes, no), education (< secondary, secondary, post-secondary), and province of residence (Alberta, Manitoba, New Brunswick, Newfoundland and Labrador, Prince Edward Island, and Quebec), was assessed.
Six of 13 Canadian jurisdictions were represented in the CCHS for CRC questions and each jurisdiction has unique geographic characteristics as it relates to health. Alberta and Manitoba are in Western Canada and English is considered the mother tongue for 74.3% and 71.4% of individuals, respectively, followed by non-official languages (21.6% and 22.9%) and French (1.8% and 3.2%) (Statistics Canada 2016). Quebec is in Central Canada and most individuals consider their mother tongue to be French (77.1%), followed by non-official languages (13.2%) and English (7.5%) (Statistics Canada 2016). In New Brunswick, which is in Eastern Canada, most individuals consider their mother tongue English (64.2%), followed by French (31.4%) and non-official languages (3.1%). In other Eastern Canadian provinces, Newfoundland and Labrador, and Prince Edward Island, most individuals consider their mother tongue English (96.9% and 90.8%), followed by non-official languages (2.3% and 5.1%) and French (0.5% and 3.4%) (Statistics Canada 2016).
Status on colorectal cancer screening programs in Canada
Organized CRC screening programs are available in Canada to individuals who are asymptomatic, at average risk for CRC and between the ages of 50 and 74 years of age (Alberta, Saskatchewan, and Manitoba include 75 years of age). Screening is offered at 1- to 2-year intervals with an FOBT test (i.e., either gFOBT or FIT) (Canadian Partnership Against Cancer 2017). There are 11 screening programs in Canada that pertain to each of the ten provinces and the Yukon Territory. In the remaining territories (Northwest Territories and Nunavut), screening services may be provided opportunistically by a primary care provider (Canadian Partnership Against Cancer 2017). Programs were implemented at different times. The earliest was Alberta in 2007 and the most recent was the Yukon Territory in December 2016. Most are considered jurisdiction-wide programs; however, New Brunswick and Quebec are in an implementation stage (i.e., not province-wide coverage) (Canadian Partnership Against Cancer 2017).
Programs generally follow the same protocol with a few exceptions. Most programs use FIT testing; however, a few programs report guaiac testing (gFOBT) (Canadian Partnership Against Cancer 2017). Recruitment strategies and methods vary across the country. These may include, but are not limited to, a physician referral, distribution of FOBT tests to eligible individuals with a mailed invitation letter, and/or self-referral by directly contacting screening programs (Canadian Partnership Against Cancer 2017). Similarly, reminder strategies differ by jurisdiction. Many provincial/territorial CRC screening programs send a recall letter two years after a client receives a normal result (Canadian Partnership Against Cancer 2017). Last, different brands are used for gFOBT or FIT tests by jurisdiction (Canadian Partnership Against Cancer 2017).
Statistical analysis
All analyses were conducted using SAS software, Version 9.4 (SAS Institute Inc., Cary, NC, USA). Analyses were weighted using survey sampling weights provided by Statistics Canada to account for the non-random sampling scheme and to provide more precise estimates of variance around point estimates. The CCHS is conducted under the Statistics Act that requires data to be kept private and confidential. Ethics approval was covered by the publicly available data clause (item 7.10.3) governing the use of public release data set under the University of British Columbia’s Policy #89: Research Involving Human Subjects (University of British Columbia Board of Governors 2012).
Descriptive statistics were conducted to examine study sample characteristics as well as the prevalence of UTD-CRC screening and the distribution of income. Univariate chi-square goodness-of-fit tests were conducted to test for equal proportions among levels of study sample characteristics. Pearson chi-square tests were used to test associations between potential confounders and the explanatory (i.e., income) and outcome variables (UTD-CRC screening) (SAS 2017). Multivariate logistic regression was utilized to investigate the relationship between income and UTD-CRC screening status, adjusted for the effects of age, sex, education, identifying as an immigrant, and province of residence. The interaction effect of rural status on the relationship of income and UTD-CRC screening was evaluated using stratified analysis.
Results
There were 22,523 respondents in the final study sample (Fig. 1). Characteristics of the final study sample are shown in Table 1 and separated by level of urbanization. Respondents were nearly equally distributed by sex (48.7% males), and the majority had a post-secondary education (61.7%) and resided in the province of Quebec (56.4%). Nearly a quarter of respondents were among the highest income category. Sample characteristics were similar across levels of urbanization. Most respondents (59.2%) were considered urban (N = 13,329). Notably, levels of urbanization differed in terms of those who identified as an immigrant (16.6% urban versus 3.6% rural and 4.0% remote) and the province of residence. Univariate chi-square goodness-of-fit tests for equal proportions were statistically significant for all variables except for sex.
Table 1.
Study sample characteristics by levels of urbanization, Canadian Community Health Survey 2013/2014 Cycle (N = 22,523)
| Variable | Urban | Rural | Remote | Total | Univariate chi-square test |
|---|---|---|---|---|---|
| Study sample (N) | 13,329 | 5190 | 4004 | 22,523 | < 0.01 |
| Income (%) | |||||
| Quintile 1 (Q1–low) | 17.9 | 17.3 | 19.7 | 17.9 | < 0.01 |
| Quintile 2 | 18.9 | 19.9 | 20.9 | 19.2 | |
| Quintile 3 | 19.6 | 19.4 | 20.5 | 19.7 | |
| Quintile 4 | 20.5 | 19.0 | 18.5 | 20.1 | |
| Quintile 5 (Q5–high) | 23.1 | 24.4 | 20.5 | 23.1 | |
| Age (%) | |||||
| 50–54 | 25.8 | 25.2 | 24.0 | 25.5 | < 0.01 |
| 55–59 | 25.3 | 22.6 | 25.1 | 24.8 | |
| 60–64 | 20.3 | 21.4 | 21.8 | 20.6 | |
| 65–69 | 16.4 | 18.9 | 17.8 | 17.0 | |
| 70–74 | 12.1 | 12.0 | 11.3 | 12.1 | |
| Sex (%) | |||||
| Males | 48.4 | 49.4 | 50.1 | 48.7 | 0.05 |
| Females | 51.6 | 50.6 | 49.9 | 51.3 | |
| Education (%) | |||||
| < Secondary school | 14.0 | 28.3 | 28.8 | 17.7 | < 0.01 |
| Secondary school graduation | 20.4 | 21.4 | 20.2 | 20.6 | |
| Post-secondary | 65.6 | 50.3 | 51.0 | 61.7 | |
| Province (%) | |||||
| Newfoundland and Labrador | 2.4 | 7.1 | 14.4 | 4.2 | < 0.01 |
| Prince Edward Island | 1.0 | 2.0 | 1.1 | 1.1 | |
| New Brunswick | 4.6 | 9.9 | 9.5 | 5.9 | |
| Quebec | 58.3 | 59.4 | 31.0 | 56.4 | |
| Manitoba | 8.0 | 6.7 | 13.9 | 8.2 | |
| Alberta | 25.8 | 14.9 | 30.2 | 24.2 | |
| Identifies as an immigrant (%) | |||||
| Yes | 16.6 | 3.6 | 4.0 | 13.3 | < 0.01 |
| No | 83.4 | 96.4 | 96.0 | 86.7 | |
Prevalence of UTD-CRC screening by levels of urbanization
The prevalence of UTD-CRC screening in the final study sample was 52.0%. UTD-CRC screening prevalence increased with income (Table 2). Higher UTD-CRC screening prevalence was observed in the highest income quintile (54.0%), those with a post-secondary education (53.7%) and those who did not identify as an immigrant (52.9%). Provincially, prevalence ranged from 47.0% (Newfoundland and Labrador) to 65.6% (Manitoba) (Table 2). UTD-CRC screening was the highest among remote respondents (54.9%) followed by urban (51.9%) and rural (50.9%) respondents; however, differences were not statistically significant (p = 0.17) (Table 2).
Table 2.
Prevalence of up-to-date CRC screening by levels of urbanization, Canadian Community Health Survey 2013/2014 Cycle (N = 22,523)
| Yes to UTD-CRC screening (%) | Bivariate chi-square test | |||||
|---|---|---|---|---|---|---|
| Variable | Urban | Rural | Remote | Total | Income | UTD-CRC screening |
| Study sample | 51.9 | 50.9 | 54.9 | 52.0 | 0.22 | 0.17 |
| Income | ||||||
| Quintile 1 (Q1–low) | 47.7 | 46.3 | 51.7 | 47.8 | – | < 0.05 |
| Quintile 2 | 51.4 | 49.6 | 57.7 | 51.6 | ||
| Quintile 3 | 51.8 | 54.8 | 52.0 | 52.3 | ||
| Quintile 4 | 53.4 | 52.6 | 56.2 | 53.4 | ||
| Quintile 5 (Q5–high) | 54.6 | 50.7 | 57.0 | 54.0 | ||
| Difference Q5-Q1 | 6.9 | 4.4 | 5.3 | 6.2 | ||
| Age | ||||||
| 50–54 | 38.9 | 39.3 | 43.1 | 39.3 | < 0.01 | < 0.01 |
| 55–59 | 50.9 | 52.4 | 54.3 | 51.4 | ||
| 60–64 | 55.5 | 53.9 | 57.0 | 55.3 | ||
| 65–69 | 62.6 | 57.2 | 63.2 | 61.6 | ||
| 70–74 | 61.2 | 57.0 | 64.4 | 60.7 | ||
| Sex | ||||||
| Males | 51.8 | 50.2 | 53.6 | 51.6 | < 0.01 | 0.59 |
| Females | 52.1 | 51.6 | 56.3 | 52.3 | ||
| Education | ||||||
| < Secondary school | 47.5 | 47.6 | 53.8 | 48.3 | < 0.01 | 0.01 |
| Secondary school graduation | 50.2 | 48.8 | 51.7 | 50.0 | ||
| Post-secondary | 53.4 | 53.7 | 56.9 | 53.7 | ||
| Province | ||||||
| Newfoundland and Labrador | 42.3 | 48.5 | 52.7 | 47.0 | < 0.05 | < 0.01 |
| Prince Edward Island | 57.3 | 59.4 | 48.3 | 57.3 | ||
| New Brunswick | 52.1 | 52.5 | 57.7 | 52.9 | ||
| Quebec | 47.7 | 47.3 | 54.1 | 47.9 | ||
| Manitoba | 67.0 | 64.1 | 59.7 | 65.6 | ||
| Alberta | 57.5 | 58.4 | 54.1 | 57.2 | ||
| Identifies as an immigrant | ||||||
| Yes | 45.4 | 56.1 | 47.8 | 45.9 | < 0.01 | 0.01 |
| No | 53.2 | 50.7 | 55.2 | 52.9 | ||
*Statistically significant p < 0.05
Across levels of urbanization, the lowest UTD-CRC screening prevalence was found in the lowest income quintile (Q1). UTD-CRC screening increased with income among urban respondents; the highest UTD-CRC screening prevalence was among the highest income quintile (Q5 54.6%). Among rural and remote respondents, the trend with income was less clear; the highest UTD-CRC screening prevalence was found in quintile 3 (54.8%) and quintile 2 (57.7%), respectively (Table 2). In the final study sample, income was associated with all variables except for levels of urbanization. UTD-CRC screening was associated with all variables except for sex and level of urbanization (Table 2).
Odds of UTD-CRC screening by level of urbanization
The associated odds of UTD-CRC screening with income adjusted for age, sex, education, province of residence, and identifying as an immigrant, were stratified by levels of urbanization (Table 3). Higher income was associated with increased odds of UTD-CRC screening. Relative to the lowest income quintile (Q1), the largest odds of UTD-CRC screening was observed among the highest income quintile (ORQ5 = 1.48, 95% CI 1.22–1.78). The relationship between income and UTD-CRC screening was similar across levels of urbanization with no apparent interaction. Higher education, increasing age, and not identifying as an immigrant were associated with an increased odds of UTD-CRC screening. Significant interprovincial differences were observed.
Table 3.
Adjusted multivariable logistic regression analysis examining the relationship between income and up-to-date CRC screening stratified by level of urbanization, Canadian Community Health Survey 2013/2014 Cycle
| Variable | OR (95% CIs) | |||
|---|---|---|---|---|
| Urban | Rural | Remote | Total | |
| Income quintile | ||||
| Quintile 1 (Q1–low) | 1.00 (ref) | 1.00 (ref) | 1.00 (ref) | 1.00 (ref) |
| Quintile 2 | 1.13 (0.91–1.40) | 1.16 (0.87–1.56) | 1.25 (0.86–1.81) | 1.15 (0.97–1.36) |
| Quintile 3 | 1.24 (0.99–1.55) | 1.57 (1.16–2.12) | 1.04 (0.73–1.48) | 1.28 (1.07–1.52) |
| Quintile 4 | 1.35 (1.08–1.68) | 1.48 (1.05–2.10) | 1.30 (0.90–1.89) | 1.37 (1.15–1.63) |
| Quintile 5 (Q5–high) | 1.49 (1.17–1.89) | 1.42 (1.02–1.99) | 1.54 (1.02–2.31) | 1.48 (1.22–1.78) |
| Age | ||||
| 50–54 | 1.00 (ref) | 1.00 (ref) | 1.00 (ref) | 1.00 (ref) |
| 55–59 | 1.62 (1.31–2.00) | 1.72 (1.26–2.36) | 1.62 (1.12–2.34) | 1.64 (1.38–1.94) |
| 60–64 | 2.13 (1.71–2.65) | 1.90 (1.38–2.62) | 1.91 (1.34–2.72) | 2.07 (1.74–2.46) |
| 65–69 | 3.13 (2.53–3.88) | 2.38 (1.69–3.36) | 2.56 (1.77–3.70) | 2.91 (2.44–3.46) |
| 70–74 | 3.06 (2.43–3.85) | 2.39 (1.64–3.49) | 2.72 (1.81–4.07) | 2.88 (2.39–3.47) |
| Sex | ||||
| Males | 1.00 (ref) | 1.00 (ref) | 1.00 (ref) | 1.00 (ref) |
| Females | 1.06 (0.93–1.22) | 1.14 (0.93–1.39) | 1.16 (0.93–1.46) | 1.09 (0.98–1.21) |
| Education | ||||
| < Secondary school | 1.00 (ref) | 1.00 (ref) | 1.00 (ref) | 1.00 (ref) |
| Secondary school graduation | 1.19 (0.97–1.47) | 1.01 (0.75–1.36) | 0.93 (0.66–1.32) | 1.12 (0.95–1.31) |
| Post-secondary | 1.37 (1.15–1.62) | 1.22 (0.94–1.59) | 1.16 (0.87–1.56) | 1.30 (1.14–1.49) |
| Province | ||||
| Newfoundland and Labrador | 0.31 (0.22–0.43) | 0.52 (0.36–0.77) | 0.69 (0.49–0.98) | 0.42 (0.34–0.53) |
| Prince Edward Island | 0.62 (0.44–0.88) | 0.81 (0.51–1.30) | 0.58 (0.32–1.06) | 0.67 (0.52–0.88) |
| New Brunswick | 0.47 (0.36–0.63) | 0.63 (0.44–0.90) | 0.89 (0.59–1.34) | 0.55 (0.45–0.67) |
| Quebec | 0.42 (0.33–0.53) | 0.49 (0.36–0.67) | 0.74 (0.54–1.01) | 0.45 (0.38–0.54) |
| Manitoba | 1.00 (ref) | 1.00 (ref) | 1.00 (ref) | 1.00 (ref) |
| Alberta | 0.69 (0.53–0.89) | 0.77 (0.53–1.11) | 0.82 (0.57–1.16) | 0.73 (0.59–0.89) |
| Identifies as an immigrant | ||||
| Yes | 1.00 (ref) | 1.00 (ref) | 1.00 (ref) | 1.00 (ref) |
| No | 1.50 (1.22–1.86) | 0.95 (0.60–1.51) | 1.62 (0.98–2.69) | 1.45 (1.19–1.75) |
OR odds ratio, CI confidence interval, CRC colorectal cancer, ref reference group
Discussion
Summary of main findings
The current study utilized a comprehensive national survey to examine UTD-CRC screening rates across income strata by levels of urbanization in Canada and found that low-income and rural populations are less likely to report UTD-CRC screening than high-income and urban counterparts, respectively (Canadian Partnership Against Cancer 2014; Honein-AbouHaidar et al. 2013; Kerner et al. 2015; Singh et al. 2015). More than half of Canadians aged 50–74 years reported UTD-CRC screening but across levels of urbanization, higher income was associated with higher UTD-CRC screening rates. The lowest UTD-CRC screening rates were reported among the least affluent Canadians living in rural areas. Higher education, increasing age, and not identifying as an immigrant were associated with higher UTD-CRC screening.
Disparities in CRC screening by income and levels of urbanization
CRC screening differences across income strata and levels of urbanization have been documented in Canada (Canadian Partnership Against Cancer 2014; Honein-AbouHaidar et al. 2013; Kerner et al. 2015; Singh et al. 2015). In respect to income disparities, previous findings are consistent with the current study. In 2012, Singh et al. found that Canadians living in high-income households had 1.5 times the odds of UTD-CRC screening compared to those living in low-income households (Singh et al. 2015). In Ontario, the difference in UTD-CRC screening prevalence between residents in the highest and the lowest income quintiles was 17.3% in 2010 (Honein-AbouHaidar et al. 2013). Similar observations have been reported globally (Klabunde et al. 2011; Pornet et al. 2014; von Wagner et al. 2011).
CRC screening differences across income strata are not well understood (von Wagner et al. 2011; Whitaker et al. 2011). Whitaker et al. found that lower attendance among low socio-economic status (SES) individuals was associated with lower considerations of future consequences, higher perceived barriers, and lower perceived benefit (Whitaker et al. 2011). Health literacy was also associated with CRC screening among low-income populations (von Wagner et al. 2009). Among low-income individuals, those with lower health literacy were less likely to seek, understand, and be aware of CRC cancer screening (von Wagner et al. 2009).
In respect to rural-urban differences, previous studies suggest that rural Canadians have historically had lower UTD-CRC screening rates compared to urban Canadians but differences appear to have reduced over time (Honein-AbouHaidar et al. 2013; Kerner et al. 2015). Kerner et al. compared rates of FOBT testing for CRC screening among different levels of urbanization (i.e., urban, rural, rural-remote, and rural-very remote) in both 2008 and 2012 using data from the CCHS (Kerner et al. 2015). In 2008, statistical differences were observed between urban (22%) and rural-remote (18%), but not rural (19%) or rural-very remote (20%). In 2012, rates of UTD-CRC screening using FOBT increased across all levels of urbanization and no statistical differences were detected (Kerner et al. 2015). Similarly, Honein-AbouHaidar et al. reported that in Ontario, rural-urban differences in the rates of UTD-CRC screening decreased from 1.8% in 2005 to 0.3% in 2011 (Honein-AbouHaidar et al. 2013). Differences in UTD-CRC screening between levels of urbanization may also depend on the screening test modality (Canadian Partnership Against Cancer 2014; Honein-AbouHaidar et al. 2013). The Canadian Partnership Against Cancer reported that UTD-CRC screening rates when sigmoidoscopy/colonoscopy and FOBT tests were considered were marginally higher among urban (33.0%) compared to rural (30.6%), rural-remote (27.7%), and rural-very remote Canadians (29.2%) (Canadian Partnership Against Cancer 2014). When UTD-CRC screening was examined by test, Canadians living in lower levels of urbanization were less likely to report sigmoidoscopy/colonoscopy, but not FOBT (Canadian Partnership Against Cancer 2014).
The current study found higher UTD-CRC screening among remote respondents, followed by urban and rural respondents; however we did not find any statistical differences in UTD-CRC screening across levels of urbanization when both tests were considered. Given that FOBT use for CRC screening does not differ across levels of urbanization (Canadian Partnership Against Cancer 2014; Kerner et al. 2015), the current findings may be reflective of FOBT as the primary screening modality among organized CRC screening programs in Canada (Canadian Partnership Against Cancer 2015; Canadian Task Force on Preventive Health Care 2016). In practice, the majority of UTD-CRC screened Canadians self-report being screened with a fecal test alone (64.1%) versus endoscopy alone (21.5%) and both a fecal test and endoscopy (14.3%) (Canadian Partnership Against Cancer 2015). It is possible that test-specific differences in UTD-CRC screening were masked given that both FOBT and sigmoidoscopy/colonoscopy for CRC screening were examined in the current analysis. The Canadian Partnership Against Cancer also reports that geographic variability in CRC screening may be related to colorectal screening programs being implemented differently across Canada (Canadian Partnership Against Cancer 2015). For example, some programs have been implemented province-wide while others are region-specific (Canadian Partnership Against Cancer 2015). This is consistent with our findings of interprovincial differences in the rates of UTD-CRC screening (Canadian Partnership Against Cancer 2015). UTD-CRC screening among income strata by levels of urbanization in Canada are not available in peer-reviewed literature. A Pan-Canadian report released by the Canadian Partnership Against Cancer did, however, examine this relationship using 2008 CCHS data (Canadian Partnership Against Cancer 2014). They report increasing CRC screening rates with increasing income across all levels of urbanization (Canadian Partnership Against Cancer 2014), similar to the findings reported in the current study.
Differential uptake of CRC screening and the impact on CRC mortality
In Canada, low-income neighbourhoods have higher CRC mortality rates compared to high-income counterparts (Canadian Partnership Against Cancer 2014; Torabi et al. 2014). Torabi et al. compared colorectal cancer mortality rates in Manitoba from 1985 to 2009 by income quintiles and found that the rate among high-income individuals was 0.80 times (confidence intervals 0.72–0.88) the rate of low-income individuals, adjusted for confounders. Further, there was a widening gap of CRC mortality rates among socio-economic groups; the average annual percent change from 1985 to 2009 among low-income males (+ 0.95%) and females (+ 8.07%) increased. It had decreased among high-income males (− 1.83%) and females (− 1.86%) (Torabi et al. 2014). In a Pan-Canadian report, CPAC reported 2007 age-standardized mortality rates for colorectal cancer were marginally higher among the lowest income quintile (21.3 per 100,000 persons) compared to the highest income quintile (19.7 per 100,000 persons) (Canadian Partnership Against Cancer 2014).
Organized CRC screening programs aim to reduce CRC mortality; however, differential uptake of CRC screening among income strata may widen SES gradients in CRC mortality (Honein-AbouHaidar et al. 2013; Singh et al. 2015). Further, organized screening programs may contribute to differential uptake of CRC screening among income strata (Honein-AbouHaidar et al. 2013; Singh et al. 2015; Torabi et al. 2014; von Wagner et al. 2011). In 2012, Canadian jurisdictions with established screening programs were associated with greater disparities across income strata compared to provinces without (Singh et al. 2015). Similar concerns have been raised globally (Klabunde et al. 2011; Singh et al. 2011; von Wagner et al. 2011; Wardle et al. 2004). Disparities in CRC mortality are also related to the prevalence of modifiable risk factors, such as smoking, alcohol consumption and diet, and access to cancer care (Canadian Partnership Against Cancer 2014; Singh et al. 2011).
Limitations
This study has several limitations. Data are self-reported and subject to recall and social desirability bias. Studies investigating the validity of self-reported colorectal cancer screening data have produced mixed findings. Generally, self-reported data yields over-estimates of screening compared to administrative health records (Lofters et al. 2015; Major et al. 2015; Vernon et al. 2008; White et al. 2013). Lofters et al. compared responses to FOBT for CRC screening in the CCHS to provincial administrative health data in Ontario and found that FOBT was significantly over-reported. No clear pattern was found to suggest social disadvantage influenced over-reporting (Lofters et al. 2015). Similar findings have been reported in the US (Vernon et al. 2008; White et al. 2013). Therefore, it is likely that estimates of UTD-CRC screening presented in this study are over-estimated for all groups; however, trends across socio-demographic variables are reflective of screening disparities in Canada.
The current study cannot determine causality. This was a cross-sectional study and temporality cannot be established. Respondents’ current income and level of urbanization do not necessarily reflect the corresponding status at the time of screening. Also, the CCHS excludes members of the Canadian Forces and those residing on First Nations Reserves and in institutions (Statistics Canada 2015a). Findings cannot be generalized to these populations.
CCHS questions may not capture those who have above average risk, such as having a family history of CRC (Major et al. 2015). Moreover, those with medical conditions regularly exposed to CRC testing modalities were not excluded; therefore, rates in this study include routine and non-routine testing. Previous studies have shown that routine and non-routine screening cannot be reliably distinguished in self-reported data (Schenck et al. 2007; Singh et al. 2015). Also, this study did not differentiate between test modalities, which may mask important differences across income and levels of urbanization (Canadian Partnership Against Cancer 2014; Kerner et al. 2015). The analysis was limited by the definition of the rural-urban continuum. While the current definition of levels of urbanization considers access to urban centres through Statistics Canada’s MIZs classifications (i.e., four categories), other classifications exist. Our analysis was limited to 22,523 across six provinces in Canada. The sample size for rural and remote levels of urbanization were notably lower than the urban strata and resulted in larger confidence intervals around point estimates. Given that six provinces were included in the final study sample, generalizability across Canada may be limited. However, total prevalence of CRC screening in the current study and interprovincial differences were consistent with the literature (Singh et al. 2015).
Conclusions
Equitable access to health services is a Canadian priority. This study found that higher income was associated with higher UTD-CRC screening across all levels of urbanization in Canada. It is the first study to examine screening rates by levels of urbanization in Canada. The relationship between UTD-CRC and social factors, such as income and rurality, suggest that social determinants of health are closely linked to screening practices, even in the context of universal access, with population health impacts in vulnerable groups (Canadian Partnership Against Cancer 2014; Kerner et al. 2015; Klabunde et al. 2011; Pornet et al. 2014; von Wagner et al. 2011). Efforts are needed to understand and address inequities, particularly among low-income populations. Given the evidence-deficit, examining screening differences by other rural-urban definitions is warranted. Continued surveillance of CRC screening rates and disparities in Canada is needed to inform Canadian provincial/territorial programming.
Acknowledgements
The authors would like to thank Dr. Mieke Koehoorn and Jennifer Guthrie for their support in data analysis and earlier drafts of the manuscript.
Funding information
This research was supported by funds to the Canadian Research Data Centre Network (CRDCN) from the Social Sciences and Humanities Research Council (SSHRC), the Canadian Institutes of Health Research (CIHR), the Canadian Foundation for Innovation (CFI), and Statistics Canada.
Compliance with ethical standards
Ethics approval was covered by the publicly available data clause (item 7.10.3) governing the use of publicly released data set under the University of British Columbia’s Policy #89: Research Involving Human Subjects (University of British Columbia Board of Governors 2012).
Conflict of interest
The authors declare that they have no conflict of interest.
Disclaimer
Although the research and analysis are based on data from Statistics Canada, the opinions expressed do not represent the views of Statistics Canada.
References
- Canadian Cancer Society’s Advisory Committee on Cancer Statistics. (2015). Cancer Statistics 2015. Toronto, ON.
- Canadian Partnership Against Cancer. (2014). Examining disparities in cancer control system performance special focus report. Toronto, ON.
- Canadian Partnership Against Cancer. (2015). Cancer screening in Canada an overview of screening participation for breast, cervical and colorectal cancer acknowledgments. Toronto, ON.
- Canadian Partnership Against Cancer. (2017). Colorectal cancer screening in Canada: environmental scan [internet]. Toronto, ON. Available from: http://www.cancerview.ca/preventionandscreening/colorectalcancerscreeningpage/
- Canadian Task Force on Preventive Health Care Colorectal cancer screening. Recommendation statement from the Canadian task force on preventive health care. Canadian Family Physician [Internet] 2001;47(2):1811–1813. [PMC free article] [PubMed] [Google Scholar]
- Canadian Task Force on Preventive Health Care Recommendations on screening for colorectal cancer in primary care. Canadian Medical Association Journal. 2016;188(5):1–9. doi: 10.1503/cmaj.151125. [DOI] [PMC free article] [PubMed] [Google Scholar]
- Cotterill M, Gasparelli R, Kirby E. Colorectal cancer detection in a rural community: development of a colonoscopy screening program. Canadian Family Physician. 2005;51(9):1224–1228. [PMC free article] [PubMed] [Google Scholar]
- du Plessis V, Beshiri R, Bollman RD, Heather C. (2001). Definitions of rural. Rural and Small Town Canada Analysis Bulletin, 3(3). Statistics Canada Catalogue No. 21-006-XIE.
- Honein-AbouHaidar GN, Baxter NN, Moineddin R, Urbach DR, Rabeneck L, Bierman AS. Trends and inequities in colorectal cancer screening participation in Ontario, Canada, 2005–2011. Cancer Epidemiology [Internet] Elsevier Ltd. 2013;37(6):946–956. doi: 10.1016/j.canep.2013.04.007. [DOI] [PubMed] [Google Scholar]
- Kerner J, Liu J, Wang K, Fung S, Landry C, Lockwood G, et al. Canadian cancer screening disparities: a recent historical perspective. Current Oncology [Internet] 2015;22(2):156. doi: 10.3747/co.22.2539. [DOI] [PMC free article] [PubMed] [Google Scholar]
- Klabunde CN, Cronin KA, Breen N, Waldron WR, Ambs AH, Nadel MR. Trends in colorectal cancer test use among vulnerable populations in the United States. Cancer Epidemiology, Biomarkers & Prevention [Internet] 2011;20(8):1611–1621. doi: 10.1158/1055-9965.EPI-11-0220. [DOI] [PMC free article] [PubMed] [Google Scholar]
- Lagacé C, Desmeules M, Pong RW, Heng D. Non-communicable disease and injury-related mortality in rural and urban places of residence: a comparison between Canada and Australia. Canadian Journal of Public Health [Internet] 2007;98(Suppl 1):S62–S69. doi: 10.1007/BF03403728. [DOI] [PMC free article] [PubMed] [Google Scholar]
- Lofters A, Vahabi M, Glazier RH. The validity of self-reported cancer screening history and the role of social disadvantage in Ontario, Canada. BMC Public Health [Internet] 2015;15(1):28. doi: 10.1186/s12889-015-1441-y. [DOI] [PMC free article] [PubMed] [Google Scholar]
- Major D, Armstrong D, Bryant H, Cheung W, Decker K, Doyle G, et al. Recent trends in breast, cervical and colorectal cancer screening test utilization in Canada, using self-reported data from 2008 and 2012. Current Oncology [Internet] 2015;22(4):297. doi: 10.3747/co.22.2690. [DOI] [PMC free article] [PubMed] [Google Scholar]
- Pornet C, Denis B, Perrin P, Gendre I, Launoy G. Predictors of adherence to repeat fecal occult blood test in a population-based colorectal cancer screening program. British Journal of Cancer [Internet]. Nature Publishing Group. 2014;111(11):2152–2155. doi: 10.1038/bjc.2014.507. [DOI] [PMC free article] [PubMed] [Google Scholar]
- SAS. (2017). PROC FREQ: chi-square tests and statistics : SAS/STAT(R) 9.3 User’s Guide [Internet]. [cited 2017 Dec 28]. Available from: https://support.sas.com/documentation/cdl/en/statug/63962/HTML/default/viewer.htm#statug_freq_a0000000561.htm
- Schenck AP, Klabunde CN, Warren JL, Peacock S, Davis WW, Hawley ST, et al. Data sources for measuring colorectal endoscopy use among medicare enrollees. Cancer Epidemiology, Biomarkers & Prevention [Internet] 2007;16(10):2118–2127. doi: 10.1158/1055-9965.EPI-07-0123. [DOI] [PubMed] [Google Scholar]
- Singh GK, Williams SD, Siahpush M, Mulhollen A. Socioeconomic, rural-urban, and racial inequalities in US Cancer mortality: part I—all cancers and lung Cancer and part II—colorectal, prostate, breast, and cervical cancers. Journal of Cancer Epidemiology [Internet] 2011;2011:1–27. doi: 10.1155/2011/107497. [DOI] [PMC free article] [PubMed] [Google Scholar]
- Singh H, Bernstein CN, Samadder JN, Ahmed R. Screening rates for colorectal cancer in Canada: a cross-sectional study. Canadian Medical Association Journal Open [Internet] 2015;3(2):E149–E157. doi: 10.9778/cmajo.20140073. [DOI] [PMC free article] [PubMed] [Google Scholar]
- Statistics Canada. (2015a). Canadian Community Health (CCHS) Survey Annual Component (User Guide) - 2014 and 2013-2014 Microdata files.
- Statistics Canada. (2015b). Census metropolitan influenced zone (MIZ) [internet]. Available from: https://www12.statcan.gc.ca/census-recensement/2011/ref/dict/geo010-eng.cfm
- Statistics Canada. (2016). Language Highlight Tables. Census [Internet]. [cited 2018 Aug 27]. Available from: https://www12.statcan.gc.ca/census-recensement/2016/dp-pd/hlt-fst/lang/Table.cfm?Lang=E&T=11&Geo=00&SP=1&view=2&age=1
- Torabi M, Green C, Nugent Z, Mahmud S, Demers A, Griffith J, et al. Geographical variation and factors associated with colorectal cancer mortality in a universal health care system. Canadian Journal of Gastroenterology and Hepatology [Internet] 2014;28(4):191–197. doi: 10.1155/2014/707420. [DOI] [PMC free article] [PubMed] [Google Scholar]
- University of British Columbia Board of Governors. (2012). Research Involving Human Participants.
- Vernon SW, Tiro JA, Vojvodic RW, Coan S, Diamond PM, Greisinger A, et al. Reliability and validity of a questionnaire to measure colorectal cancer screening behaviors: does mode of survey administration matter? Cancer Epidemiology, Biomarkers & Prevention [Internet] 2008;17(4):758–767. doi: 10.1158/1055-9965.EPI-07-2855. [DOI] [PubMed] [Google Scholar]
- von Wagner C, Semmler C, Good A, Wardle J. Health literacy and self-efficacy for participating in colorectal cancer screening: the role of information processing. Patient Education and Counseling [Internet] 2009;75(3):352–357. doi: 10.1016/j.pec.2009.03.015. [DOI] [PubMed] [Google Scholar]
- von Wagner C, Baio G, Raine R, Snowball J, Morris S, Atkin W, et al. Inequalities in participation in an organized national colorectal cancer screening programme: results from the first 2.6 million invitations in England. International Journal of Epidemiology [Internet] 2011;40(3):712–718. doi: 10.1093/ije/dyr008. [DOI] [PubMed] [Google Scholar]
- Wardle J, McCaffery K, Nadel M, Atkin W. Socioeconomic differences in cancer screening participation: comparing cognitive and psychosocial explanations. Social Science & Medicine [Internet] 2004;59(2):249–261. doi: 10.1016/j.socscimed.2003.10.030. [DOI] [PubMed] [Google Scholar]
- Whitaker KL, Good A, Miles A, Robb K, Wardle J, von Wagner C. Socioeconomic inequalities in colorectal cancer screening uptake: does time perspective play a role? Health Psychology [Internet] 2011;30(6):702–709. doi: 10.1037/a0023941. [DOI] [PubMed] [Google Scholar]
- White A, Vernon SW, Eberth JM, Tiro JA, Coan SP, Abotchie PN, et al. Correlates of self-reported colorectal cancer screening accuracy in a multi-specialty medical group practice. Open Journal of Epidemiology [Internet] 2013;03(01):20–24. doi: 10.4236/ojepi.2013.31004. [DOI] [PMC free article] [PubMed] [Google Scholar]