Abstract
Background.
The urine C-X-C motif chemokine 10 (CXCL10) is a promising screening biomarker for renal allograft rejection. The aim of the study was to investigate important technical and biological aspects as well as potential confounders when measuring urine CXCL10.
Methods.
We analyzed 595 urine samples from 117 patients, who participated in a randomized controlled trial investigating the clinical utility of urine CXCL10 monitoring for posttransplant management. Urine CXCL10 was measured by an immunoassay using electrochemiluminescence.
Results.
Intraassay coefficient of variation was 2.5%, and interassay coefficient of variation was 10%. Urine CXCL10 remained stable (ie, <10% degradation) for 8 hours at 25°C or 37°C and for 3 days at 4°C. CXCL10 concentrations [pg/mL] strongly correlated with urine CXCL10/creatinine ratios [ng/mmol] (r2 = 0.98; P < 0.0001). Leucocyturia and active BK-polyomavirus infection are associated with higher CXCL10 concentrations, while allograft function, serum CRP, patient age, proteinuria, urine pH, hematuria, squamous epithelia cell count, and bacteriuria did not correlate with urine CXCL10 concentrations. In 145 paired samples obtained within 1–2 weeks, 80% showed a CXCL10/creatinine ratio change of < ±2 ng/mmol or ±50%, respectively.
Conclusions.
Urine CXCL10 measurement on the used platform is accurate and robust. Leucocyturia and active BK-polyomavirus infection are major confounders, which can be easily detected but represent important diagnostic “blind spots” when using urine CXCL10 to screen for allograft rejection. The intraindividual biological variability of urine CXCL10 within 1–2 weeks is mostly below ±50%, which is still much higher than the technical variability due to sample handling/processing (<20%).
While the frequency of clinical allograft rejection within the first year after renal transplantation dropped to around 10%, an additional 10–40% of recipients might experience subclinical rejection within the first year posttransplant, which can only be detected by surveillance biopsies.1-5 Noninvasive biomarkers able to detect subclinical rejection processes might help to guide performance of surveillance biopsies and improve patient management.6 Urine C-X-C motif chemokine 10 (CXCL10) is a promising biomarker that has been consistently associated with clinical and subclinical allograft rejection in several adult and pediatric cohorts.7-17
Normal human urine contains over 6000 proteins, including a high content of proteases; thus, there are many potential inhibitors, interactions, and degradation processes depending on the pH and temperature.18,19 In addition, various cell components (eg, red blood cells, leucocytes, epithelial cells) as well as bacterial and viral infections could influence the level of urine protein biomarkers. Therefore, it is critical to understand and fully characterize the potential technical and biological sources of variability for urine CXCL10 as it has been established for some other urine proteins.20-25
In previous studies, urine CXCL10 has been measured by either in-house enzyme-linked immunosorbent assay using polyclonal capture/detection antibodies,14,15 commercial enzyme-linked immunosorbent assay tests9,13 or on the Luminex platform.8,12 So far, very few technical and biological aspects have been reported for urine CXCL10. These data are limited by small transplant patient sample sizes (n = 3) and intraindividual variability evaluated using healthy urines, which typically have extremely low to undetectable urine CXCL10 concentrations.12 Although 2 confounders—urinary tract infection (UTI) and active BK-polyomavirus (BKPyV) infection—have already been explored,12,14,26 a detailed and systematic analysis has not yet been performed for any assay or platform.
Our groups launched 2 randomized controlled trials investigating the clinical utility of a urine CXCL10 monitoring for posttransplant management (ClinicalTrials.gov: NCT0320680127 and NCT03140514). In both studies, urine CXCL10 is measured by a sandwich immunoassay using electrochemiluminescence. This assay was selected due to its high sensitivity, use of monoclonal antibodies, traceable reagents manufactured in an ISO-certified facility, rapid turnaround, interassay coefficient of variation (CV) that meets Food and Drug Administration criteria for a quantitative assay, and ease of use. The aim of the study was to investigate important technical and biological aspects, as well as potential confounders when measuring urine CXCL10 with this assay.
MATERIALS AND METHODS
Study Population and Urine Collection Scheme
All urine samples were derived from adult renal transplant recipients participating in a prospective trial at the University Hospital Basel investigating the clinical utility of a urine CXCL10 monitoring for posttransplant management (ClinicalTrials.gov: NCT03140514). This study was approved by the local ethics committee (EKNZ Nr. 2017-00742), and all participants gave informed consent.
Urine samples were obtained at predefined time points posttransplant according to the study protocol (at wk 4, 5, 10, 11, 22, and 24 and at 1 year; the samples obtained at wk 4/5, 10/11, and 22/24 are considered as pairs). In addition, urine samples were obtained immediately before biopsies were performed.
Urine Sampling and Handling
Midstream urine samples were collected in 8-mL tubes, instantly stored at 4°C, and further processed within 6 hours. Tubes were centrifuged at 4°C for 10 minutes at 3000 rpm (1962 g), the supernatant transferred into 2-mL cryo-tubes, and aliquots stored at −70°C until analysis in patches once a week.
Urine CXCL10 Measurements
Urine samples were thawed on ice and CXCL10 protein levels were quantified using the MSD V-Plex Chemokine Panel 1 (MesoScale Discovery, Rockville, MD) according to the manufacturer’s instructions. Briefly, urine samples were diluted 1:4 in assay buffer (Diluent 43) and 50 µL per well applied in duplicates on the MSD plate. For every assay, the MSD calibrator from the kit was diluted freshly to a 7-point standard curve. Standards and 3 analytical controls (low, intermediate, and high CXCL10 concentration) were included on every plate. Then, the samples were incubated on a rotary plate shaker (IKA MS 3 digital) for 2 hours at 600 rpm at room temperature. Following washing of the MSD plate, anti-CXCL10 antibody diluted in Diluent 3 was added. Next, the plate was again incubated shaking for 2 hours at 550 rpm at room temperature, washed, and tap-dried followed by the addition of the detection reagent (2X Read Buffer T). All pipetting steps were performed in reverse pipetting mode to avoid air bubbles. Ten minutes after the addition of the detection reagent to the MSD plate, it was read on the MESO QuickPlex SQ 120 reader. The calibration curves were established by fitting the signals from the calibrators to a 4-parameter logistic model with 1/Y2 weighting. Chemokine concentrations were determined from the electrochemiluminescence signals by back-fitting to the calibrator curve.
For investigation of assay performance metrics, impact of freeze–thaw cycles, and CXCL10 degradation, we used urine CXCL10 concentrations as the reported unit (pg/mL). For all other evaluation in this study, we used CXCL10/creatinine ratios to correct for different urine dilution (ng/mmol).
Other Urine Analyses
All other urine analyses were performed in the routine clinical laboratory in aliquots obtained at the same time point as for CXCL10 measurements.
Urine cells were assessed by fully automated flow cytometry on the UX-2000 analyzer from Sysmex. Results are reported as cells per microliter and translated into the better-known unit of cells per high-power field for urine erythrocytes and leucocytes.
For determination of total protein and creatinine, the urine was centrifuged at 22°C for 8 minutes at 3004 g and processed on the Cobas 8000 Series from Roche Diagnostics. Total protein concentration was measured using the third-generation turbidimetric assay, and creatinine was measured using the second-generation creatinine plus assay from Roche Diagnostics. The lower limit of detection for the creatinine assay is 0.1 mmol/L and 0.04 g/L for the total protein assay. The CV for the creatinine assay is 1.5% and for the total protein assay 0.9%.
Quantification of Urine Decoy Cells in Urine
Decoy cells were identified and quantified on routine alcohol fixed and Papanicolaou stained cytology specimens from cytocentrifuged (Cytospin, Thermo Fisher Scientific) urine samples as previously described.28 Quantification was performed in an area with highest numbers of Decoy cells, and the number of Decoy cells in this area per 10 high-power microscopic field was provided.
Degradation Over Time Experiment
To evaluate if CXCL10 is prone to degradation, we randomly selected 32 stored urine samples from 32 patients. To account for sex- and concentration-specific confounders, all samples were first grouped by CXCL10 concentrations into quartiles (high, intermediate-high, intermediate-low, and low). From each of these 4 subgroups, 4 female and 4 male samples were randomly chosen and subjected to a time-course experiment. For this aim, 1 aliquot per patient was thawed on ice and split into 0.5-mL protein low-bind tubes. Hundred microliters of each sample was then incubated at 4°C, 25°C, or 37°C for 8, 24, and 72 hours, respectively. The tubes were snap-frozen on dry ice and stored at −70°C until simultaneous analysis.
Freeze–Thaw Cycles Experiment
Aliquoted urine samples from 7 random patients were thawed on ice and snap-frozen on dry ice repeatedly. After each thaw cycle, 100 µL of urine was transferred to a fresh protein low-bind tube, snap-frozen on dry ice, and stored at −70°C until simultaneous analysis.
Statistical Analysis
We used JMP software version 14.0.0 for statistical analysis (SAS Institute, Inc., Cary, NC). Unless stated otherwise, continuous, not normally distributed data were summarized as median (interquartile range) and analyzed by the Wilcoxon/Kruskal–Wallis rank-sum test.
RESULTS
Overview of the Study Population
The study population and urine selection are detailed in Figure 1. Between October 2017 and April 2019, we collected 734 urine samples from 119 patients in the context of the previously mentioned prospective trial. To compare only samples collected at similar time points, we exclude 103 urine samples obtained at transplant biopsies. Furthermore, we had to exclude 36 samples due to incomplete data. Thus, the final study population consisted of 595 urines from 117 patients obtained at specific screening time points (ie, wk 4 and 5; wk 10 and 11; wk 22 and 24; 1 y) and is referred to as the “whole cohort.” To investigate additional confounders except UTI and significant active BKPyV replication, a subgroup of 382 urine samples without leucocyturia and Decoy cell shedding was created and referred to as the “additional confounders” group. From these 382 urine samples, we identified 145 pairs of samples that were collected within 1–2 weeks and we investigated in this “paired samples” group the intraindividual CXCL10 variability.
Figure 1.
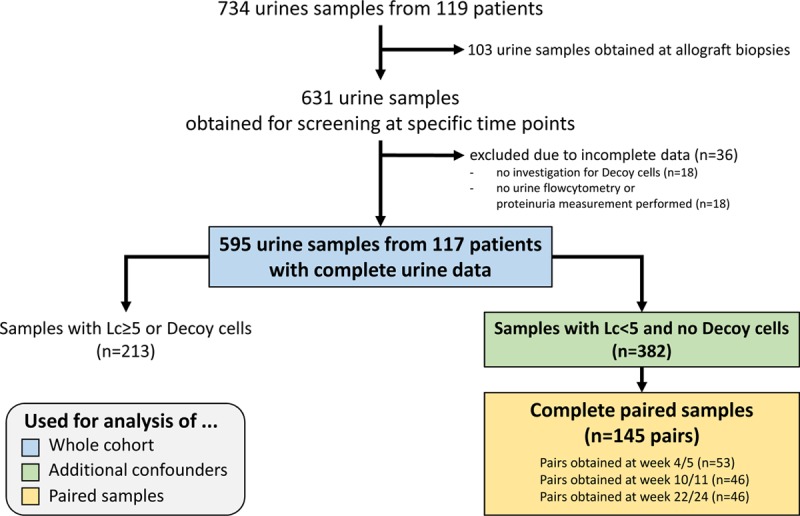
Selection of patients/urines for the study and specific subgroup analyses. Lc, leucocyturia.
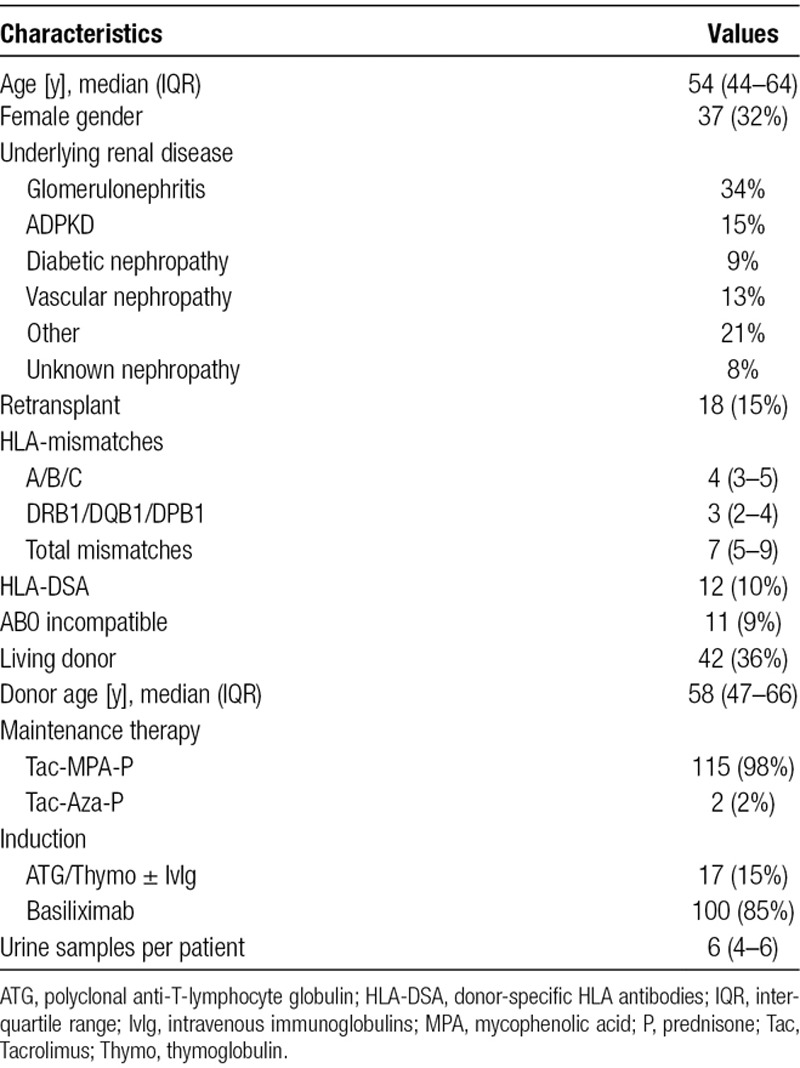
Table 1 summarizes recipient and donor demographics of the 117 patients providing 595 urine samples for the study. As only few exclusion criteria were defined for the prospective urine CXCL10 monitoring trial (ie, HLA-identical donor, primary nonfunction, unable to give informed consent), the study population covers a wide range of transplantation scenarios, including ABO-incompatibility and presence of donor-specific HLA antibodies. Almost all patients started on a tacrolimus–mycophenolate–prednisone maintenance immunosuppression.
TABLE 1.
Recipient and donor demographics of the 117 patients providing 595 urine samples for the study
Technical Variability
Assay Performance Metrics
The lower limit of detection of the assay as specified by the provider is 0.37 pg/mL, and the linear range of measurement is from 1.37 to 500 pg/mL. We could confirm these data in our hands (data not shown). Notably, 568/595 samples (95%) were in this range, while 27 samples had values >500 pg/mL (maximum of 13 915 pg/mL).
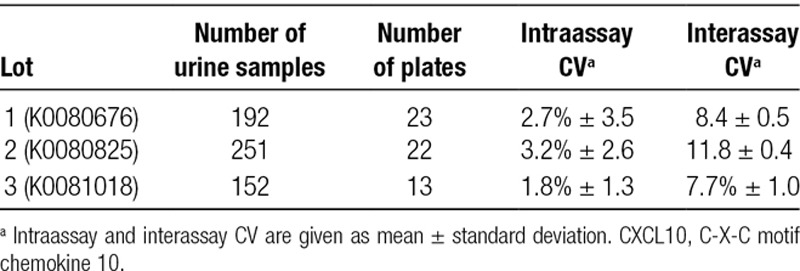
The intraassay CV was determined based on duplicate measurements from 595 urine samples run on 58 plates of 3 different lots and ranged from 1.8% to 3.2%. For the interassay CV, the 3 analytical controls included in every plate were used (381, 61.8, and 10.8 pg/mL) and ranged from 7.7% to 11.5% (Table 2). Based on the determined interassay CVs, we arbitrarily considered CXCL10 measurements within ±10% as stable for the following 2 experiments.
TABLE 2.
Interassay and intraassay coefficient of variation (CV) observed in duplicate measurements from 595 urine samples run on 58 plates of 3 lots. For interassay CV, 3 analytical controls were used (low, intermediate, and high CXCL10 concentration)
Impact of Freeze–Thaw Cycles on CXCL10 Concentrations
Up to 5 repeated freeze–thaw cycles had no significant influence on the CXCL10 protein levels detected regardless of the initial CXCL10 concentration (Figure 2). Surprisingly, after the sixth freeze–thaw cycle, we measured significantly higher values in 2 of 7 samples.
Figure 2.
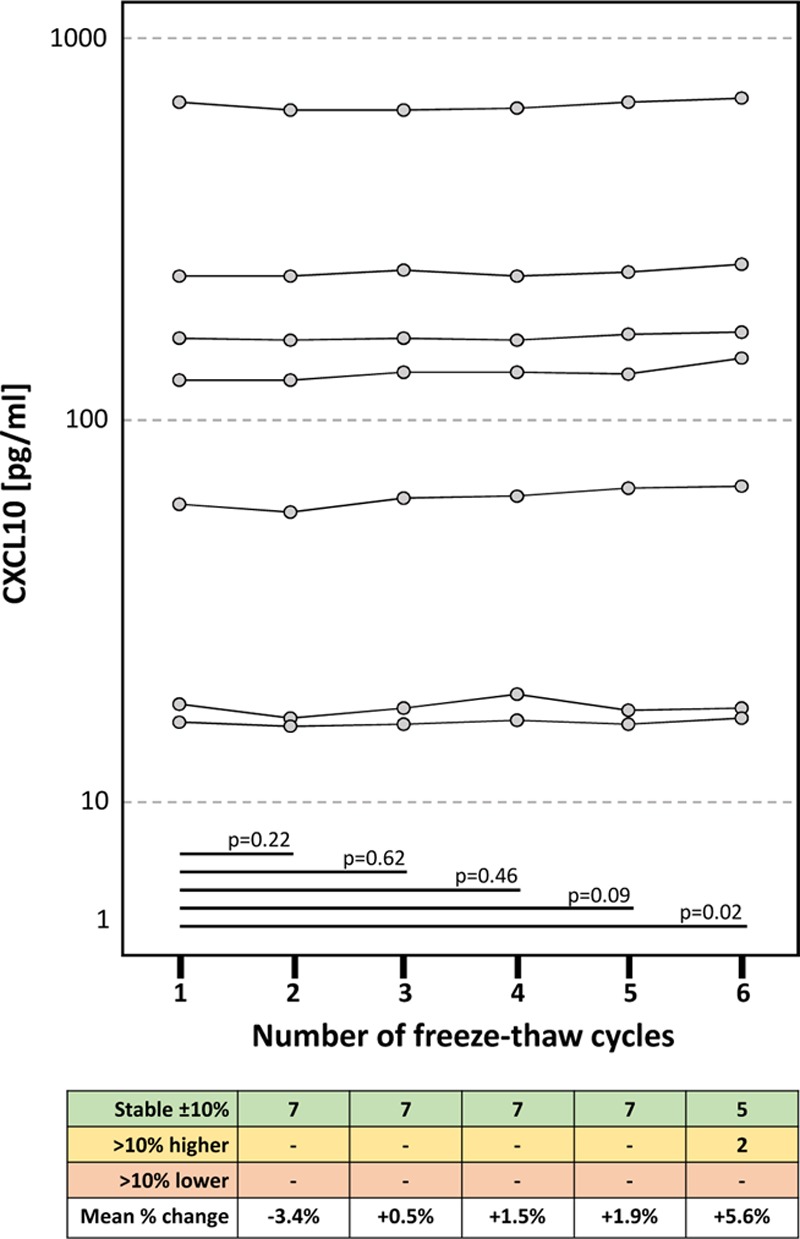
Impact of freeze–thaw cycles on urine CXCL10 concentrations. Matched pairs t-tests were used for statistical analysis. CXCL10, C-X-C motif chemokine 10.
Degradation of Urine CXCL10 at Different Temperatures Over Time
In this experiment, we investigated the extent of CXCL10 degradation in 32 urine samples incubated at 4°C, 25°C, and 37°C for 8, 24, and 72 hours. The results are detailed in Figure 3. At 4°C, CXCL10 concentrations only dropped by 5.7% after 72 hours (P = 0.13). By contrast, at 25°C, degradation occurred in a time-dependent way and reached 19.3% after 72 hours (P = 0.009). The most striking degradation was observed at 37°C (7.5% after 8 h, 18.4% after 24 h, and 34.6% after 72 h). We noticed that the degradation process demonstrated a significant individual variation illustrated by the wide standard deviation of the percent degradation, especially at 25°C and 37°C. Interestingly, about 10% of samples showed a slight increase in CXCL10 levels compared to baseline, which persisted over time.
Figure 3.
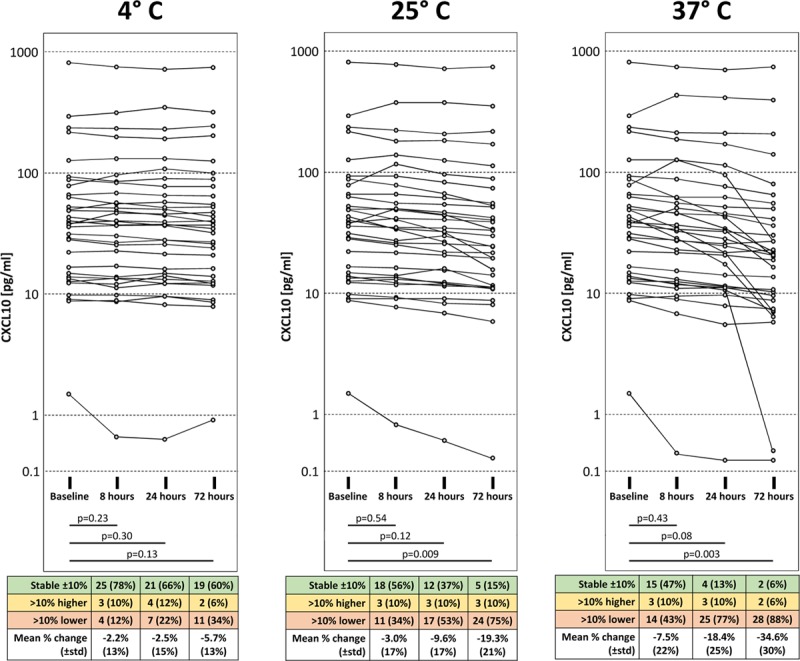
Degradation of urine CXCL10. CXCL10 protein levels in urine decrease in a time- and temperature-dependent manner. Matched pairs t-tests were used for statistical analysis. CXCL10, C-X-C motif chemokine 10.
Urine CXC10 Concentrations and Urine CXCL10/Creatinine Ratios
Urine creatinine concentrations showed a large variation, but overall there was a strong correlation between urine CXC10 concentrations and urine CXCL10/creatinine ratios (r2 = 0.98; P < 0.0001) (Figure 4). By contrast, urine creatinine did not correlate with urine CXC10 concentrations (r2 = −0.002; P = 0.98).
Figure 4.
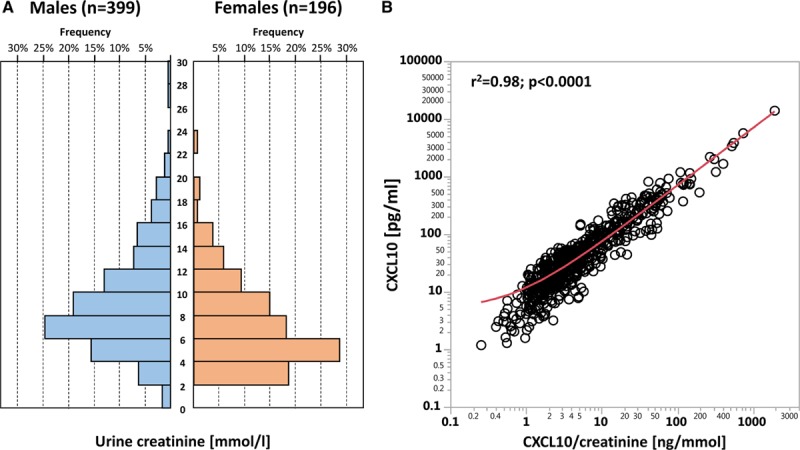
A, Frequency distribution of urine creatinine concentrations among females and males. B, Correlation between urine CXCL10 concentration (pg/mL) and CXCL10/creatinine ratio (ng/mmol). CXCL10, C-X-C motif chemokine 10.
Biological Variability
Leucocyturia and Active BKPyV Infection as Confounders
Several previous studies correlating mainly urine CXCL10 with histology-defined pathologies demonstrated that bacterial and BKPyV infections of the transplant or lower urinary tract may lead to elevated urine CXCL10 levels.7,14,26 We analyzed these 2 known confounders in detail in timed screening urine samples of our study.
Leucocyturia and Decoy cell shedding in the urine as a marker of significant urinary tract replication of BKPyV did not correlate at all (r2 = 0.0001; P = 0.77) (Figure 5A). Therefore, the following analyses were performed in the whole cohort without any exclusions (ie, exclusion of samples with Decoy cells shedding in the correlation analysis of leucocyturia with CXCL10/creatinine ratios and other way round).
Figure 5.
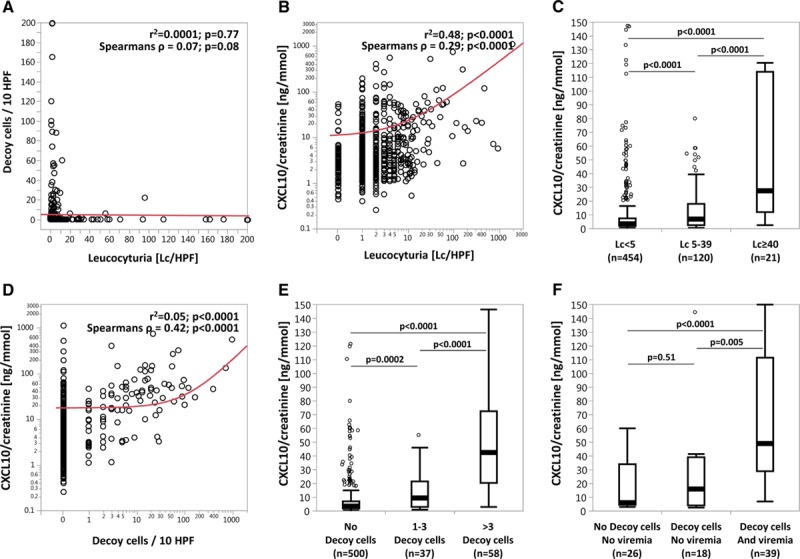
Correlation of leucocyturia and active BKPyV infection with urine CXCL10/creatinine ratios. A, Correlation of Decoy cell shedding with Lc/HPF. B, Correlation of CXCL10/creatinine ratios with Lc/HPF. C, CXCL10/creatinine ratios in samples with Lc <5, Lc 5-39, and Lc ≥40/HPF. D, Correlation of CXCL10/creatinine ratios with Decoy cell shedding. E, CXCL10/creatinine ratios in samples with no Decoy cells, 1–3 Decoy cells, and >3 Decoy cells. F, CXCL10/creatinine ratios in samples without Decoy cell shedding and BKPyV viremia, in samples with isolated Decoy cell shedding, and in samples having both Decoy cell shedding and BKPyV viremia. Cutoffs for leucocyturia were based on commonly used thresholds (<5 = normal, ≥40 = significant leucocyturia, 5–39 = intermediate range). Cutoffs for Decoy cells were defined by the thresholds used at our center (No Decoy cells = normal, >3 Decoy cells = significant Decoy cell shedding, 1–3 Decoy cells = intermediate range). Samples with BKPyV viremia (n = 39) had median values of 45 800 c/mL (IQR = 6300–150 400 c/mL). BKPyV, BK-polyomavirus; CXCL10, C-X-C motif chemokine 10; IQR, interquartile range.
CXCL10/creatinine ratios strongly correlated with leucocyturia (r2 = 0.48; P < 0.0001) (Figure 5B). Furthermore, we observed a stepwise increase of CXCL10/creatinine ratios with the extent of leucocyturia (Lc < 5/HPF → 3.35 ng/mmol [1.86–7.66]; Lc 3–39/HPF → 6.89 ng/mmol [2.69–18.14]; Lc ≥ 40/HPF → 27.68 ng/mmol [12.20–114.13]; all P < 0.0001) (Figure 5C).
CXCL10/creatinine ratios also strongly correlated with the number of Decoy cells in the urine as a marker of significant urinary tract replication of BKPyV (r2 = 0.05; P < 0.0001) (Figure 5D). Similar to leucocyturia, we also observed a stepwise increase of CXCL10/creatinine ratios with the extent of Decoy cell shedding (no Decoy cells/HPF → 3.29 ng/mmol [1.85–7.11]; 1–3 Decoy cells/HPF → 9.36 ng/mmol [2.96–21.54]; >3 Decoy cells/HPF → 42.43 ng/mmol [20.49–72.73]; all P ≤ 0.0002) (Figure 5E).
Active BKPyV infection leads first to significant viral shedding into the urine detectable by either increasing urine BKPyV viral loads or Decoy cells and can be followed by BKPyV viremia in more severe cases. To investigate whether CXCL10/creatinine ratios already increase at the stage of isolated urine BKPyV shedding, we analyzed all cases in which both Decoy cells and BKPyV viremia were measured simultaneously (n = 83 of 595 urine samples). Compared to urine samples without Decoy cells and negative BKPyV viremia (ie, <1000 c/mL), we observed numerically elevated CXCL10/creatinine ratios already in samples showing only Decoy cells, but this did not reach statistical significance (6.01 ng/mmol [4.60–33.88] versus 15.79 ng/mmol [3.85–39.13]; P = 0.51). Samples with Decoy cells and BKPyV viremia demonstrated significantly higher CXCL10/creatinine ratios compared to the other 2 groups (48.79 ng/mmol [29.21–111.62]; P ≤ 0.005) (Figure 5F).
Evaluation of Other Potential Confounders
To explore additional confounders except leucocyturia and active BKPyV infection, we restricted the analysis to samples having Lc < 5/HPF and no Decoy cells (n = 382). We found no significant correlation of CXCL10/creatinine ratios with kidney function, age, systemic inflammation inferred by serum CRP, proteinuria, urine pH, hematuria, urine squamous epithelial cell count, and urine bacterial count (Figure 6).
Figure 6.
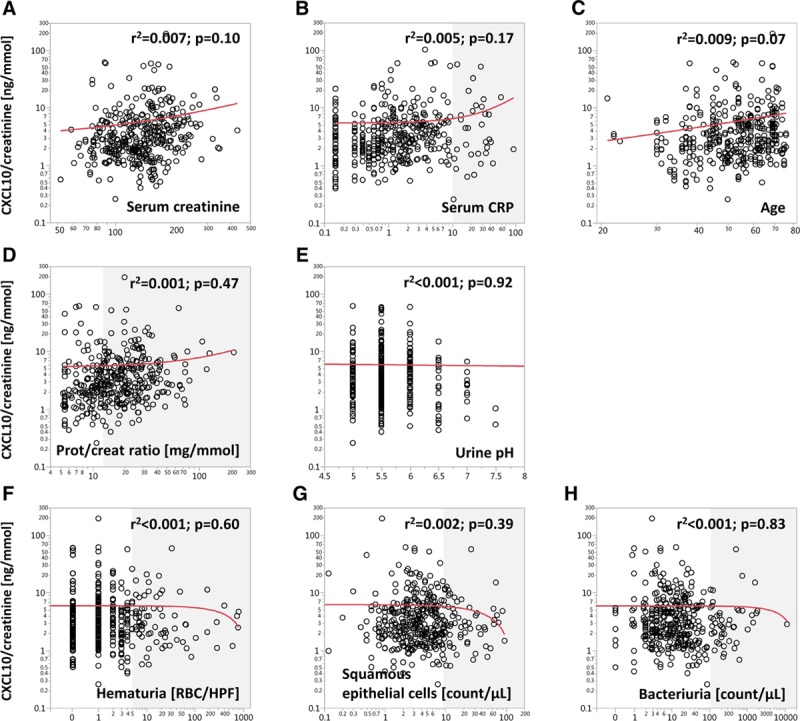
Correlation of CXCL10/creatinine ratios with clinical blood and urine parameters as potential confounders. For this analysis, only samples with Lc < 5 and no Decoy cells were included (n = 382). The gray shades indicate values outside of the normal range. CXCL10, C-X-C motif chemokine 10; Lc, leucocyturia.
Intraindividual Variability of Urine CXCL10 Within 1–2 Weeks
Next, we investigated the intraindividual variability of urine CXCL10/creatinine ratios in 145 paired samples that were obtained within 1–2 weeks. For this analysis, we calculated the difference between the later and the previous samples for each pair (eg, CXCL10/creatinine ratio at wk 5 minus CXCL10/creatinine at wk 4). All differences were then ranked and plotted in descending order. Figure S1A (SDC, http://links.lww.com/TXD/A232) illustrates that 116/145 (80%) had absolute changes of < ±2 ng/mmol, whereas roughly 10% at each end had >2 ng/mmol increases or decreases, respectively (paired t-test among all 145 pairs: P = 0.44). Notably, 14/29 cases demonstrating higher than ±2 ng/mmol changes had mean CXCL10/creatinine ratios >10 ng/mmol.
In a second analysis, paired samples obtained at the 3 specific time points (ie, wk 4/5, wk 10/11, wk 22/24) were investigated separately. To better illustrate the dynamics below 10 ng/mmol, 14 samples with mean CXCL10/creatinine ratios >10 ng/mmol were not plotted but still included in the statistical analysis (Figure S1B, SDC, http://links.lww.com/TXD/A232). We observed no statistically significant differences in paired samples obtained within the 3 time frames (paired t-test: P = 0.90, P = 0.61, and P = 0.64, respectively). However, the changes were in general higher in samples with higher CXCL10/creatinine ratios.
Finally, we performed the same analysis using relative changes of CXCL10/creatinine ratios instead of absolute values in ng/mmol (Figure 7A). In 110/145 paired samples (76%), CXCL10/creatinine ratios changed < ±50% from the first to the second sample. The highest percent changes were observed in samples with either very low (≤3 ng/mmol) or very high (≥20 ng/mmol) average CXCL10/creatinine ratios (Figure 7B).
Figure 7.
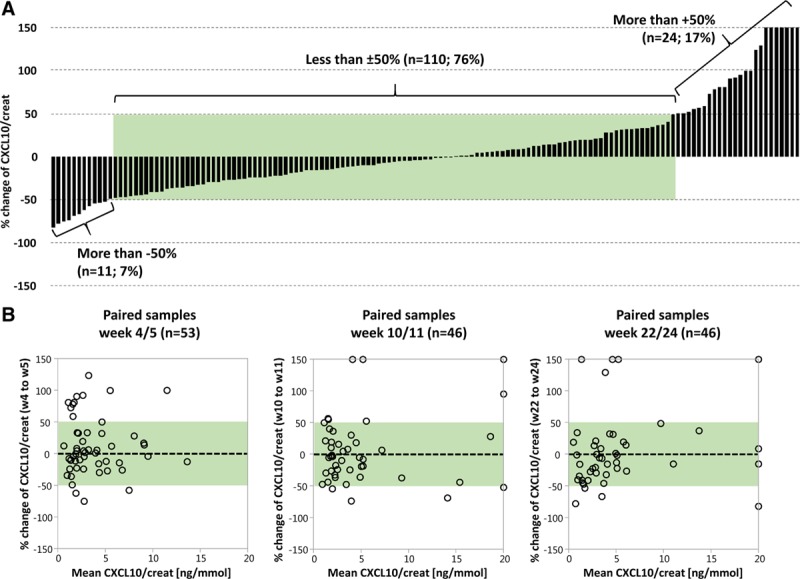
Intraindividual variability of urine CXCL10/creatinine ratios within 1–2 wk in percent changes. A, 145 paired samples ranked according to descending differences of CXCL10/creatinine ratios between the paired samples (53 at wk 4/5, 46 at wk 10/11, and 46 at wk 22/24). B, Bland-Altman diagrams of the paired samples obtained within the 3 time frames. The green shades indicate the range of CXCL10/creatinine ratios changes within ±50%. CXCL10, C-X-C motif chemokine 10.
DISCUSSION
In this study, we explored technical and biological variability as well as confounders when measuring urine CXCL10 on the MSD platform. These data are novel and highly relevant for current and future efforts to explore the clinical utility of urine CXCL10 monitoring after renal transplantation.
The platform provides the required sensitivity down to 1 pg/mL, and a linear range of measurements from 1 to 500 pg/mL, which covered the vast majority of samples in our cohort. The assay is very robust and accurate with intraassay CV around 2.5% and interassay CV around 9.3%, which fulfills the Food and Drug Administration requirements for a quantitative assay (ie, interassay CV < 20%).
Urine CXCL10 concentrations remained stable after up to 5 freeze–thaw cycles. We cannot explain the slight increase of CXCL10 measurements in 2/7 samples after the sixth freeze–thaw cycle, but we regard it not as critical.
Degradation of CXCL10 can occur in vivo in the bladder and after voiding of urine. Therefore, it is important to investigate the degradation process at body temperature (37°C) as well as at different storage temperatures (room temperature of 25°C and fridge temperature of 4°C). After 8 hours at 37°C, the CXCL10 concentrations were 7.5% lower. As we assume that patients usually void urine at least every 8 hours, the in vivo degradation of CXCL10 should be <10%. However, in patients with oliguria or in first morning urine samples, CXCL10 concentrations might be >10% lower, because the urine accumulated in the bladder for >8 hours. CXCL10 concentrations remained stable (ie, <10% degradation) for 8 hours at 25°C and for 3 days at 4°C. Based on these data, the following sample collection/handling can be recommended to reduce biases from in vivo and ex vivo degradation: (a) collection of second morning urine, (b) processing of sample within 8 hours, and (c) if processing cannot be performed within 8 hours, storage at 4°C and processing within 3 days is strongly advised. Following these recommendations, the overall reduction of CXCL10 concentration from degradation processes should be <20%, which is still far lower than the observed biological variation of ±50% and therefore clinically not of major importance.
Notably, the reported degradation data only apply to this assay and the used capture/detection antibodies. In general, during the degradation process, epitopes targeted by capture/detection antibodies might be altered or even lost leading to lower measured CXCL10 values and hence the observed degradation will be regarded as more pronounced.
Three of 32 samples (10%) demonstrated an increase of CXCL10 concentration in these degradation experiments compared to baseline, which persisted over time. Although we cannot fully explain this observation, we noticed in 1 sample a few remaining leucocytes, which might not have been removed by centrifugation and which might have released endogenous CXCL10.
UTI and active BKPyV infection are major confounders for urine CXCL10 analysis.7,12,14,26 Our study demonstrates that both leucocyturia and Decoy cell shedding are associated with elevated urine CXCL10 values, but they did not correlate indicating independent processes. Not surprisingly, we observed a stepwise increase of urine CXCL10 values with the extent of leucocyturia. In the absence of leucocyturia (ie, <5 per HPF), bacteriuria and urine squamous epithelial cell count did not correlate with urine CXCL10, strongly suggesting that contamination by first void urine and bacteriuria without an inflammatory host response are not relevant confounders. As we did not systematically record (UTI) symptoms with every collected urine sample, we cannot provide data whether patients with leucocyturia had symptomatic or asymptomatic UTI.
It has already been shown that BKPyV viremia and BKPyV nephropathy are associated with elevated urine CXCL10 concentrations.7,12,14,26 Our data confirm the first observation and add more granular details for early stages of active BKPyV infections (ie, Decoy cell shedding). The extent of Decoy cell shedding strongly correlated with urine CXCL10 values. Due to limited sample size, it is not possible to draw a firm conclusion whether urine CXCL10 is only elevated when BKPyV viremia occurs or whether isolated presence of Decoy cells without BKPyV viremia can already lead to elevated urine CXCL10 values. Notably, both infiltrating BKPyV-specific lymphocytes as well as infected tubular epithelial cells might contribute to elevated urine CXCL10 values.29-31
Allograft function, serum CRP, patient age, proteinuria, urine pH, hematuria, squamous epithelia cell count, and bacteriuria did not correlate with urine CXCL10 concentrations and thus seem not to be relevant confounders. However, in case of leucocyturia or active BKPyV infection, urine CXCL10 values must be interpreted with caution. Elevated values in this context are most likely related to leucocyturia or active BKPyV infection, but a concomitant rejection process cannot be ruled out. To overcome this diagnostic “blind spot,” CXCL10 measurement should be repeated after resolution of leucocyturia or active BKPyV infection. If a high suspicion for rejection exists, an allograft biopsy should be performed in a timely manner and not delayed until confounders can be excluded.
The intraindividual variability within 1–2 weeks of urine CXCL10/creatinine ratios was in about 80% of patients ±2 ng/mmol or ±50%, respectively, which is comparable to the intraindividual variability of albuminuria (4%–103%, with a central tertile of 28%–47%).32 This suggests that in the absence of leucocyturia and Decoy cells shedding, urine CXCL10 levels are in many patients fairly stable and might represent a steady-state inflammatory burden in the allograft, most likely due to a rejection process. Clearly, rejection is a very dynamic process depending also on modifications of the immunosuppression. Paired samples with more significant urine CXCL10 changes might indicate flares or resolution of rejection, but this information was not available for this study, because the underlying randomized controlled trial is still running and the clinical data concealed. As anticipated, paired samples with very low CXCL10/creatinine ratios showed higher variation when calculated as percentage change, while paired samples with high CXCL10/creatinine ratios showed higher variation when calculated as absolute value change.
In conclusion, urine CXCL10 measurement on the MSD platform is accurate and robust. Leucocyturia and active BKPyV infection are major confounders, which can be easily detected but represent important diagnostic “blind spots” when using urine CXCL10 to screen for allograft rejection. The biological variability of urine CXCL10 within 1–2 weeks is mostly below ±50%, which is still much higher than the technical variability due to sample handling/processing (<20%).
ACKNOWLEDGMENTS
We thank the nurses in the outpatient clinic for their outstanding help in the management of the patients. We also thank the team of HLA-diagnostics & immunogenetics for their help in sample collection, as well as Claudia Petit and Aynur Gubelmann for performing CXCL10 analyses.
Footnotes
Published online 24 December, 2019.
S.S. is supported by the Swiss National Science Foundation (grant # 32003B_169310). J.H. is supported by a Canadian Institutes of Health Research New Investigator Award (grant # 340137). P.N. is supported by the Flynn Family Chair in Renal Transplantation. The company MSD had no influence on research design, data analysis, and conclusions and did not support the study.
J.H., P.H.M., G.H., and S.S. participated in research design. All authors participated in writing of the paper. J.H., P.H.M., S.M., S.S.P., and S.S. participated in the performance of the research. J.H. and S.S. participated in data analysis.
REFERENCES
- 1.Ekberg H, Tedesco-Silva H, Demirbas A, et al. ELITE-Symphony Study. Reduced exposure to calcineurin inhibitors in renal transplantation. N Engl J Med. 2007;357(25):2562–2575. doi: 10.1056/NEJMoa067411. [DOI] [PubMed] [Google Scholar]
- 2.Moreso F, Ibernon M, Gomà M, et al. Subclinical rejection associated with chronic allograft nephropathy in protocol biopsies as a risk factor for late graft loss. Am J Transplant. 2006;6(4):747–752. doi: 10.1111/j.1600-6143.2005.01230.x. [DOI] [PubMed] [Google Scholar]
- 3.Amico P, Hirt-Minkowski P, Hönger G, et al. Risk stratification by the virtual crossmatch: a prospective study in 233 renal transplantations. Transpl Int. 2011;24(6):560–569. doi: 10.1111/j.1432-2277.2011.01235.x. [DOI] [PubMed] [Google Scholar]
- 4.Heilman RL, Devarapalli Y, Chakkera HA, et al. Impact of subclinical inflammation on the development of interstitial fibrosis and tubular atrophy in kidney transplant recipients. Am J Transplant. 2010;10(3):563–570. doi: 10.1111/j.1600-6143.2009.02966.x. [DOI] [PubMed] [Google Scholar]
- 5.Rush D. Protocol transplant biopsies: an underutilized tool in kidney transplantation. Clin J Am Soc Nephrol. 2006;1(1):138–143. doi: 10.2215/CJN.00390705. [DOI] [PubMed] [Google Scholar]
- 6.Wiebe C, Ho J, Gibson IW, et al. Carpe diem-time to transition from empiric to precision medicine in kidney transplantation. Am J Transplant. 2018;18(7):1615–1625. doi: 10.1111/ajt.14746. [DOI] [PubMed] [Google Scholar]
- 7.Hu H, Aizenstein BD, Puchalski A, et al. Elevation of CXCR3-binding chemokines in urine indicates acute renal-allograft dysfunction. Am J Transplant. 2004;4(3):432–437. doi: 10.1111/j.1600-6143.2004.00354.x. [DOI] [PubMed] [Google Scholar]
- 8.Hu H, Kwun J, Aizenstein BD, et al. Noninvasive detection of acute and chronic injuries in human renal transplant by elevation of multiple cytokines/chemokines in urine. Transplantation. 2009;87(12):1814–1820. doi: 10.1097/TP.0b013e3181a66b3e. [DOI] [PubMed] [Google Scholar]
- 9.Rabant M, Amrouche L, Lebreton X, et al. Urinary C-X-C motif chemokine 10 independently improves the noninvasive diagnosis of antibody-mediated kidney allograft rejection. J Am Soc Nephrol. 2015;26(11):2840–2851. doi: 10.1681/ASN.2014080797. [DOI] [PMC free article] [PubMed] [Google Scholar]
- 10.Rabant M, Amrouche L, Morin L, et al. Early low urinary CXCL9 and CXCL10 might predict immunological quiescence in clinically and histologically stable kidney recipients. Am J Transplant. 2016;16(6):1868–1881. doi: 10.1111/ajt.13677. [DOI] [PubMed] [Google Scholar]
- 11.Matz M, Beyer J, Wunsch D, et al. Early post-transplant urinary IP-10 expression after kidney transplantation is predictive of short- and long-term graft function. Kidney Int. 2006;69(9):1683–1690. doi: 10.1038/sj.ki.5000343. [DOI] [PubMed] [Google Scholar]
- 12.Jackson JA, Kim EJ, Begley B, et al. Urinary chemokines CXCL9 and CXCL10 are noninvasive markers of renal allograft rejection and BK viral infection. Am J Transplant. 2011;11(10):2228–2234. doi: 10.1111/j.1600-6143.2011.03680.x. [DOI] [PMC free article] [PubMed] [Google Scholar]
- 13.Hricik DE, Nickerson P, Formica RN, et al. Multicenter validation of urinary CXCL9 as a risk-stratifying biomarker for kidney transplant injury. Am J Transplant. 2013;13(10):2634–2644. doi: 10.1111/ajt.12426. [DOI] [PMC free article] [PubMed] [Google Scholar]
- 14.Hirt-Minkowski P, Amico P, Ho J, et al. Detection of clinical and subclinical tubulo-interstitial inflammation by the urinary CXCL10 chemokine in a real-life setting. Am J Transplant. 2012;12(7):1811–1823. doi: 10.1111/j.1600-6143.2012.03999.x. [DOI] [PubMed] [Google Scholar]
- 15.Ho J, Rush DN, Karpinski M, et al. Validation of urinary CXCL10 as a marker of borderline, subclinical, and clinical tubulitis. Transplantation. 2011;92(8):878–882. doi: 10.1097/TP.0b013e31822d4de1. [DOI] [PubMed] [Google Scholar]
- 16.Blydt-Hansen TD, Gibson IW, Gao A, et al. Elevated urinary CXCL10-to-creatinine ratio is associated with subclinical and clinical rejection in pediatric renal transplantation. Transplantation. 2015;99(4):797–804. doi: 10.1097/TP.0000000000000419. [DOI] [PubMed] [Google Scholar]
- 17.Mincham CM, Gibson IW, Sharma A, et al. Evolution of renal function and urinary biomarker indicators of inflammation on serial kidney biopsies in pediatric kidney transplant recipients with and without rejection. Pediatr Transplant. 2018;22(5):e13202. doi: 10.1111/petr.13202. [DOI] [PubMed] [Google Scholar]
- 18.Zhao M, Li M, Yang Y, et al. A comprehensive analysis and annotation of human normal urinary proteome. Sci Rep. 2017;7(1):3024. doi: 10.1038/s41598-017-03226-6. [DOI] [PMC free article] [PubMed] [Google Scholar]
- 19.Schaub S, Wilkins JA, Antonovici M, et al. Proteomic-based identification of cleaved urinary beta2-microglobulin as a potential marker for acute tubular injury in renal allografts. Am J Transplant. 2005;5(4 Pt 1):729–738. doi: 10.1111/j.1600-6143.2005.00766.x. [DOI] [PubMed] [Google Scholar]
- 20.Herrington W, Illingworth N, Staplin N, et al. Effect of processing delay and storage conditions on urine albumin-to-creatinine ratio. Clin J Am Soc Nephrol. 2016;11(10):1794–1801. doi: 10.2215/CJN.13341215. [DOI] [PMC free article] [PubMed] [Google Scholar]
- 21.Giesen C, Lieske JC. The influence of processing and storage conditions on renal protein biomarkers. Clin J Am Soc Nephrol. 2016;11(10):1726–1728. doi: 10.2215/CJN.08800816. [DOI] [PMC free article] [PubMed] [Google Scholar]
- 22.Nauta FL, Bakker SJ, Lambers HH, et al. Effect of frozen storage on urinary concentration of kidney damage markers. Am J Kidney Dis. 2012;59(4):586–589. doi: 10.1053/j.ajkd.2011.11.025. [DOI] [PubMed] [Google Scholar]
- 23.Brinkman JW, de Zeeuw D, Duker JJ, et al. Falsely low urinary albumin concentrations after prolonged frozen storage of urine samples. Clin Chem. 2005;51(11):2181–2183. doi: 10.1373/clinchem.2005.053777. [DOI] [PubMed] [Google Scholar]
- 24.Parikh CR, Butrymowicz I, Yu A, et al. ASSESS-AKI Study Investigators. Urine stability studies for novel biomarkers of acute kidney injury. Am J Kidney Dis. 2014;63(4):567–572. doi: 10.1053/j.ajkd.2013.09.013. [DOI] [PMC free article] [PubMed] [Google Scholar]
- 25.Schuh MP, Nehus E, Ma Q, et al. Long-term stability of urinary biomarkers of acute kidney injury in children. Am J Kidney Dis. 2016;67(1):56–61. doi: 10.1053/j.ajkd.2015.04.040. [DOI] [PMC free article] [PubMed] [Google Scholar]
- 26.Ho J, Schaub S, Wiebe C, et al. Urinary CXCL10 chemokine is associated with alloimmune and virus compartment-specific renal allograft inflammation. Transplantation. 2018;102((3):521–529. doi: 10.1097/TP.0000000000001931. [DOI] [PubMed] [Google Scholar]
- 27.Ho J, Sharma A, Kroeker K, et al. Multicentre randomised controlled trial protocol of urine CXCL10 monitoring strategy in kidney transplant recipients. BMJ Open. 2019;9(4):e024908. doi: 10.1136/bmjopen-2018-024908. [DOI] [PMC free article] [PubMed] [Google Scholar]
- 28.Singh HK, Bubendorf L, Mihatsch MJ, et al. Urine cytology findings of polyomavirus infections. Adv Exp Med Biol. 2006;577:201–212. doi: 10.1007/0-387-32957-9_15. [DOI] [PubMed] [Google Scholar]
- 29.El-Sawy T, Fahmy NM, Fairchild RL. Chemokines: directing leukocyte infiltration into allografts. Curr Opin Immunol. 2002;14(5):562–568. doi: 10.1016/s0952-7915(02)00382-5. [DOI] [PubMed] [Google Scholar]
- 30.Cockwell P, Calderwood JW, Brooks CJ, et al. Chemoattraction of T cells expressing CCR5, CXCR3 and CX3CR1 by proximal tubular epithelial cell chemokines. Nephrol Dial Transplant. 2002;17(5):734–744. doi: 10.1093/ndt/17.5.734. [DOI] [PubMed] [Google Scholar]
- 31.Oghumu S, Nori U, Bracewell A, et al. Differential gene expression pattern in biopsies with renal allograft pyelonephritis and allograft rejection. Clin Transplant. 2016;30(9):1115–1133. doi: 10.1111/ctr.12795. [DOI] [PMC free article] [PubMed] [Google Scholar]
- 32.Miller WG, Bruns DE, Hortin GL, et al. National Kidney Disease Education Program-IFCC Working Group on Standardization of Albumin in Urine. Current issues in measurement and reporting of urinary albumin excretion. Clin Chem. 2009;55(1):24–38. doi: 10.1373/clinchem.2008.106567. [DOI] [PubMed] [Google Scholar]


