

Abstract
Tumor-associated macrophage (TAM) is major component of tumor immune related inflammation and plays a crucial role in tumor immune escape. However, there have been no studies reported the relationship of TAM and immunosuppressive cell regulatory T cell (Treg) in NPC. This study is to discuss the interaction of TAM and Treg in NPC. In the present study, immunopathological assays demonstrated that M2 macrophage increased in NPC tissues. M2 macrophage had a positive correlation with aberrantly increased Foxp3+ Treg in NPC tissues. High density M2 macrophage and high density Treg predicted poor survival of NPC patients. In vitro studies using tumor cells co-cultured with monocyte indicated that tumor cells could induce monoctye into M2 macrophage via TGF-β1 and IL-10. Tumor cells induced-M2 macrophage could induce the chemotaxis of Treg and increased the percent of Treg in PBMC. Our results proved that NPC cells induced M2 macrophage via TGF-β1 and IL-10, and tumor cells induced-M2 macrophage could favor accumulation of Treg by conversion and chemotaxis.
Keywords: Nasopharyngeal carcinoma, tumor-associated macrophage, M2 macrophage, Treg
Introduction
Nasopharyngeal carcinoma (NPC) is a characteristic epithelial malignancy arising in the nasopharynx. The histopathological characteristic of NPC is a substantial population of infiltrating inflammatory cells. Inflammatory cells such as natural killer cells, macrophage, dendritic cells, and T cells change the immune microenvironment which favors the escape of the tumor cells from immune- mediated rejection. Therefore, inflammatory cells become an attractive target for therapeutic agents.
TAM is an important component of tumor stroma. In the context of tumors, TAM resembles M2-polarized macrophage and had been proved to influence fundamental aspects of tumor biology. Substantial clinical and experimental evidences indicated that in the majority of malignancies M2 macrophage enhanced tumor progression [1]. Macrophage derived from monocytic precursors circulating in the blood and is recruited to tumor sites by several molecules, such as the chemokines CCL2 and CCL5 [2]. The interaction of tumor and macrophage is synergistic. Tumor-derived TGF-β1, CSF1, IL-4, IL-6, and IL-10 have the potential to modulate and polarize macrophage mainly into M2 macrophage [3]. It had been reported that in cervical cancer, hepatocellular carcinoma, and renal cell carcinoma macrophage induced to polarize M2 macrophage and facilitate tumor progression [4-6]. The infiltration of M2 macrophage in malignant tumors such as non-small cell lung carcinoma, hepatocellular cancers, and breast cancer were associated with poor prognosis [7], and M2 macrophage had been reported to enhance angiogenesis, tumor cell migration, and invasion [8-10]. In addition, M2 macrophage had been shown to play a key role in immune suppression [11]. By secreting cytokines such as CCL22 and CCL18 M2 macrophage can recruit mature Treg and by secreting TGF-β and IL-10 M2 macrophage can modulate the conversion of naive T cells to Treg [12]. However, there were no study published about the relationship of NPC cells and M2 macrophage. In this study, we found that NPC cells favor polarization of M2 macrophage via TGF-β1 and IL-10.
It had been documented that elevated levels of Treg induced tumor immune escape in various cancers; therefore, depletion of regulatory T cells could be a novel mechanism for cancer immunotherapy [13]. This selective accumulation of Treg in the tumor microenvironment suggests the process is tumor driven. A number of chemokines including CCL22, CCL17, and CCL18 originally found to be secreted by macrophage, had been shown to recruit Treg to modulate the immune response during the tumorigenic process [14,15]. In addition, TGF-β and IL-2 had been found to regulate the development of natural Treg in the periphery blood via the conversion of naive T cells (CD4+CD25- T cells) into suppressive inducible Foxp3+ Treg [16]. The M2 macrophage are a major source of TGF-β1 and can directly induce Treg to mature [17]. Immunosuppression in the tumor microenvironment mediated by Treg is a dominant mechanism of tumor immune escape, and this immunosuppression is a major hurdle for tumor immunotherapy. However, the relationship of Treg and M2 macrophage in NPC has not yet been described. In this study, we showed that NPC cells could polarize M2 macrophage via TGF-β1 and IL-10, and that polarized-M2 macrophage promoted accumulation of Treg by conversion and chemotaxis.
Materials and methods
Tissue specimens and cell lines
This study was approved by the Ethics Committee of Nanfang Hospital (Southern Medical University, Guangzhou, China). Specimens from 61 patients with untreated NPC and 40 patients with chronic nasopharyngitis were collected from the NPC tissue bank of Nanfang Hospital. The clinical classification for NPC was based on the seventh edition UICC/AJCC staging system. All the 61 NPC patients were treated with a uniform protocol of image-guided intensity modulated radiotherapy or/and cisplatin-based concurrent chemotherapy following induction chemotherapy according to National Comprehensive Cancer Network (NCCN) Guidelines. The research protocols were approved by the Ethics Committee of Nanfang Hospital. The median follow-up was 51 months. The clinicopathological characteristics of NPC patients are shown in Table 1. Written informed consents were obtained from each patient. The tissue specimens were routinely fixed in 10% formalin, embedded in paraffin, and sectioned in 3 μm slices according to routine procedures. Messenger RNA was extracted from fresh tissues of 50 patients with NPC and 30 patients with chronic nasopharyngitis for further experiments.
Table 1.
The clinicopathological characteristics of NPC patients (n=61)
| No. of patients | % | |
|---|---|---|
| Age (years) | ||
| Average age | 45 | |
| Range | 17-77 | |
| Sex | ||
| Male | 49 | 80.3 |
| Female | 12 | 19.7 |
| Cigarette Smoking | ||
| Yes | 28 | 45.9 |
| No | 33 | 55.1 |
| Alcohol Intake | ||
| Yes | 13 | 21.3 |
| No | 48 | 78.7 |
| Histological Subtype | ||
| Differentiated nonkeratinizing carcinoma + squamous cell carcinoma | 5 | 8.2 |
| Undifferentiated nonkeratinizing carcinoma | 56 | 91.8 |
| T Status | ||
| T1 | 10 | 16.4 |
| T2 | 18 | 29.5 |
| T3 | 16 | 26.2 |
| T4 | 17 | 27.9 |
| N Status | ||
| N0 | 5 | 8.2 |
| N1 | 32 | 52.5 |
| N2 | 17 | 27.9 |
| N3 | 7 | 11.4 |
| M Status | ||
| M0 | 0 | 0 |
| M1 | 61 | 100 |
| Clinical Stage | ||
| I | 2 | 3.3 |
| II | 12 | 19.7 |
| III | 23 | 37.7 |
| IV | 24 | 39.3 |
| EBV-DNA | ||
| Positive | 42 | 68.9 |
| Negative | 19 | 31.1 |
| EBV-IgA | ||
| Positive | 17 | 27.9 |
| Negative | 44 | 72.1 |
The human NPC cell lines CNE1, CNE2, and 5-8F were used in our study. These NPC cell lines were cultured in RPMI 1640 medium (Hyclone) with 10% FBS (Gibco) in humidified 5% CO2 atmosphere at 37°C. The immortalized nasopharyngeal epithelium cell line NP69 was cultured in serum-free keratinocyte medium (K-SFM, Gibco).
Immunohistochemistry
Tissue sections were deparaffinized and rehydrated. Antigen retrieval was performed by using 0.05 M citrate buffer, pH 6.0, or EDTA, pH 8.0 at 100°C for 20 minutes. Next, the sections were stained with an antibody against human CD163 (Abcam, USA) and Foxp3 (Abcam, USA), then sections were incubated with secondary antibodies and stained with DAB. Cells positive for CD163 were stained with yellow or brown granules in the cytoplasm or membrane. The protein Foxp3 showed most staining in the nucleus of T cells. Five high-power fields (HPF) were randomly selected, the number of positive cells were counted, and the data expressed as the mean of those 5 fields.
Human monocytes isolation
PBMC (peripheral blood mononuclear cell) were purified from fresh human blood by gradient centrifugation using Ficoll-Paque (HY biological manufacture, China). Then PBMC were seeded on plastic adherence culture dishes (Corning, USA) in RPMI medium containing 10% FBS for at least 4 hours to collect adherent monocytes. Monocytes were cultured at concentration of 1×10⁶/mL in RPMI 1640 medium (Hyclone), supplemented with 10% FBS.
Co-culture of tumor cells with monocytes
Freshly isolated human monocytes were seeded at concentration of 1×10⁶/mL and cultured with 10 ng/ml GM-CSF for 4 days, and human monocytes were observed to develop into M0 macrophage. M0 macrophage was co-cultured with NPC cell lines (5-8F, CNE1, and CNE2) or NP69, for another 2 days. Then, macrophage was harvested and flow cytometry was used to detect the percentage of M2 macrophage.
Flow cytometry
Flow cytometry was used to detect the percentage of M2 macrophage and Treg. Single cell suspensions were prepared after washing with cold PBS for 3 times. Cells were stained with monoclonal antibodies and analyzed with a flow cytometer (Becton, Dickinson and Company, USA). Antibodies used in our experiment including anti-human CD68-APC (ebioscience, USA), anti-human CD163-APC (ebioscience, USA), anti-human CD4-FITC (ebioscience, USA) and anti-human Foxp3-PE (ebioscience, USA).
Treg isolation
Purified human PBMC were seeded on plastic adherence culture dishes in RPMI medium containing 10% FBS, to deplete monocytes. Different T cell subsets were then isolated by magnetic activated cell sorting (MACS). First, CD4+ T cells were separated by negative isolation by LD column, and then CD4+CD25+ T cells were isolated by MS column according to the instructions of the human CD4+CD25+ Regulatory T Cell Isolation Kit (Miltenyi Biotec, Germany).
Chemotaxis assay
Transwell plates, 5 μm pore size (Corning Costar, USA) were used to measure the migration of purified Treg to the supernatant of NPC cells. In the upper chamber, we seeded 1×10⁴ Tregs and cultured with the supernatant of M2 macrophage or M0 macrophage. Migrated cells in the lower chamber were counted.
Statistical analysis
Two-tailed Student’s t test was used for comparison of 2 independent groups. A One-way ANOVA analysis of variance was used to compare multiple groups. Correlation of positive cells of CD163+ M2 macrophage and Foxp3+ Treg in NPC were compared using Spearman correlation analysis. The data are shown as the mean ± SEM unless otherwise noted. Survival curves were plotted by the Kaplan-Meier method and compared by the log-rank test. All statistical analyses were performed using the SPSS 21.0 statistical software package (SPSS, Chicago). P values <0.05 were considered to be statistically significant.
Results
A substantial population of M2 macrophage infiltrated in NPC
We studied 61 tumor tissues from patients with untreated NPC and nasopharyngeal tissues from patients with chronic nasopharyngitis (n=40). The marker of M2 macrophage, CD163, was mainly stained in the cytomembrane and cytoplasm (yellow or brown) and M2 macrophage were detected both in chronic nasopharyngitis and NPC tissues. In NPC, M2 macrophage was mainly distributed in the vicinity of tumors islets. We found a substantial number of CD163+ cells (73.1±37.4) in NPC (Figure 1B, 1C) and a small number in chronic nasopharyngitis (35.2±23.7) (Figure 1A). The number of M2 macrophage in NPC tissues was significantly higher than that in chronic nasopharyngitis (Figure 1G). In addition, there were more M2 macrophage in patients with late stage tumors (stage III and IV, n=47, 79.6±36.6) than those in early stage (stage I and II, n=14, 51.5±32.9) (Figure 1H). The clinicopathological characteristics of NPC patients in early stage and late stage are shown in Table 2.
Figure 1.
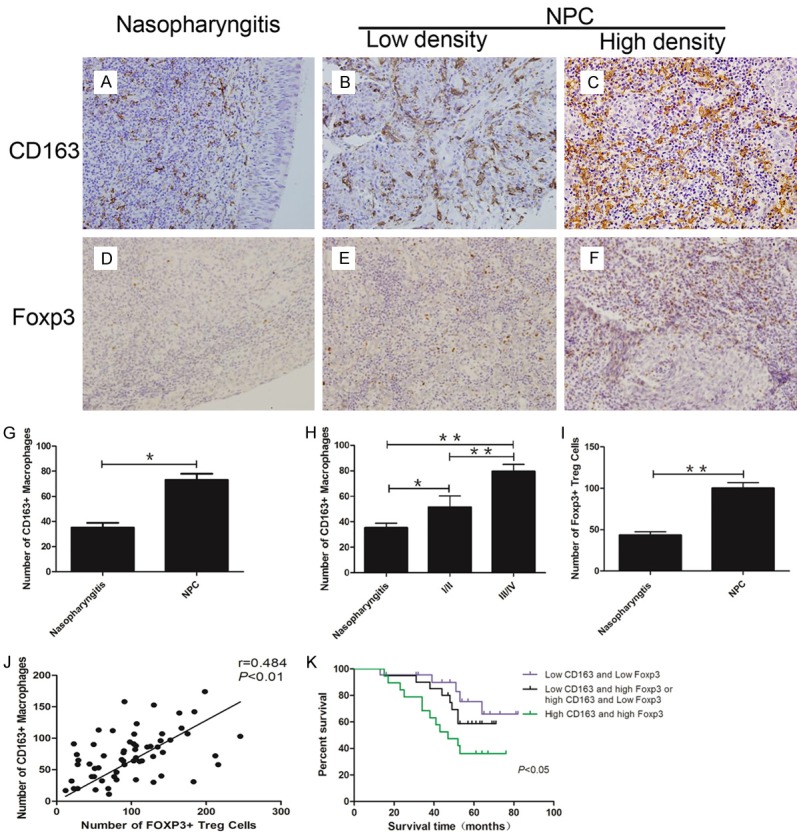
Aberrantly increased M2 macrophage and Treg predicted poor survival of NPC patients. A: CD163+ M2 macrophage infiltrated in chronic nasopharyngitis; B: Low density of CD163+ M2 macrophage in NPC tissues; C: High density of CD163+ M2 macrophage in NPC tissues; D: Foxp3+ Treg infiltrated in chronic nasopharyngitis; E: Low density of Foxp3+ Treg in NPC tissues; F: High density of Foxp3+ Treg in NPC tissues; G: The number of M2 macrophage in NPC is significantly higher than in chronic nasopharyngitis; H: More M2 macrophage infiltrated in late stage of NPC; I: The number of Treg in NPC is significantly higher than in chronic nasopharyngitis; J: Aberrantly increased infiltrated M2 macrophage had positive correlation with Treg; K: High density CD163+ M2 macrophage and high density Foxp3+ Treg group had poor survival. *P<0.05, **P<0.01.
Table 2.
The clinicopathological characteristics of NPC patients in early stage and late stage
| Early stage (I/II) | Late stage (III/IV) | P Value | |
|---|---|---|---|
| Age (years) | |||
| <45 | 9 | 19 | 0.1847 |
| ≥45 | 5 | 28 | |
| Sex | |||
| Male | 12 | 37 | 0.8457 |
| Female | 2 | 10 | |
| Cigarette Smoking | |||
| Yes | 7 | 21 | 0.1596 |
| No | 7 | 26 | |
| Alcohol Intake | |||
| Yes | 4 | 12 | 0.9502 |
| No | 10 | 35 | |
| Histological Subtype | |||
| Differentiated nonkeratinizing carcinoma + squamous cell carcinoma | 2 | 3 | 0.6956 |
| Undifferentiated nonkeratinizing carcinoma | 12 | 44 | |
| T Status | |||
| T1 | 4 | 6 | 0.0001 |
| T2 | 10 | 8 | |
| T3 | 0 | 16 | |
| T4 | 0 | 17 | |
| N Status | |||
| N0 | 2 | 3 | 0.0081 |
| N1 | 12 | 20 | |
| N2 | 0 | 17 | |
| N3 | 0 | 7 | |
| EBV-DNA | |||
| Positive | 7 | 35 | 0.1596 |
| Negative | 7 | 12 | |
| EBV-IgA | |||
| Positive | 4 | 13 | 0.785 |
| Negative | 10 | 34 |
M2 macrophage and aberrantly increased infiltrating Treg predict poor outcome of NPC patients
We tested the number of Treg, the core cell of immunosuppression, in NPC. We stained the 61 tissues from patients with NPC and 40 tissues from patients with chronic nasopharyngitis tissues for detection of Foxp3 to determine the number of Treg. Foxp3+ Treg was detected both in NPC tissues (Figure 1E, 1F) and in chronic nasopharyngitis tissues (Figure 1D). In NPC, Foxp3 mainly stained in the vicinity of tumor islets (Figure 1E, 1F). The number of Treg aberrantly increased in NPC tissues (100±53.8) compared with chronic nasopharyngitis tissues (43.4±25.4) (P<0.01) (Figure 1I). Moreover, the number of infiltrated CD163+ M2 macrophage had a positive correlation with infiltrated Foxp3+ Treg (Figure 1J) (P<0.01, r=0.484). We then ascertained whether these two immunological factors could contribute to the outcome of the NPC patients or not. Kaplan-Meier survival analysis was used to detect the combined prediction of CD163+ M2 macrophage and Foxp3+ Treg. The results indicated that the overall survival time was significantly shorter in the high density CD163+ M2 macrophage and high density Foxp3+ Treg group (Figure 1K) (P<0.05).
Tumor cells induced monocyte into M2 macrophage
The shape of freshly isolated human monocyte was round and small (Figure 2A). After been cultured with 10 ng/ml GM-CSF for 4 days, the cell became bigger and irregular (Figure 2B). Flow cytometry was used to detect the percent of CD68+ M0 macrophage. The results showed that GM-CSF treated monocyte developed into CD68+ M0 macrophage (90.8%) (Figure 2F).
Figure 2.

NPC cells induced macrophage into M2 macrophage. A: Shape of human monocyte; B: Shape of polarized-M0 macrophage; C: Shape of tumor induced M2 macrophage; D-F: GM-CSF induced monocytes into M0 macrophage; G: Co-cultured with NP69 resulted percent of M2 macrophage only 45%; H: Co-cultured with NPC cell lines the percent of M2 macrophage can be 80.3%; I: Tumor cell lines induced higher percent of M2 macrophage compared NP69 group. *P<0.05, **P<0.01.
M0 macrophage was co-cultured with NPC cell lines (5-8F, CNE1, and CNE2) or NP69, for another 2 days. The morphology of co-cultured with NPC cell lines macrophage showed more irregular shape and increased pseudopodia (Figure 2C) compared with M0 macrophage (Figure 2B). Then, macrophage was harvested and flow cytometry was used to detect the percentage of M2 macrophage. The percentage of M2 macrophage in groups co-cultured with NPC cells (80.6%±6.2%) was significantly higher than those co-cultured with NP69 (45.1%±8.6%) (Figure 2I).
TGF-β1 and IL-10 increased in NPC cell lines and tissues
The expressions of CCL2, CSF1, IL-10, IL-4, and TGF-β1, which can polarize monocyte into M2 macrophage, were detected in NPC cell lines (5-8F, CNE1, and CNE2) and NP69. IL-4 was overexpressed in 5-8F and CNE2, but expressed at a low level in CNE1 compared with NP69 (Figure 3A). Low levels of CCL2 and CSF1 were expressed in all 3 NPC cell lines (Figure 3B, 3C). However, expression levels of IL-10 and TGF-β1 were elevated in all 3 NPC cells compared with NP69 (Figure 3D, 3E).
Figure 3.

TGF-β1 and IL-10 increased in NPC cell lines and tissues. A: IL-4 was overexpressed in 5-8F and CNE2, but expressed at low levels in CNE1 compared with NP69; B: CCL2 expressed at low levels in all 3 NPC cell lines; C: CSF1 expressed at low levels in all 3 NPC cell lines; D: Expression of TGF-β1 elevated in all 3 NPC cells; E: IL-10 expressed high level in all 3 NPC cell lines; F: The level of IL-10 was higher in NPC tissues; G: TGF-β1 overexpressed in NPC tissues. *P<0.05.
Next, we tested the expression of IL-10 and TGF-β1 in tissues from patients with NPC and chronic nasopharyngitis. RNA was extracted from 50 NPC tissues and 30 chronic nasopharyngitis tissues, qPCR was used to detect the expression of IL-10 and TGF-β1. The level of IL-10 was higher in NPC tissues than in chronic nasopharyngitis tissues (Figure 3F). Similar result was found in the expression of TGF-β1 (Figure 3G).
Tumor cells induced-M2 macrophage caused the accumulation of Treg by inducing conversion and chemotaxis
To explain the relationship of M2 macrophage and Treg, we co-cultured M2 macrophage or M0 macrophage with human PBMC for 6 days. Flow cytometry was used to examine the percentage of CD4+Foxp3+ Treg. The percentage of CD4+Foxp3+ Treg in the M2 macrophage group (Figure 4B) (8.0%±0.45%) was significantly increased compared with the M0 macrophage group (Figure 4A) (4.6%±0.36%) (P<0.01) (Figure 4C). Expression of TGF-β1 and IL-2, which can induce the conversion of naive T cells to Treg, were increased (Figure 4D) in M2 macrophage.
Figure 4.

M2 macrophage recruited Treg via induced conversion and chemotaxis. A: Percent of CD4+Foxp3+ Treg was only 5% in co-cultured with M0 macrophage; B: Percent of CD4+Foxp3+ Treg was 7.8% in co-cultured with M2 macrophage; C: Statistical analysis showed M2 macrophage group had higher percent of CD4+Foxp3+ Treg; D: TGF-β1 and IL-2 overexpressed in M2 macrophage; E, F: Purity of MACS isolated Treg reached 80.6%; G: M0 supernatant induced migrated Treg in one high power field (×400); H: M2 supernatant induced migrated Treg in one high power field (×400); I: The number of migrated Treg significantly increased in M2 macrophage supernatant. **P<0.01.
We also performed an experiment to demonstrate the chemotaxis of Treg. The purity of Isolated CD4+CD25+ Treg from human PBMC was observed to reach 80% (Figure 4E, 4F). We seeded 1×10⁴ Treg in the upper chamber of a transwell, and added supernatant of M2 macrophage or M0 macrophage to the lower chamber. The number of migrated Treg were counted using microscopy. The number of migrated Treg in M2 supernatant (Figure 4G) was two folds of in M0 supernatant (Figure 4H). The number of migrating Treg in M2 supernatant was 594.0±53.1, and only 248.7±28.0 in the M0 supernatant (Figure 4I) (P<0.01).
Discussion
In this study, we firstly demonstrated that NPC cells can induce monocyte to be polarized into M2 macrophage by TGF-β1 and IL-10, and that polarized-M2 macrophage could accumulate Treg by inducing conversion and chemotaxis. Infiltrating immune cells are a hallmark of most malignant tumors. In the tumor microenvironment, TAM regulates the interaction of the immune system and cancer. At the same time, TAM was shaped by tumor cells to promote tumor progression, invasion, and metastasis [18-20]. This type of TAM was mainly identified as CD163+ M2 macrophage [21]. But there were few studies concerning the function of M2 macrophage in tumor immunosuppression in NPC. In this study, we stained 61 tissues from NPC patients and 40 nasopharynx tissues from patients with chronic nasopharyngitis and compared the number of CD163+ M2 macrophage in NPC and chronic nasopharyngitis. The results showed that M2 macrophage aberrantly increased in NPC, and higher density in the late stage of NPC. These results suggested that M2 macrophage play an important role in NPC progression.
More than a decade ago, Treg were recognized as a core component of immunosuppression and suppressed cytotoxic T cells in many tumors [22]. In this study, we stained 61 tissues from patients with NPC and 40 nasopharynx tissues from patients with chronic nasopharyngitis for Foxp3+ Treg. These Foxp3+ Treg were found both in NPC and chronic nasopharyngitis tissues. In addition, a large number of Foxp3+ Treg infiltrated in NPC tissues. This indicated in NPC immunosuppression was stronger than in nasopharyngitis. Over the past few years, several studies focused on the interaction of macrophage and Treg. However, there were no reports concerning the relationship between Treg and M2 macrophage in NPC. We analyzed the number of M2 macrophage and Treg, and found a positive correlation between these two cell types. We combined these two type of cells for Survival analysis. The patients were divided into three groups: low density CD163 and low density Foxp3; low density CD163 and high density Foxp3 or high density CD163 and low density Foxp3; high density CD163 and high density Foxp3. The results showed high density CD163 and high density Foxp3 group had the worst overall survival.
The M2 macrophage was differentiated cells of the mononuclear phagocytic lineage. Blood monocyte was recruited to tumors sites by chemokine CCL2, and these monocytes can polarize to M2 macrophage via some cytokines such as CSF1, TGF-β, IL-10 and IL-4 [23,24]. Tumor cells were reported to polarize M2 macrophage in many different cancers, while no such reports in NPC. In this study, the expression of chemokine CCL2 was tested in NPC cells. In spite of being over-expressed in a variety of tumors and associated with a poor prognosis in patients with breast, colorectal, and thyroid cancers [7,25], in NPC cell lines CCL2 had a lower expression compared with NP69. In addition, IL-4, which was reported to polarize M2 macrophage, also had low expression in NPC cell lines. Another cytokine CSF1 can polarize M2 macrophage and is often produced high levels in breast cancer; however it is not as frequently over-expressed in pancreatic cancer cells [26]. The expression level of CSF1 is not increased in NPC cell lines. It had been reported that TGF-β1, as well as IL-10, can be produced by a variety of malignant tumors and were able to modulate the maturation of M2 macrophage in many other tumors [27,28]. In this study, both TGF-β1 and IL-10 were highly expressed in NPC cell lines, and the same observation was found in NPC tissues. These results indicated NPC tumor cells polarized M2 macrophage via TGF-β1 and IL-10.
In the context of the tumor, M2 macrophage had been characterized as inhibitors of T-cell activation, by secreting suppressive mediators, such as TGF-β, IL-10, and indoleamine 2,3-dioxygenase [29]. The early differentiation of Treg from naive T cells requires TGF-β and IL-2, and M2 macrophage as well as tumor cell, are a major source of TGF-β [30]. Angelika Schmidt et al. reported that human M2 macrophage induced CD4+Foxp3+ Treg via the release of TGF-β1 [31]. In our study, we co-cultured PBMC with tumor cell induced-M2 macrophage for 6 days, and found the percentage of CD4+Foxp3+ Treg increased nearly 2-fold compared with M0 macrophage. Polarized-M2 macrophage increased the percentage of CD4+Foxp3+ Treg. The levels of TGF-β1 and IL-2 increased 4-fold and 3-fold in M2 macrophage, respectively, compared with M0 macrophage. This indicated that M2 macrophage induced the conversion of Treg may through TGF-β and IL-2. Another way that M2 macrophage could recruit Treg is chemotaxis via chemokines such as CCL22, CCL17, CXCL12 [32]. In the chemotaxis experiment, supernatant from M2 macrophage significantly increased migration of Treg. But the effect of which chemokines on the chemotaxis of Treg in NPC needs to further investigation. M2 macrophage recruited Treg led to tumor immune escape. Besides, Treg can profoundly affect macrophage function. Human monocyte cultured in the presence of CD4+Foxp3+ Treg could differentiate into M2 macrophage via Treg secreted TGF-β1 and IL-10 [33]. Thus, the interaction of M2 macrophage and Treg forms a positive feedback loop that favors tumor immune escape.
In conclusion, we described the interactions of 3 types of cells: NPC cells, M2 macrophage and Treg. Tumor cells induced monocyte polarized into M2 macrophage via TGF-β1 and IL-10, and the polarized-M2 macrophage recruited Treg to favor tumor immune escape. M2 macrophage is likely to be a therapeutic target of NPC.
Acknowledgements
The study was supported by a Grant from the National Natural Science Foundation of China (Grants 81472535).
Disclosure of conflict of interest
None.
References
- 1.Panni RZ, Linehan DC, DeNardo DG. Targeting tumor-infiltrating macrophages to combat cancer. Immunotherapy. 2013;5:1075–1087. doi: 10.2217/imt.13.102. [DOI] [PMC free article] [PubMed] [Google Scholar]
- 2.Qian BZ, Li J, Zhang H, Kitamura T, Zhang J, Campion LR, Kaiser EA, Snyder LA, Pollard JW. CCL2 recruits inflammatory monocytes to facilitate breast-tumour metastasis. Nature. 2011;475:222–225. doi: 10.1038/nature10138. [DOI] [PMC free article] [PubMed] [Google Scholar]
- 3.Zhu H, Hui L, Shen Z, Hu X, Sun L, Zhu X. Transforming growth factor-β1 in carcinogenesis, progression, and therapy in cervical cancer. Tumor Biol. 2016;37:7075–7083. doi: 10.1007/s13277-016-5028-8. [DOI] [PubMed] [Google Scholar]
- 4.Pedraza-Brindis EJ, Sánchez-Reyes K, Hernández-Flores G, Bravo-Cuellar A, Jave-Suárez LF, Aguilar-Lemarroy A, Gómez-Lomelí P, López-López BA, Ortiz-Lazareno PC. Culture supernatants of cervical cancer cells induce an M2 phenotypic profile in THP-1 macrophages. Cell Immunol. 2016;310:42. doi: 10.1016/j.cellimm.2016.07.001. [DOI] [PubMed] [Google Scholar]
- 5.Kang FB, Wang L, Li D, Zhang YG, Sun DX. Hepatocellular carcinomas promote tumor-associated macrophage M2-polarization via increased B7-H3 expression. Oncol Rep. 2015;33:274. doi: 10.3892/or.2014.3587. [DOI] [PubMed] [Google Scholar]
- 6.Santoni M, Massari F, Amantini C, Nabissi M, Maines F, Burattini L, Berardi R, Santoni G, Montironi R, Tortora G. Emerging role of tumor-associated macrophages as therapeutic targets in patients with metastatic renal cell carcinoma. Cancer Immunol Immunother. 2013;62:1757–1768. doi: 10.1007/s00262-013-1487-6. [DOI] [PMC free article] [PubMed] [Google Scholar]
- 7.Qian BZ, Pollard JW. Macrophage diversity enhances tumor progression and metastasis. Cell. 2010;141:39–51. doi: 10.1016/j.cell.2010.03.014. [DOI] [PMC free article] [PubMed] [Google Scholar]
- 8.Colegio OR, Chu NQ, Szabo AL, Chu T, Rhebergen AM, Jairam V, Cyrus N, Brokowski CE, Eisenbarth SC, Phillips GM. Functional polarization of tumour-associated macrophages by tumour-derived lactic acid. Nature. 2014;513:559–563. doi: 10.1038/nature13490. [DOI] [PMC free article] [PubMed] [Google Scholar]
- 9.Kai K, Plaks V, Werb Z. Matrix Metalloproteinases: regulators of the tumor microenvironment. Cell. 2010;141:52–67. doi: 10.1016/j.cell.2010.03.015. [DOI] [PMC free article] [PubMed] [Google Scholar]
- 10.Zhang T, Ma Z, Wang R, Wang Y, Wang S, Cheng Z, Xu H, Jin X, Li W, Wang X. Thrombin facilitates invasion of ovarian cancer along peritoneum by inducing monocyte differentiation toward tumor-associated macrophage-like cells. Cancer Immunol Immunother. 2010;59:1097–1108. doi: 10.1007/s00262-010-0836-y. [DOI] [PMC free article] [PubMed] [Google Scholar]
- 11.Chen J, Li G, Meng H, Fan Y, Song Y, Wang S, Zhu F, Guo C, Zhang L, Shi Y. Upregulation of B7-H1 expression is associated with macrophage infiltration in hepatocellular carcinomas. Cancer Immunol Immunother. 2012;61:101–108. doi: 10.1007/s00262-011-1094-3. [DOI] [PMC free article] [PubMed] [Google Scholar]
- 12.Mantovani A, Sozzani S, Locati M, Allavena P, Sica A. Macrophage polarization: tumorassociated macrophages as a paradigm for polarized M2 mononuclear phagocytes. Trends Immunol. 2002;23:549. doi: 10.1016/s1471-4906(02)02302-5. [DOI] [PubMed] [Google Scholar]
- 13.Coe D, Begom S, Addey C, White M, Dyson J, Chai J. Depletion of regulatory T cells by anti-GITR mAb as a novel mechanism for cancer immunotherapy. Cancer Immunol Immunother. 2010;59:1367–1377. doi: 10.1007/s00262-010-0866-5. [DOI] [PMC free article] [PubMed] [Google Scholar]
- 14.Mantovani A. From phagocyte diversity and activation to probiotics: back to Metchnikoff. Eur J Immunol. 2008;38:3269–3273. doi: 10.1002/eji.200838918. [DOI] [PubMed] [Google Scholar]
- 15.Curiel TJ, Coukos G, Zou L, Alvarez X, Cheng P, Mottram P, Evdemonhogan M, Conejogarcia JR, Zhang L, Burow M. Specific recruitment of regulatory T cells in ovarian carcinoma fosters immune privilege and predicts reduced survival. Nat Med. 2004;10:942–949. doi: 10.1038/nm1093. [DOI] [PubMed] [Google Scholar]
- 16.Yamagiwa S, Gray JD, Hashimoto S, Horwitz DA. A role for TGF-beta in the generation and expansion of CD4+CD25+ regulatory T cells from human peripheral blood. J Immunol. 2001;166:7282–7289. doi: 10.4049/jimmunol.166.12.7282. [DOI] [PubMed] [Google Scholar]
- 17.Mantovani A, Sozzani S, Locati M, Allavena P, Sica A. Macrophage polarization: tumorassociated macrophages as a paradigm for polarized M2 mononuclear phagocytes. Trends Immunol. 2002;23:549–555. doi: 10.1016/s1471-4906(02)02302-5. [DOI] [PubMed] [Google Scholar]
- 18.Miao H, Ou J, Peng Y, Zhang X, Chen Y, Hao L, Xie G, Wang Z, Pang X, Ruan Z, Li J, Yu L, Xue B, Shi H, Shi C, Liang H. Macrophage ABHD5 promotes colorectal cancer growth by suppressing spermidine production by SRM. Nat Commun. 2016;7:11716. doi: 10.1038/ncomms11716. [DOI] [PMC free article] [PubMed] [Google Scholar]
- 19.Yang Y, Patrik A, Kayoko H, Zhang Y, Cao R, Hideki I, Yang X, Masaki N, Wang J, Zhuang R. The PDGF-BB-SOX7 axis-modulated IL-33 in pericytes and stromal cells promotes metastasis through tumour-associated macrophages. Nat Commun. 2016;7:11385. doi: 10.1038/ncomms11385. [DOI] [PMC free article] [PubMed] [Google Scholar]
- 20.Yin M, Li X, Tan S, Zhou HJ, Ji W, Bellone S, Xu X, Zhang H, Santin AD, Lou G. Tumor-associated macrophages drive spheroid formation during early transcoelomic metastasis of ovarian cancer. J Clin Invest. 2016;126:4157. doi: 10.1172/JCI87252. [DOI] [PMC free article] [PubMed] [Google Scholar]
- 21.Biswas SK, Mantovani A. Macrophage plasticity and interaction with lymphocyte subsets: cancer as a paradigm. Nat Immunol. 2010;11:889–896. doi: 10.1038/ni.1937. [DOI] [PubMed] [Google Scholar]
- 22.Nizar S, Meyer B, Galustian C, Kumar D, Dalgleish A. T regulatory cells, the evolution of targeted immunotherapy. Biochim Biophys Acta. 2010;1806:7–17. doi: 10.1016/j.bbcan.2010.02.001. [DOI] [PubMed] [Google Scholar]
- 23.Colegio OR, Chu NQ, Szabo AL, Chu T, Rhebergen AM, Jairam V, Cyrus N, Brokowski CE, Eisenbarth SC, Phillips GM. Functional polarization of tumour-associated macrophages by tumour-derived lactic acid. Nature. 2014;513:559–563. doi: 10.1038/nature13490. [DOI] [PMC free article] [PubMed] [Google Scholar]
- 24.Mantovani A, Sica A, Sozzani S, Allavena P, Vecchi A, Locati M. The chemokine system in diverse forms of macrophage activation and polarization. Trends Immunol. 2004;25:677–686. doi: 10.1016/j.it.2004.09.015. [DOI] [PubMed] [Google Scholar]
- 25.Mantovani A, Sica A. Macrophages, innate immunity and cancer: balance, tolerance, and diversity. Curr Opin Immunol. 2010;22:231. doi: 10.1016/j.coi.2010.01.009. [DOI] [PubMed] [Google Scholar]
- 26.Panni RZ, Linehan DC, DeNardo DG. Targeting tumor-infiltrating macrophages to combat cancer. Immunotherapy. 2013;5:1075–1087. doi: 10.2217/imt.13.102. [DOI] [PMC free article] [PubMed] [Google Scholar]
- 27.Sica A, Saccani A, Bottazzi B, Polentarutti N, Vecchi A, Van DJ, Mantovani A. Autocrine production of IL-10 mediates defective IL-12 production and NF-kappa B activation in tumor-associated macrophages. J Immunol. 2000;164:762–767. doi: 10.4049/jimmunol.164.2.762. [DOI] [PubMed] [Google Scholar]
- 28.Yang P, Li Q, Feng Y, Zhang Y, Markowitz GJ, Ning S, Deng Y, Zhao J, Jiang S, Yuan Y, Wang H, Cheng S, Xie D, Wang X. TGF-β-miR-34a-CCL22 signaling-induced Treg cell recruitment promotes venous metastases of HBV-positive hepatocellular carcinoma. Cancer Cell. 2012;22:291–303. doi: 10.1016/j.ccr.2012.07.023. [DOI] [PMC free article] [PubMed] [Google Scholar]
- 29.Erreni M, Mantovani A, Allavena P. Tumorassociated macrophages (TAM) and inflammation in colorectal cancer. Cancer Microenviron. 2011;4:141–154. doi: 10.1007/s12307-010-0052-5. [DOI] [PMC free article] [PubMed] [Google Scholar]
- 30.Savage ND, De BT, Walburg KV, Joosten SA, Van MK, Geluk A, Ottenhoff TH. Human anti-inflammatory macrophages induce Foxp3+GITR+CD25+ regulatory T cells, which suppress via membrane-bound TGFbeta-1. J Immunol (Baltimore, Md.: 1950) 2008;181:2220–2226. doi: 10.4049/jimmunol.181.3.2220. [DOI] [PubMed] [Google Scholar]
- 31.Schmidt A, Zhang XM, Joshi RN, Iqbal S, Wahlund C, Gabrielsson S, Harris RA, Tegnér J. Human macrophages induce CD4(+)Foxp3(+) regulatory T cells via binding and re-release of TGF-β. Immunol Cell Biol. 2016;94:747. doi: 10.1038/icb.2016.34. [DOI] [PubMed] [Google Scholar]
- 32.Chang AL, Miska J, Wainwright DA, Dey M, Rivetta CV, Yu D, Kanojia D, Pituch KC, Qiao J, Pytel P. CCL2 produced by the glioma microenvironment is essential for the recruitment of regulatory T cells and myeloid-derived suppressor cells. Cancer Res. 2016;76:5671–5682. doi: 10.1158/0008-5472.CAN-16-0144. [DOI] [PMC free article] [PubMed] [Google Scholar]
- 33.Tiemessen MM, Jagger AL, Evans HG, van Herwijnen MJ, John S, Taams LS. CD4+ CD25+Foxp3+ regulatory T cells induce alternative activation of human monocytes/macrophages. Proc Natl Acad Sci U S A. 2007;104:19446–19451. doi: 10.1073/pnas.0706832104. [DOI] [PMC free article] [PubMed] [Google Scholar]