Abstract
Objective: to explore clinical value and potential targets of MicroRNA-224-5p in the tumorigenesis and progression of hepatocellular carcinoma (HCC). Methods: We evaluated the clinical value of MicroRNA-224-5p from The Cancer Genome Atlas (TCGA) and Gene Expression Omnibus (GEO). Meanwhile, target genes of MicroRNA-224-5p were predicted by bioinformatics method. The target genes of MicroRNA-224-5p were finally analyzed in Gene Ontology (GO) terms, Kyoto Encyclopedia of Genes and Genomes (KEGG) pathway annotation, and Protein-Protein Interaction (PPI) network annotation. Results: MicroRNA-224-5p expression level in HCC was higher than in non-tumor tissues (SMD=1.24; 95% CI, 0.68 to 1.81; P<0.0001) and MicroRNA-224-5p might represent a diagnostic marker (overall AUC=0.92; 95% CI, 0.90 to 0.94). 262 target genes were acquired by overlapping 4927 genes predicted by more than four computational prediction tools with 1,123 down-regulated DEGs in HCC. Furthermore, gene sets enrichment analysis of the 262 overlapping genes was implemented. The mostly significant GO terms within the overlapping target genes of MicroRNA-224-5p were cellular response to chemical stimulus, plasma membrane part and coenzyme binding. KEGG pathway annotation showed the overlapping genes mostly took part in metabolic pathways. In PPI analysis, one hub gene, GNA14, stood out cause for the significant negative correlation with MicroRNA-224. Conclusion: MicroRNA-224-5p is upregulated in HCC and may be a prospective biomarker for diagnosis. Moreover, MicroRNA-224-5p might play an oncogenic role in HCC by targeting GNA14.
Keywords: Hepatocellular carcinoma, gene targeting, bioinformatics, microRNAs
Introduction
Hepatocellular carcinoma (HCC) is one of the most frequent malignant tumors worldwide. Many global studies have focused on the diagnosis and treatment of HCC. Nevertheless, its prognosis is still poor owing to a series of reasons, such as growing incidence, late diagnosis, persistent drug resistance and repeated recurrence. Thus, it is urgent to discover novel and valuable diagnostic and prognostic biomarkers for HCC [1-6].
MicroRNAs (miRNAs) are classified as endogenous ~22 nucleotides RNAs, suppressing mRNA-protein translation or promoting mRNA degradation. The miRNAs have vital characters in various biological processes, such as cell survival, cell apoptosis, cell metastasis, cell proliferation, cell migration and cell invasion [7-13]. MicroRNA-224 (miR-224) has been found to participate in many biological processes of many malignancies, such as ovarian cancer [14], cervical cancer [15], breast cancer [16], gastric cancer [17], osteosarcoma [18], colorectal cancer [19], lung cancer [20], diffuse large B-cell lymphoma [21], esophageal squamous cell carcinoma [22], meningioma [23], glioma [24], prostate cancer [25], and renal cancer [26]. Meanwhile, several studies demonstrated that miR-224 has correlations with carcinogenesis and disease progression of HCC. For example, Scisciani et al identified the mature miR-224 levels significantly upregulated in human HCCs by RT-PCR [27]. Li et al found miR-224 participated in a series of signaling pathways and contributed to the regulation of HCC invasion and migration [28]. However, reliability of previous studies that evaluating miR-224 roles in HCC was limited by small sample sizes to some extent. Therefore, a comprehensive analysis of clinical value, target genes and pathways of miR-224 in HCC is necessary.
We acquired the expression and clinicopathological characteristics data of miR-224-5p from The Cancer Genome Atlas (TCGA) and Gene Expression Omnibus (GEO), analyzing the expression and clinicopathological characteristics of miR-224-5p in HCC, and also performing the Receiver Operating Characteristic (ROC) curves of each dataset. Then, we implemented a comprehensive meta-analysis to assess the expression tendency and the diagnostic value of miR-224-5p. Next, we predicted the target genes of miR-224-5p through 12 miRNA computational prediction tools, and then overlapped with the down-regulated differentially expressed genes (DEGs) in HCC based on TCGA data. Finally, Gene Ontology (GO) terms annotation, Kyoto Encyclopedia of Genes and Genomes (KEGG) pathway annotation and Protein-Protein Interaction (PPI) network annotation were commenced to discover the function of the overlapping genes. Overall, the objective of this study was to evaluate clinical value and potential targets of miR-224-5p in the tumorigenesis and progression of HCC, providing advices for subsequent study of miR-224-5p in HCC (Figure 1).
Figure 1.
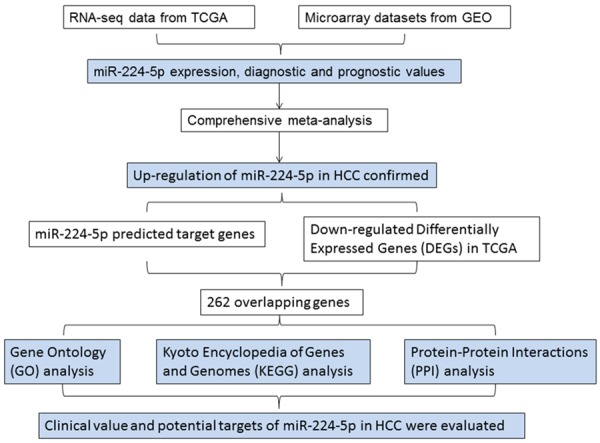
General flow chart presenting the design conception in this study.
Materials and methods
TCGA RNA-seq data in HCC patients
The expression and clinicopathological characteristics data of miR-224 were acquired from TCGA (http://cancergenome.nih.gov/; 2016), including 364 HCC patients and 50 normal samples. Down-regulated DEGs between the expression profiles of 364 HCC tissues and 50 non-tumor tissues were obtained by performing limma package of R (https://www.r-project.org/). When log2 fold change (FC) <-1 with the P value <0.05 in Student’s t-test, gene down-regulated expression difference would be considered as statistically significant.
GEO microarray datasets acquisition
The available data on miR-224-5p expression were obtained from GEO (http://www.ncbi.nlm.nih.gov/geo/). The search strategy that used in GEO datasets was as follows: (hepatocellular OR liver OR hepatic OR HCC) AND (miRNA OR microRNA). The inclusion criteria of the included microarray datasets were: (1) samples within the cancer group were diagnosed as HCC; (2) each microarray included both HCC group and noncancerous group; (3) expression profiling data of miR-224-5p were provided; (4) the species in the microarrays were humans. While the exclusion criteria included: (1) microarrays without available data of miR-224-5p; (2) microarrays without normal controls; (3) the species in the microarrays were animals.
Potential target genes of miR-224-5p
We applied 12 computational prediction tools, including miRWalk, Microt4, miRanda, mirbridge, miRDB, miRMap, miRNAMap, Pictar2, PITA, RNA22, RNAhybrid, and Targetscan, to get predicted target genes of miR-224-5p. Only genes that were simultaneously predicted by four or more than four computational prediction tools were selected. Subsequently, we acquired the extracted genes by overlapping the predicted target genes and the down-regulated DEGs in HCC.
Functional and pathway enrichment analysis
The Database for Annotation, Visualization and Integrated Discovery (DAVID; https://david.ncifcrf.gov/) is a public database providing functional and pathway enrichment analysis of massive gene lists. We used DAVID to perform GO enrichment analysis and KEGG pathway enrichment analysis of the extracted target genes of miR-224-5p. Only a P-value <0.05 of the terms were selected for analysis. The GO functional network graphs, including molecular function (MF), cellular component (CC), and biological process (BP), was further visualized with Cytoscape 3.2.1 (http://cytoscape.org/). The KEGG enrichment result was visualized by ggplot2 package of R (https://www.r-project.org/).
PPI network construction
Search Tool for the Retrieval of Interacting Genes/Proteins (STRING; http://string-db.org/) is a biological database and web resource of known and predicted PPI. The latest version 10.0 was used to construct PPI network of proteins encoded by the overlapping miR-224-5p target genes. The PPI data were downloaded from STRING database and a confidence score >0.7 were selected as inclusion criteria. At PPI network analysis, the nodes represent proteins, and the lines represent the interactions of proteins. When a node was associated with more than 5 other nodes within the inclusion criteria, it was defined as a hub gene in our study. We downloaded data from STRING and analyzed the association between all nodes in PPI network and got the hub genes.
Statistical analysis
Student’s T test which calculated the significant difference between HCC and noncancerous tissues and the scatter plots that exhibited the expression level of miR-224-5p in HCC were both conducted by GraphPad Prism Version 5.0 (GraphPad Software, San Diego CA, USA; https://www.graphpad.com). The Kaplan-Meier survival curve of miR-224 in HCC was also performed by GraphPad Prism Version 5.0.
Standard mean differences (SMDs) with 95% confidence interval (CI) were pooled to esti-mate the expression level of miR-224-5p in HCC. Heterogeneity in the meta-analysis were assessed by chi-square (x2) test of Q and inconsistency index (I2), and a P value <0.05 or I2 >50% was considered to be significantly heterogeneous and a random-effects model was applied. If a P value >0.05 or I2<50%, the fixed-effects model was selected. Forest plots of miR-224-5p expression were conducted using Review Manager Version 5.3 (The Nordic Cochrane Centre, Copenhagen, Denmark; http://community.cochrane.org/tools/review-production-tools/revman-5). We performed a sensitivity analysis to evaluate the stability of the results through deleting studies one by one and comparing the pooled results of different models. Publication bias was assessed by using a funnel plot with Begg’s bias tests via Stata Version 12.0 (StataCorp, College Station, TX, USA; http://www.stata.com). A P value <0.05 suggested the presence of publication bias.
To explore diagnostic value of miR-224-5p in HCC, we performed a series of ROC curves. The standards for assessing the Area Under the Curve (AUC) in ROC were as follows: 0.5-0.7 (poor evidence for diagnosis); 0.7-0.9 (moderate evidence for diagnosis); 0.9-1.0 (high evidence for diagnosis). The ROC curves were drawn by MedCalc Version 9.2.0.1 (MedCalc Software, Ostend, Belgium; https://www.medcalc.org) and Stata Version 12.0 was used for SROC curve analysis.
Results
Expression and clinicopathological characteristics of miR-224 in HCC based on TCGA data
The expression level of miR-224 in HCC specimens (8.88±2.04) was higher than in non-tumor tissues (6.49±1.40), and the difference was statistically significant (P<0.001) (Figure 2A). While no significant differences were found between miR-224 expression and all the tested clinicopathological characteristics (Table 1). To assess the diagnostic value of miR-224, we conducted the ROC curve analysis based on the expression profile of miR-224 in HCC tissues compared with non-tumor tissues. The AUC of miR-224 was 0.828 (95% CI: 0.789-0.864), with a sensitivity and specificity of 61.3% and 98.0%, respectively (Figure 2B). Kaplan-Meier survival curve was constructed to evaluate prognostic value of miR-224 in HCC. However, no significant prognostic value of miR-224 in HCC was found (HR=1.007, 95% CI: 0.7121-1.423; P=0.9693) (Figure 2C).
Figure 2.

Clinical significance of miR-224 in HCC based on TCGA data. A: miR-224 expression in HCC compared with the non-tumor group; B: ROC curve analysis of miR-224 for discriminating HCC from normal liver tissues; C: Kaplan-Meier survival curves revealed the connection between miR-224 and the prognosis of patients with HCC.
Table 1.
Relationship between the expression of miR-224 and clinicopathological characteristics in HCC
| Clinicopathological feature | n | miR-224 expression (Mean ± SD) | P |
|---|---|---|---|
| Tissue | |||
| HCC | 364 | 8.88±2.04 | |
| Normal Control | 50 | 6.49±1.40 | <0.001 |
| Gender | |||
| Male | 247 | 8.80±2.10 | |
| Female | 117 | 9.06±1.89 | 0.257 |
| Age (years) | |||
| <60 | 167 | 8.79±2.04 | |
| ≥60 | 196 | 8.96±2.04 | 0.423 |
| Cirrhosis | |||
| Yes | 6 | 7.57±1.80 | |
| No | 340 | 8.93±2.03 | 0.105 |
| Grade | |||
| I | 55 | 8.31±2.02 | |
| II | 173 | 9.14±1.95 | |
| III | 120 | 8.79±2.14 | |
| IV | 12 | 9.05±1.72 | 0.058 |
| Grade | |||
| I-II | 228 | 8.94±1.99 | |
| III-IV | 132 | 8.81±2.10 | 0.58 |
| Stage | |||
| I | 87 | 8.68±1.91 | |
| II | 46 | 8.46±2.18 | |
| III | 36 | 8.84±2.47 | |
| IV | 1 | 9.88 | 0.796 |
| Stage | |||
| I-II | 133 | 8.60±2.00 | |
| III-IV | 37 | 8.87±2.44 | 0.499 |
| Vascular | |||
| Yes | 52 | 8.88±2.31 | |
| No | 105 | 8.61±2.03 | 0.444 |
| Alcohol | |||
| Yes | 84 | 8.90±2.06 | |
| No | 280 | 8.88±2.03 | 0.934 |
| Smoking | |||
| Yes | 17 | 8.33±2.60 | |
| No | 347 | 8.91±2.00 | 0.251 |
| HBV infection | |||
| Yes | 81 | 9.04±1.89 | |
| No | 283 | 8.84±2.08 | 0.421 |
| HCV infection | |||
| Yes | 56 | 9.24±1.92 | |
| No | 308 | 8.82±2.05 | 0.155 |
Expression of miR-224-5p in HCC based on GEO datasets
In total, ten eligible microarrays, including GSE6857, GSE10694, GSE12717, GSE21362, GSE22058, GSE31383, GSE41874, GSE54751, GSE57555 and GSE69580 were involved in our study. The flow chart of study selection for microarray review was presented in Figure 3. While the characteristics of the ten included GEO-based microarrays were shown in Table 2. Six microarrays (GSE10694, GSE12717, GSE21362, GSE22058, GSE31383, and GSE57555) (Figure 4B-F, 4I) displayed that miR-224-5p expression levels were significantly upregulated in HCC in comparison to noncancerous tissues (P<0.001). Nevertheless, one microarrays (GSE6857) (Figure 4A) demonstrated that the miR-224-5p expression was significantly downregulated in HCC than in noncancerous tissues (P<0.05). There were still three microarrays (GSE41874, GSE54751, and GSE69580) (Figure 4G, 4H, 4J) revealed that miR-224-5p expression levels had no statistically significant difference in HCC and non-tumor tissues (P>0.05). In the diagnostic value of miR-224-5p in HCC analysis, eight microarrays (GSE6857, GSE10694, GSE12717, GSE21362, GSE22058, GSE31383, GSE57555, GSE69580) (Figure 5A-F, 5I, 5J) showed the significant diagnostic value of miR-224-5p in HCC (P<0.05). While two microarrays (GSE41874, GSE54751) (Figure 5G, 5H) exhibited no significant diagnostic value of miR-224-5p in HCC (P>0.05).
Figure 3.
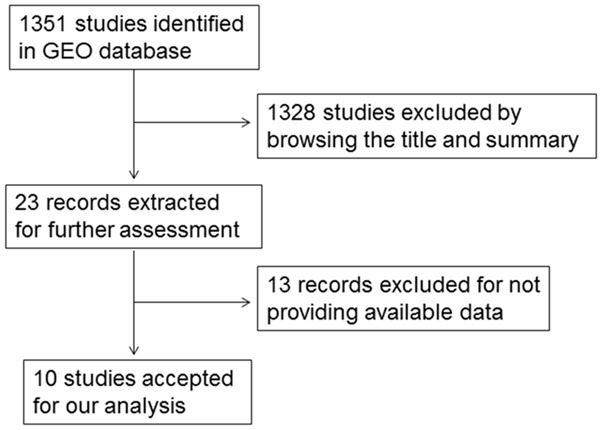
Flow chart of study selection for microarray review based on GEO datasets.
Table 2.
Characteristics of the ten included GEO-based microarrays in our study
| Dataset | Platform | Country | Sample source | Citation | Sample sizes | miR-224-5p expression (Mean ± SD) | ||
|---|---|---|---|---|---|---|---|---|
|
|
||||||||
| HCC group | Non-tumor group | HCC group | Non-tumor group | |||||
| GSE6857 | GPL4700 | USA | Tissue | Budhu A et al (2008) | 238 | 241 | 9.83±0.86 | 10.01±0.76 |
| GSE10694 | GPL6542 | China | Tissue | Li W et al (2008) | 78 | 88 | 11.59±0.97 | 10.68±0.14 |
| GSE12717 | GPL7274 | USA | Tissue | Su H et al (2009) | 10 | 6 | 9.55±2.18 | 4.78±1.40 |
| GSE21362 | GPL10312 | Japan | Tissue | Sato F et al (2011) | 73 | 73 | 7.10±1.85 | 5.87±1.39 |
| GSE22058 | GPL6793 | USA | Tissue | Burchard J et al (2010) | 96 | 96 | 0.66±0.67 | -0.01±0.36 |
| GPL9733 | ||||||||
| GPL10457 | ||||||||
| GSE31383 | GPL10122 | USA | Tissue | Wang PR et al (2012) | 9 | 10 | 5.98±2.40 | -0.90±1.73 |
| GSE41874 | GPL7722 | Japan | Tissue | Missing | 3 | 3 | 1.26±0.26 | 1.02±0.28 |
| GSE54751 | GPL18262 | USA | Tissue | Shen J et al (2015) | 10 | 10 | 0.03±0.02 | 0.01±0.01 |
| GSE57555 | GPL16699 | Japan | Tissue | Murakami Y et al (2015) | 5 | 16 | 0.05±0.08 | -0.04±0.02 |
| GPL18044 | ||||||||
| GSE69580 | GPL10850 | Taiwan | Tissue | Missing | 3 | 5 | 2.45±1.75 | 0.80±1.31 |
Figure 4.
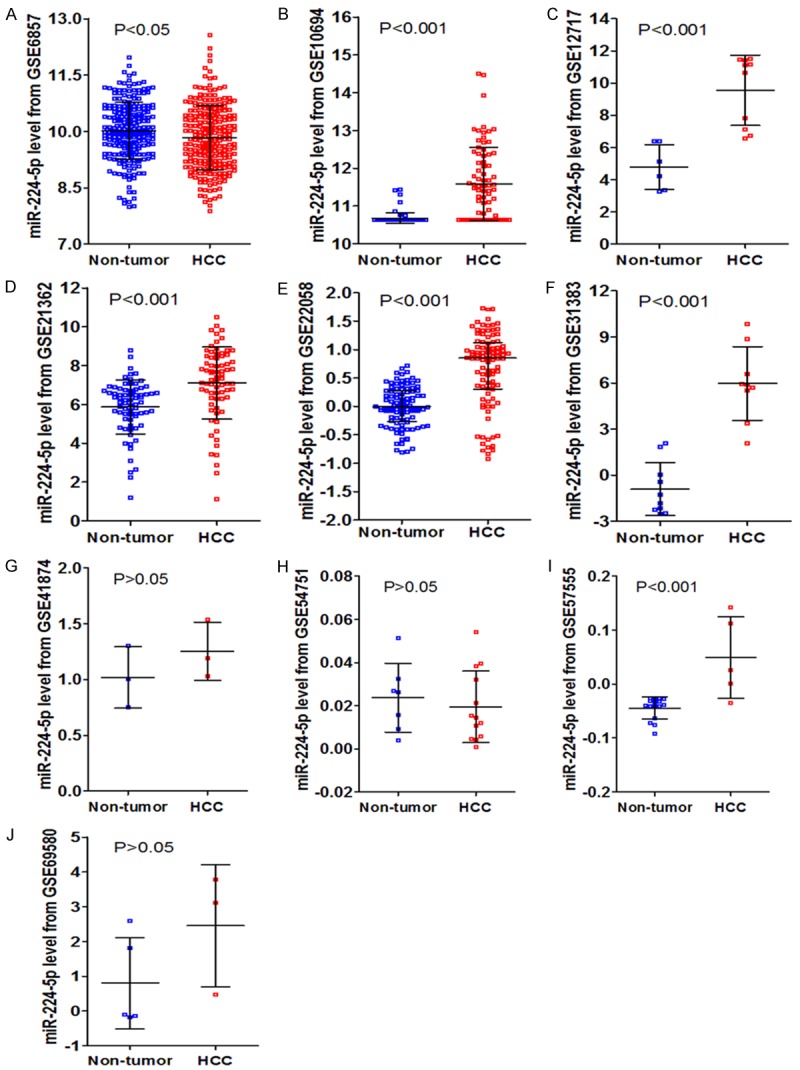
The expression data of miR-224-5p in HCC in ten microarrays from GEO datasets.
Figure 5.
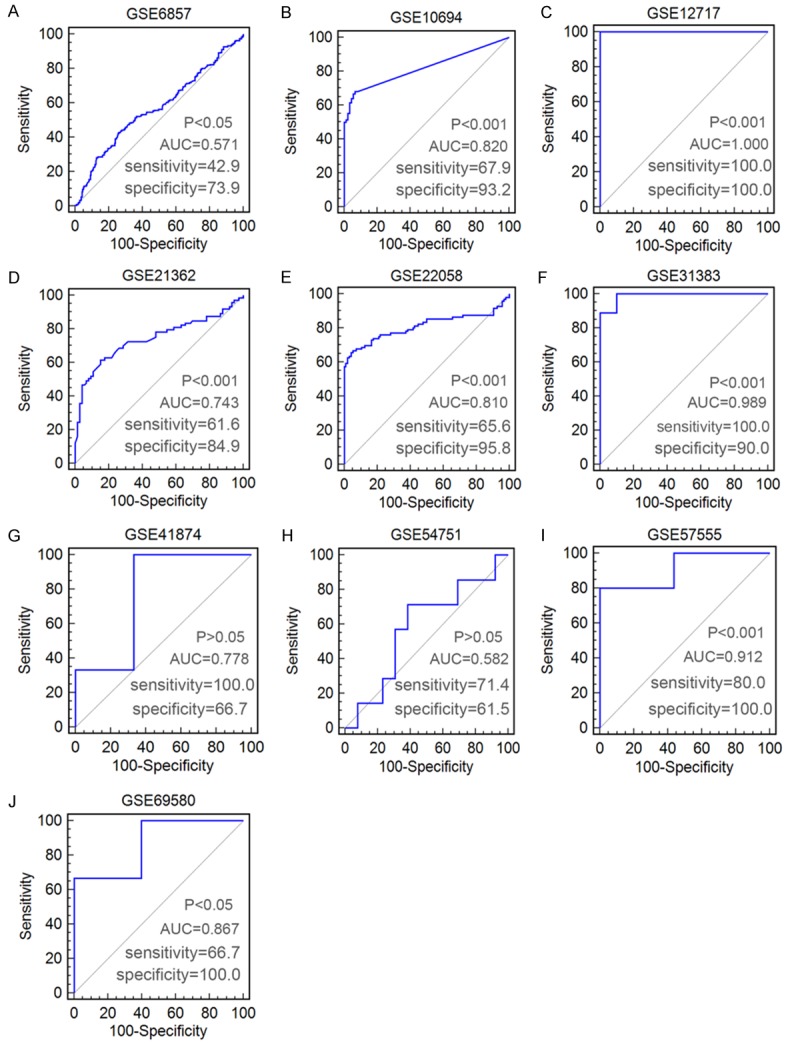
ROC curves of miR-224-5p for discriminating HCC from normal liver tissues in ten microarrays from GEO datasets.
Comprehensive meta-analysis
We performed a comprehensive meta-analysis of miR-224-5p expression based on the data gathered from TCGA and all GEO microarray datasets, including 889 HCC samples and 598 non-tumor liver tissues. According to the heterogeneity test, significant heterogeneity occurred among individual datasets of the expression of miR-224-5p in HCC (Pheterogeneity<0.00001, I2=94%; Figure 6A) and the random-effects model was selected. Significant difference of miR-224-5p expression between HCC group and noncancerous group was observed (SMD=1.24, 95% CI: 0.68-1.81; P<0.0001), which confirmed the expression level of miR-224-5p in HCC tissues was higher than non-tumor tissues. In the sensitivity analysis, after removing the study of GSE31383 and GSE6857, the SMD was statistically changed to 1.17 (95% CI: 1.02-1.33; P<0.00001) and no significant heterogeneity was observed (Pheterogeneity=0.12, I2= 37%; Figure 6B). The funnel plot was nearly symmetric and the P value was greater than 0.05 (Begg’s P=0.64; Figure 7), suggested that no publication bias existed. To comprehensively evaluate the diagnostic value of miR-224-5p in HCC, we constructed a summary receiver operating characteristic (SROC) curve and calculated the AUC with its 95% CI. As shown in Figure 8, the overall AUC of miR-224-5p in HCC was 0.92 (95% CI: 0.90-0.94), and the sensitivity and specificity were 0.92 and 0.78, respectively.
Figure 6.
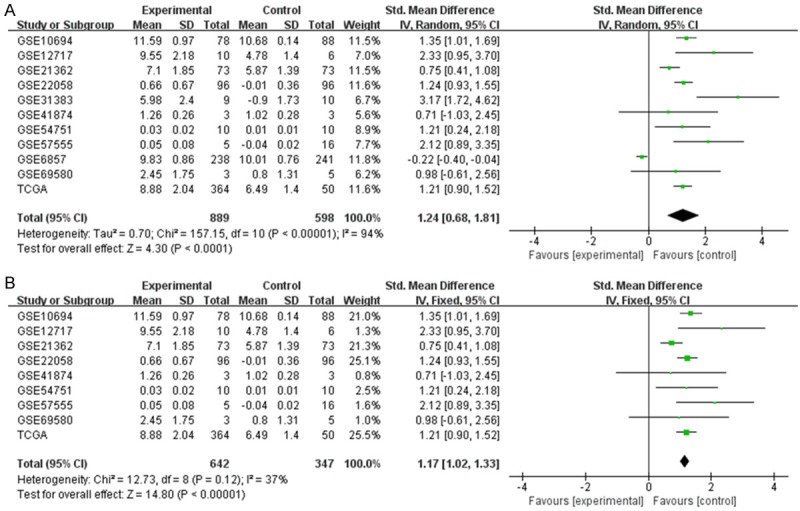
Forest plot of studies evaluating SMD of miR-224-5p expression between HCC group and non-tumor group (A) and the Forest plot after sensitivity analysis (B).
Figure 7.

Funnel plot for publication bias test on all included studies.
Figure 8.
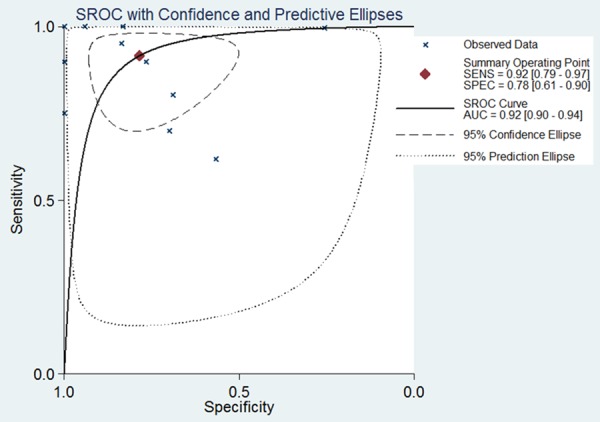
SROC curve of miR-224-5p for discriminating HCC from normal liver tissues in all included studies.
Potential target genes of miR-224-5p in HCC
We used 12 computational prediction tools to predict potential target genes of miR-224-5p, and 14,407 target genes were acquired once in total. The number of genes that were simultaneously predicted by four or more than four computational prediction tools was 4,927. In addition, 1,123 down-regulated DEGs in HCC were acquired from TCGA. We selected the genes that both in the above 4927 predicted genes and 1,123 down-regulated DEGs in HCC, and gained 262 overlapping genes for further bioinformatics analysis, as shown in Table 3.
Table 3.
Overlapping target genes of miR-224-5p in HCC
| ZNF330 | ST3GAL6 | SLC39A14 | RASD1 | OGDHL | MFAP3L | IRF8 | GLUD1 | EPM2A | CYP1A2 | CBFA2T3 | ANKRD55 |
| ZG16 | SRGN | SLC38A4 | RANBP3L | NUDT10 | MEGF10 | INHBC | GLS2 | EPHA2 | CXCR2 | CAT | ANGPTL3 |
| ZFP36L1 | SRD5A1 | SLC38A2 | PTPN3 | NR4A3 | MCL1 | IL6ST | GCH1 | EPB41L4B | CTNNA3 | CAMK4 | AMOTL2 |
| ZFP1 | SPTBN2 | SLC35D1 | PTGIS | NR4A1 | MBNL2 | IL1RN | GABARAPL1 | ENPEP | CR1 | CALN1 | AMHR2 |
| YPEL2 | SPSB1 | SLC31A1 | PSAT1 | NR3C2 | MBL2 | IL1RAP | FRMD4B | EIF4E3 | CPN2 | CA2 | ALDOB |
| XDH | SPRYD4 | SIK1 | PRRG4 | NPY1R | MASP1 | IGFBP4 | FREM2 | EGR2 | CPEB3 | C8A | ALDH8A1 |
| WNT2 | SPG20 | SIGLEC1 | PROS1 | NKX3-1 | MAN1A1 | IGFBP3 | FOXO1 | EGR1 | COL6A6 | C6 | ALDH4A1 |
| WEE1 | SPATA18 | SGMS2 | PRKCB | NDST3 | MAFF | IGF1 | FOSB | EFNB3 | COBLL1 | C21orf91 | AKR1D1 |
| WDR72 | SOWAHC | SFRP1 | PRKAR2B | NCOR1 | LRRC55 | HSD17B13 | FNIP2 | EDNRB | CMTM6 | C21orf33 | AGBL4 |
| USH2A | SORL1 | SERPINE1 | PPP1R3B | NAMPT | LRAT | HPGD | FLRT3 | DUSP14 | CMPK2 | C1RL | ADRB2 |
| TSPAN7 | SORD | SERPINB9 | PLCXD3 | NADK2 | LPIN2 | HOGA1 | FHL2 | DUSP1 | CMBL | BMPER | ADRA1B |
| TRIB1 | SOCS6 | SDC4 | PLA2G16 | NAALADL2 | LIFR | HMGCLL1 | FGB | DPF3 | CLEC12A | BACH2 | ADH6 |
| TMPRSS2 | SOCS2 | SAMD5 | PIM1 | N4BP2L1 | LARP1B | HHIP | FAT4 | DNASE1L3 | CISH | AVPR1A | ADH1B |
| TMEM47 | SLCO4C1 | RUNDC3B | PHLDA1 | MYO1B | KLRF1 | HABP2 | FAM65C | DNAJC12 | CHST7 | ATOH8 | ACVR1C |
| TMEM26 | SLC9A9 | RSAD2 | PELI2 | MTTP | KLHL15 | GRIN2B | FAM46C | DIRAS3 | CHRM2 | ATF3 | ACSL1 |
| TGFBR3 | SLC8A1 | RNF152 | PDGFRA | MSRA | KLF11 | GREM2 | FAM180A | DGAT2 | CDH19 | ASS1 | ACAT1 |
| TEK | SLC7A2 | RNF125 | PDE7B | MS4A6A | KLF10 | GRAMD1C | FAM13A | DCUN1D3 | CD69 | ASPG | ACADSB |
| TCF21 | SLC6A12 | RND3 | PCDH9 | MRO | KDM8 | GPR180 | FAM110C | DCN | CD302 | ARSD | ABLIM3 |
| TAPT1 | SLC5A1 | RHOB | PANK1 | MPPED1 | KBTBD11 | GPM6A | EXPH5 | DBT | CD160 | ARL5B | ABCC9 |
| SYT10 | SLC4A4 | RGAG4 | PAIP2B | MPEG1 | JDP2 | GNE | ESR1 | CYP3A4 | CCR1 | AR | AADAT |
| SYNPO2 | SLC46A3 | RD3L | OLFML3 | MPDZ | IYD | GNAO1 | ERRFI1 | CYP2J2 | CCDC71L | APOL6 | |
| STX11 | SLC41A2 | RBMS3 | OIT3 | MMAA | IVD | GNA14 | ERLIN1 | CYP2C18 | CCDC25 | AOX1 |
Functional and pathway enrichment analysis
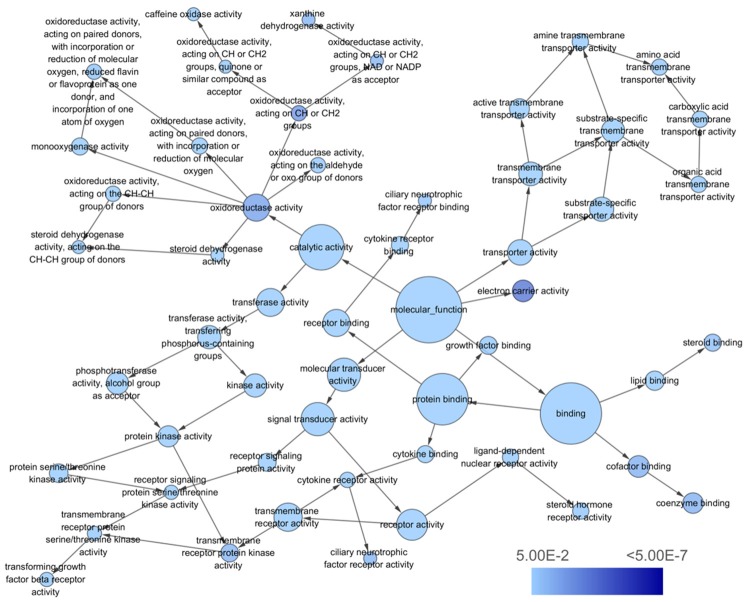
To explore the functions of the 262 overlapping genes signatures, we performed GO annotation analysis by DAVID. Through GO annotation analysis, the overlapping genes were classified into 3 GO categories, including BP, CC and MF. In BP, the top three processes which overlapping genes significantly participated in were cellular response to chemical stimulus, single-organism metabolic process, and response to organic substance. Meanwhile, in CC, plasma membrane part, cell periphery, and integral component of plasma membrane were considered the top three. In MF, the top three significant items were coenzyme binding, growth factor binding, and cofactor binding.
KEGG pathway enrichment analysis showed the top three significant enrichments of the overlapping genes were complement and coagulation cascades, metabolic pathways, and tryptophan metabolism. The top ten GO annotations and KEGG pathways that listed according to the P values were shown in Table 4. Three visualized GO network graphs (BP, CC, and MF) by Cytoscape 3.2.1 were presented in Figures 9, 10, 11, and the visualized KEGG enrichment result by ggplot2 package of R was rendered in Figure 12.
Table 4.
Significant terms of GO annotation (includes biological process, cellular component and molecular function) and KEGG pathway enrichment analysis of miR-224-5p overlapping target genes
| ID | Term | Count (%) | P-value | Genes |
|---|---|---|---|---|
| Biological Process | ||||
| GO:0070887 | Cellular response to chemical stimulus | 78 (29.8) | 2.46E-11 | CYP3A4, NAMPT, CYP2J2, CYP2C18, CPEB3, IL6ST, FOXO1, CXCR2, CMBL, WNT2, etc. |
| GO:0044710 | Single-organism metabolic process | 102 (38.9) | 4.62E-11 | CYP3A4, ALDH8A1, SGMS2, IL6ST, ADH1B, FOXO1, ENPEP, PRKAR2B, PTGIS, GRIN2B, etc. |
| GO:0010033 | Response to organic substance | 80 (30.5) | 8.04E-11 | NAMPT, CPEB3, IL6ST, FOXO1, CXCR2, ACVR1C, WNT2, EDNRB, PRKAR2B, PTGIS, etc. |
| GO:0044281 | Small molecule metabolic process | 63 (24.0) | 1.35E-10 | ALDH8A1, CYP3A4, NAMPT, CYP2J2, CYP2C18, OGDHL, SORL1, ADH1B, FOXO1, CBFA2T3, etc. |
| GO:0019752 | Carboxylic acid metabolic process | 38 (14.5) | 1.95E-10 | ALDH8A1, ACADSB, SORD, CYP2J2, ASS1, CYP2C18, GNE, GLUD1, OGDHL, ALDOB, etc. |
| GO:0043436 | Oxoacid metabolic process | 38 (14.5) | 2.31E-10 | ALDH8A1, ACADSB, SORD, CYP2J2, ASS1, CYP2C18, GNE, GLUD1, OGDHL, ALDOB, etc. |
| GO:0071310 | Cellular response to organic substance | 65 (24.8) | 1.83E-09 | NAMPT, CPEB3, IL6ST, FOXO1, CXCR2, WNT2, EDNRB, PRKAR2B, PTGIS, ST3GAL6, etc. |
| GO:0006082 | Organic acid metabolic process | 38 (14.5) | 2.58E-09 | ALDH8A1, ACADSB, SORD, CYP2J2, ASS1, CYP2C18, GNE, GLUD1, OGDHL, ALDOB, etc. |
| GO:0009725 | Response to hormone | 36 (13.7) | 6.54E-09 | NAMPT, SORD, ASS1, NR3C2, FHL2, FOXO1, ACAT1, ACVR1C, ZFP36L1, PRKAR2B, etc. |
| GO:0048585 | Negative regulation of response to stimulus | 47 (17.9) | 1.10E-08 | XDH, MCL1, MASP1, IL6ST, SORL1, FOXO1, DCN, GREM2, TRIB1, TCF21, etc. |
| Cellular Component | ||||
| GO:0044459 | Plasma membrane part | 62 (23.7) | 1.72E-05 | GNA14, SGMS2, IL6ST, CPEB3, SLC5A1, SORL1, TSPAN7, CXCR2, ENPEP, SDC4, etc. |
| GO:0071944 | Cell periphery | 102 (38.9) | 4.39E-05 | SLC9A9, GNA14, SGMS2, IL6ST, FAM110C, TSPAN7, ENPEP, AMOTL2, MEGF10, WNT2, etc. |
| GO:0005887 | Integral component of plasma membrane | 43 (16.4) | 4.83E-05 | SLC39A14, SLC38A4, SLC38A2, SGMS2, IL6ST, C6, CCR1, SLC5A1, SORL1, TSPAN7, etc. |
| GO:0031226 | Intrinsic component of plasma membrane | 44 (16.8) | 5.62E-05 | SLC39A14, SLC38A4, SLC38A2, SGMS2, IL6ST, C6, CCR1, SLC5A1, SORL1, TSPAN7, etc. |
| GO:0005886 | Plasma membrane | 99 (37.8) | 8.77E-05 | SLC9A9, GNA14, SGMS2, IL6ST, TSPAN7, ENPEP, AMOTL2, MEGF10, WNT2, PRKAR2B, etc. |
| GO:0044421 | Extracellular region part | 79 (30.2) | 1.25E-04 | ALDH8A1, NAMPT, GNA14, ARSD, CYP2J2, MASP1, IL6ST, SLC5A1, SORL1, ENPEP, etc. |
| GO:1903561 | Extracellular vesicle | 60 (22.9) | 4.37E-04 | ALDH8A1, NAMPT, GNA14, ARSD, CYP2J2, IL6ST, SLC5A1, SORL1, ENPEP, SDC4, etc. |
| GO:0043230 | Extracellular organelle | 60 (22.9) | 4.41E-04 | ALDH8A1, NAMPT, GNA14, ARSD, CYP2J2, IL6ST, SLC5A1, SORL1, ENPEP, SDC4, etc. |
| GO:0005576 | Extracellular region | 88 (33.6) | 4.53E-04 | ALDH8A1, GNA14, NAMPT, ARSD, CYP2J2, MASP1, IL6ST, SLC5A1, SORL1, ENPEP, etc. |
| GO:0070062 | Extracellular exosome | 59 (22.5) | 6.74E-04 | ALDH8A1, NAMPT, GNA14, ARSD, CYP2J2, IL6ST, SLC5A1, SORL1, ENPEP, SDC4, etc. |
| Molecular Function | ||||
| GO:0050662 | Coenzyme binding | 12 (4.6) | 5.37E-05 | XDH, ACADSB, SORD, IVD, GLUD1, AOX1, OGDHL, SRD5A1, CAT, ACAT1, etc. |
| GO:0019838 | Growth factor binding | 10 (3.8) | 7.15E-05 | DUSP1, IL6ST, TEK, IL1RN, PDGFRA, LIFR, TGFBR3, IGFBP3, IGFBP4, ACVR1C |
| GO:0048037 | Cofactor binding | 14 (5.3) | 1.12E-04 | AADAT, XDH, ACADSB, SORD, GLUD1, OGDHL, ACAT1, GCH1, IVD, AOX1, etc. |
| GO:0016491 | Oxidoreductase activity | 25 (9.5) | 1.32E-04 | XDH, CYP3A4, ALDH8A1, ACADSB, SORD, CYP2J2, CYP2C18, GLUD1, HSD17B13, OGDHL, etc. |
| GO:0016725 | Oxidoreductase activity, acting on CH or CH2 groups | 4 (1.5) | 2.90E-04 | CYP3A4, XDH, AOX1, CYP1A2 |
| GO:0019199 | Transmembrane receptor protein kinase activity | 7 (2.7) | 9.47E-04 | AMHR2, EFNB3, TEK, PDGFRA, TGFBR3, EPHA2, ACVR1C |
| GO:0038023 | Signaling receptor activity | 35 (13.4) | 1.07E-03 | TAPT1, IL6ST, CCR1, SORL1, NR3C2, CXCR2, SDC4, ACVR1C, EDNRB, GRIN2B, etc. |
| GO:0004860 | Protein kinase inhibitor activity | 7 (2.7) | 1.14E-03 | FLRT3, PRKAR2B, SOCS2, SOCS6, DCN, CISH, TRIB1 |
| GO:0003707 | Steroid hormone receptor activity | 6 (2.3) | 1.31E-03 | AR, NR3C2, ESR1, NR4A1, NKX3-1, NR4A3 |
| GO:0019210 | Kinase inhibitor activity | 7 (2.7) | 1.37E-03 | FLRT3, PRKAR2B, SOCS2, SOCS6, DCN, CISH, TRIB1 |
| KEGG pathway | ||||
| hsa04610 | Complement and coagulation cascades | 8 (3.1) | 3.04E-04 | C8A, MBL2, CR1, MASP1, FGB, C6, SERPINE1, PROS1 |
| hsa01100 | Metabolic pathways | 40 (15.3) | 4.75E-04 | CYP3A4, XDH, NAMPT, ACADSB, NDST3, SORD, CYP2J2, SGMS2, ASS1, CYP2C18, etc. |
| hsa00380 | Tryptophan metabolism | 6 (2.3) | 8.76E-04 | AADAT, AOX1, OGDHL, CAT, CYP1A2, ACAT1 |
| hsa00830 | Retinol metabolism | 7 (2.7) | 1.37E-03 | CYP3A4, LRAT, CYP2C18, AOX1, ADH6, ADH1B, CYP1A2 |
| hsa00280 | Valine, leucine and isoleucine degradation | 6 (2.3) | 1.84E-03 | DBT, ACADSB, HMGCLL1, IVD, AOX1, ACAT1 |
| hsa04020 | Calcium signaling pathway | 10 (3.8) | 6.76E-03 | EDNRB, GNA14, SLC8A1, ADRB2, CAMK4, CHRM2, PDGFRA, AVPR1A, ADRA1B, PRKCB |
| hsa04964 | Proximal tubule bicarbonate reclamation | 4 (1.5) | 8.94E-03 | GLS2, GLUD1, CA2, SLC4A4 |
| hsa00071 | Fatty acid degradation | 5 (1.9) | 9.32E-03 | ACADSB, ACSL1, ADH6, ADH1B, ACAT1 |
| hsa00591 | Linoleic acid metabolism | 4 (1.5) | 1.70E-02 | CYP3A4, PLA2G16, CYP2J2, CYP1A2 |
| hsa00250 | Alanine, aspartate and glutamate metabolism | 4 (1.5) | 2.80E-02 | GLS2, ASS1, GLUD1, ALDH4A1 |
Figure 9.
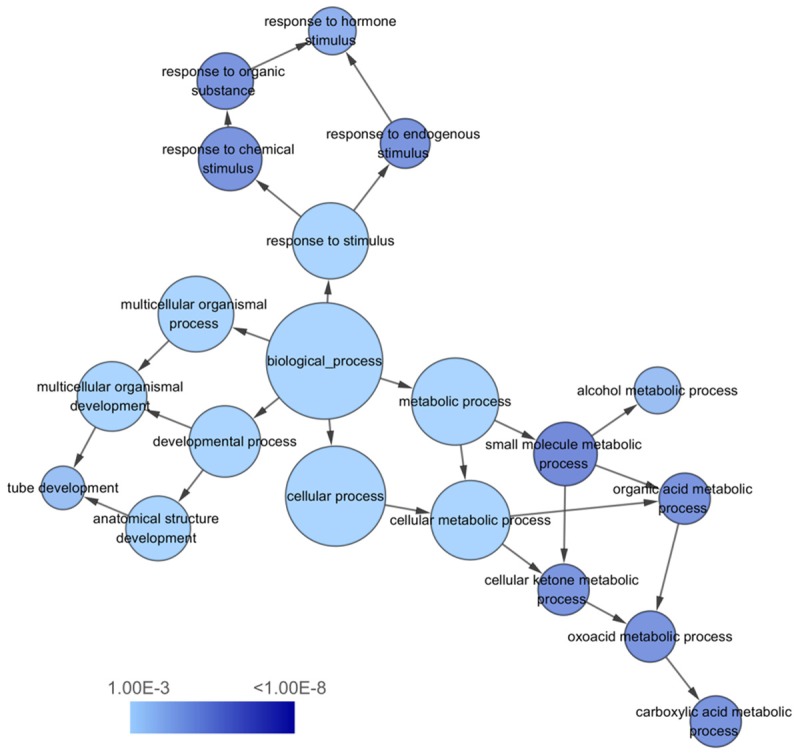
The biological process (BP) network of miR-224-5p overlapping targeted genes. The circles represented different terms of biological processes and the arrows represented relationships among terms. The color of nodes indicated the significance of the corresponding term.
Figure 10.
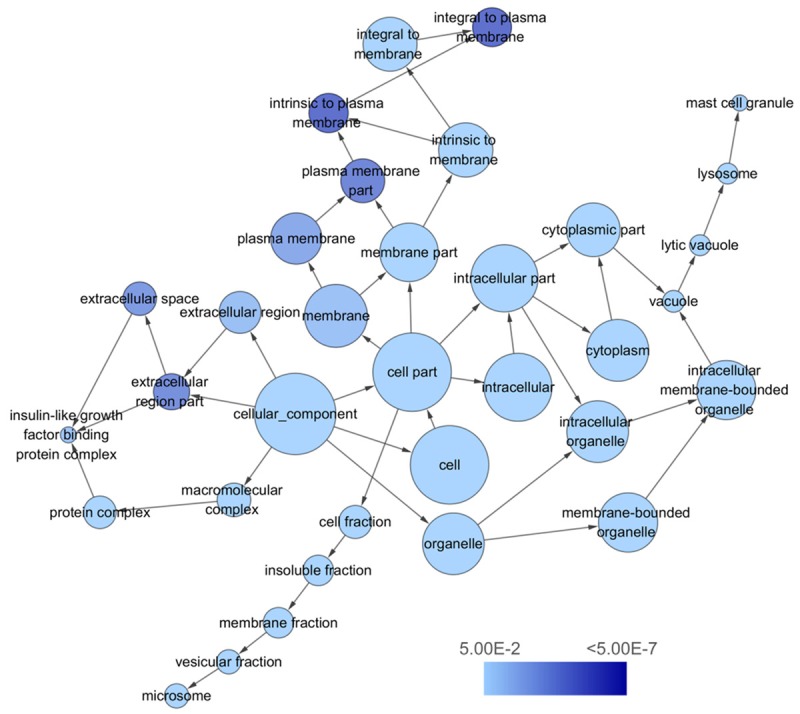
The cellular component (CC) network of miR-224-5p overlapping targeted genes. The circles represented different terms of cellular components and the arrows represented relationships among terms. The color of nodes indicated the significance of the corresponding term.
Figure 11.
The molecular function (MF) network of miR-224-5p overlapping targeted genes. The circles represented different terms of molecular functions and the arrows represented relationships among terms. The color of nodes indicated the significance of the corresponding term.
Figure 12.
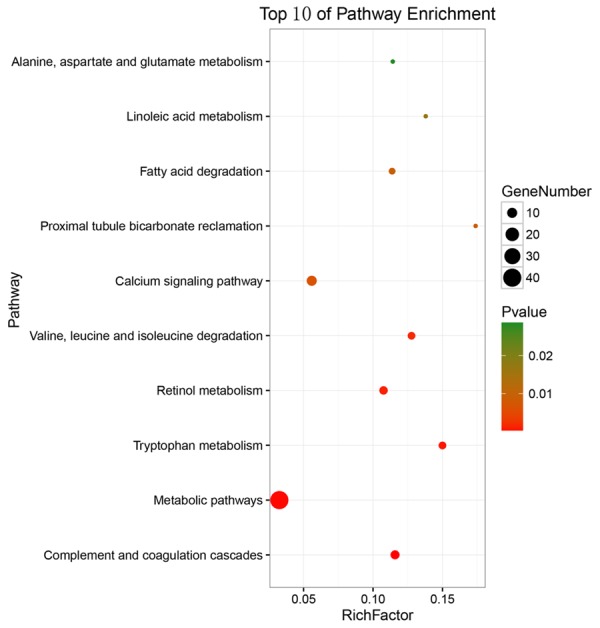
Top 10 Kyoto Encyclopedia of Genes and Genomes (KEGG) pathways of miR-224-5p overlapping targeted genes. The color tints indicated the significance of the corresponding pathway. The size of the circle presented the number of enrichment genes in the pathway. Rich factor expressed the percentage of the ratio of miR-224-5p overlapping targeted genes in current study vs total genes in the pathway.
PPI network analysis
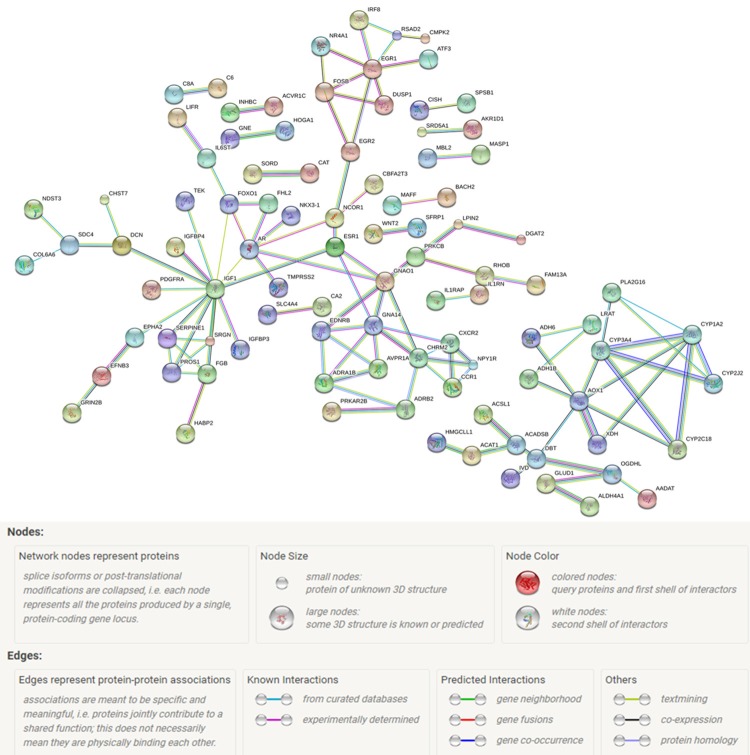
To analyze proteins of the 262 overlapping genes whether interrelated on each other, the PPI network was constructed by STRING (Figure 13). In the PPI network analysis, five genes, including G protein subunit alpha 14 (GNA14), insulin like growth factor 1 (IGF1), early growth response 1 (EGR1), aldehyde oxidase 1 (AOX1), and G protein subunit alpha o 1 (GNAO1), were identified as hub genes. Subsequently, we performed Spearman correlation between the hub genes expression and miR-224 expression based on TCGA data. A significant negative correlation was found between GNA14 and miR-224 (r=-0.1146, P=0.0277) (Figure 14A), indicating GNA14 have strong potential to be the target gene of miR-224. However, a significant positive correlation was observed between IGF1 and miR-224 (r=0.1342, P=0.0099) (Figure 14B), and no significant correlation was discovered between EGR1, AOX1, GNAO1 and miR-224 (P=0.2298, P=0.0919, and P=0.6387) (Figure 14C-E).
Figure 13.
Predicted interactions of miR-224-5p overlapping targeted genes from STRING online database (http://string-db.org) and the cut-off criterion was confidence score >0.7. Network nodes represent proteins and edges represent protein-protein associations.
Figure 14.

Correlation between miR-224 and the hub target genes (A) GNA14; (B) IGF1; (C) EGR1; (D) AOX1; (E) GNAO1.
Discussion
In this study, we analyzed the expression and clinicopathological characteristics of miR-224 in HCC based on TCGA RNA-seq data and found the up-regulation of miR-224 in HCC. Meanwhile, miR-224 might represent a diagnostic marker according to its AUC in ROC curve (AUC=0.828, 95% CI: 0.789-0.864). Then, we verified the conclusions by aggregating the GEO microarray datasets and then analyzed the expression and diagnostic value of miR-224-5p in HCC. We found miR-224-5p expression was higher than non-tumor tissues and miR-224-5p had a good diagnostic value in most of the microarrays. Afterwards, we performed a comprehensive meta-analysis of miR-224-5p expression based on the data gathered from TCGA and all GEO microarray datasets, and finally confirmed the up-regulation of miR-224-5p in HCC. Moreover, the overall AUC of miR-224-5p in HCC by the comprehensive meta-analysis could become a strong evidence to approve the conclusion that miR-224-5p might represent a diagnostic marker.
In recent studies, expression of miR-224-5p has been commonly identified as upregulated in several human cancer types, such as ovarian cancer [14], cervical cancer [15], colorectal cancer [29], lung cancer [20] and glioma [24]. However, there were reports about low expression of miR-224-5p in diffuse large B cell lymphoma [30], prostate cancer [31] and meningioma [32]. In female genital cancer, Hu et al investigated that miR-224 could affect the proliferation abilities of human epithelial ovarian cancer cells by KLLN-cyclin A pathway [14], while Huang et al found that miR-224 promoted biological behaviors of cervical cancer cells via targeting RASSF8, such as proliferation, migration and invasion [15]. In digestive system cancer, Liu et al identified miR-224 could suppress the invasion and proliferation of gastric cancer cells through negatively regulating the expression and biological characteristics of RKIP [33], while Ke et al demonstrated miR-224 suppressed the migratory ability of colorectal cancer cells by targeting Cdc42 [34]. Reviewing the above published literature, we could conclude that miR-224 played different roles in different diseases by regulating multiple signaling pathways and target genes.
Up to now, a number of papers have been published about the roles of miR-224 in HCC. For example, Scisciani et al identified miR-224 upregulation in HCC was association with p65/NFκB and inflammatory pathways [27], while Wang et al discovered the overexpression of miR-224 in HCC has connection with EP300 [35]. Here, we verified the up-regulation of miR-224-5p from ten eligible GEO microarray datasets and TCGA RNA-seq data. The relatively big sample sizes made the conclusion to be credible; however, the regulation of miR-224 expression in HCC still remains to be further explored. About tumor biology, Zhang et al demonstrated miR-224 bound to multiple target genes such as PAK2, MAPK1, BCL-2, CDC42 and CDH1, influencing HCC cells’ anti-apoptosis, migration, invasion, and proliferation [36]. Ma et al and Yu et al both reported that miR-224 upregulation may have connection with HCC tumor progression by activating AKT signaling pathway [37,38]. All of the above suggested miR-224 might take part in multiple biological processes and various signaling pathways in HCC tumorigenesis and progression. However, the confirmed target genes of miR-224 were rare due to limited experimental time and cost. Therefore, bioinformatics methods seem to play an important role on predicting the target genes of miR-224.
To explore potential role of miR-224-5p in HCC, bioinformatics methods were applied. We used 12 computational prediction tools to get target genes of miR-224-5p, and only genes that were simultaneously predicted by no less than four computational prediction tools were selected for further study. By overlapping the down-regulated DEGs in HCC, we finally gained 262 extracted target genes of miR-224-5p. Next, we performed GO, KEGG, and PPI network annotation to explore the regulatory role of the 262 overlapping genes. We noticed that these overlapping genes were most enriched in cellular response to chemical stimulus, response to organic substance, response to hormone, carboxylic acid metabolic process, oxoacid metabolic process and small molecule metabolic process, which indicated the overlapping genes mostly participate in the response to external stimulation and metabolic process in BP. As for CC, we found these overlapping genes were significantly involved in plasma membrane part, integral component of plasma membrane, intrinsic component of plasma membrane, and plasma membrane, which showed a possible membrane-associated metabolism. For MF, these overlapping genes were significantly enriched in coenzyme binding, growth factor binding, and cofactor binding, which indicated the high binding ability in molecular function they had. Besides, we discovered the overlapping genes were significantly associated with metabolic pathways, tryptophan metabolism, retinol metabolism, linoleic acid metabolism, and alanine, aspartate and glutamate metabolism, indicated the potential miR-224-5p target genes participate in multiple metabolic pathways. Finally, we performed the PPI network annotation of the overlapping genes, and found a complex connection of the proteins by each other. In the hub genes analysis, we found a significant negative correlation between GNA14 and miR-224-5p. GNA14, located in 9q21.2, belongs to the G protein family. Nowadays, there were some studies about GNA14 and malignant tumors, for example, Lim et al identified GNA14 mutations could cause child vascular tumors, helping to discover the mechanisms of malignant transformation [39], while Oshima et al defined GNA14 as one of the promoters to gastric cancer by TNF-α/TNFR1 signaling pathway [40]. Here, we predicted GNA14 as a hub gene in HCC by bioinformatics analysis and revealed the significant negative correlation between GNA14 and miR-224-5p for the first time.
To sum up, the study investigated the expression and clinicopathological characteristics of miR-224-5p in HCC based on TCGA RNA-seq data and GEO microarray datasets, and finally confirmed the up-regulation and good diagnostic value of miR-224-5p in HCC. Furthermore, bioinformatics analysis was performed to predict the potential target genes and pathways of miR-224-5p. In the PPI analysis, five hub genes were validated and extracted out for further correlation analysis. Surprisingly, GNA14 stood out cause for the significant negative correlation with miR-224. Forthcoming research can focus on the relationship of miR-224-5p with GNA14 which confirmed in vivo and in vitro, as well as the molecular mechanisms within the potential target genes and pathways of miR-224-5p in HCC.
Conclusion
In our study, we identified the up-regulation and diagnostic value of miR-224-5p in HCC. Meanwhile, the results of our study suggested miR-224-5p might play an oncogenic role in HCC by targeting GNA14. We also obtained other potential target genes and pathways of miR-224-5p via bioinformatics method. Some potential target genes and pathways were already verified by previous studies, while most of others need further study as well as the molecular mechanisms of miR-224-5p in HCC. We hope our research may provide some clues for the subsequent research on miR-224-5p in HCC.
Acknowledgements
This manuscript is supported by the Fund of National Natural Science Foundation of China (NSFC81560386) and Youth Science Foundation of Guangxi Medical University (GXMUYSF201624).
Disclosure of conflict of interest
None.
References
- 1.Li JJ, Luo J, Lu JN, Liang XN, Luo YH, Liu YR, Yang J, Ding H, Qin GH, Yang LH, Dang YW, Yang H, Chen G. Relationship between TRAF6 and deterioration of HCC: an immunohistochemical and in vitro study. Cancer Cell Int. 2016;16:76. doi: 10.1186/s12935-016-0352-z. [DOI] [PMC free article] [PubMed] [Google Scholar]
- 2.Liu YR, Tang RX, Huang WT, Ren FH, He RQ, Yang LH, Luo DZ, Dang YW, Chen G. Long noncoding RNAs in hepatocellular carcinoma: novel insights into their mechanism. World J Hepatol. 2015;7:2781–2791. doi: 10.4254/wjh.v7.i28.2781. [DOI] [PMC free article] [PubMed] [Google Scholar]
- 3.Gan TQ, Tang RX, He RQ, Dang YW, Xie Y, Chen G. Upregulated MiR-1269 in hepatocellular carcinoma and its clinical significance. Int J Clin Exp Med. 2015;8:714–721. [PMC free article] [PubMed] [Google Scholar]
- 4.Maynard JP, Lee JS, Sohn BH, Yu X, Lopez-Terrada D, Finegold MJ, Goss JA, Thevananther S. P2X3 purinergic receptor overexpression is associated with poor recurrence-free survival in hepatocellular carcinoma patients. Oncotarget. 2015;6:41162–41179. doi: 10.18632/oncotarget.6240. [DOI] [PMC free article] [PubMed] [Google Scholar]
- 5.Zhu P, Jin J, Liao Y, Li J, Yu XZ, Liao W, He S. A novel prognostic biomarker SPC24 up-regulated in hepatocellular carcinoma. Oncotarget. 2015;6:41383–41397. doi: 10.18632/oncotarget.5510. [DOI] [PMC free article] [PubMed] [Google Scholar]
- 6.Rigalli JP, Ciriaci N, Arias A, Ceballos MP, Villanueva SS, Luquita MG, Mottino AD, Ghanem CI, Catania VA, Ruiz ML. Regulation of multidrug resistance proteins by genistein in a hepatocarcinoma cell line: impact on sorafenib cytotoxicity. PLoS One. 2015;10:e0119502. doi: 10.1371/journal.pone.0119502. [DOI] [PMC free article] [PubMed] [Google Scholar]
- 7.Cao Y, Chen J, Wang D, Peng H, Tan X, Xiong D, Huang A, Tang H. Upregulated in Hepatitis B virus-associated hepatocellular carcinoma cells, miR-331-3p promotes proliferation of hepatocellular carcinoma cells by targeting ING5. Oncotarget. 2015;6:38093–38106. doi: 10.18632/oncotarget.5642. [DOI] [PMC free article] [PubMed] [Google Scholar]
- 8.Zhang X, Tang W, Li R, He R, Gan T, Luo Y, Chen G, Rong M. Downregulation of microRNA-132 indicates progression in hepatocellular carcinoma. Exp Ther Med. 2016;12:2095–2101. doi: 10.3892/etm.2016.3613. [DOI] [PMC free article] [PubMed] [Google Scholar]
- 9.Huang WT, Chen ZX, He RQ, Wu YZ, Yin SY, Liang XN, Chen G, Yang H, Peng ZG, Yang LH. Clinicopathological role of miR-30a-5p in hepatocellular carcinoma tissues and prediction of its function with bioinformatics analysis. Onco Targets Ther. 2016;9:5061–5071. doi: 10.2147/OTT.S111431. [DOI] [PMC free article] [PubMed] [Google Scholar]
- 10.He R, Yang L, Lin X, Chen X, Lin X, Wei F, Liang X, Luo Y, Wu Y, Gan T, Dang Y, Chen G. MiR-30a-5p suppresses cell growth and enhances apoptosis of hepatocellular carcinoma cells via targeting AEG-1. Int J Clin Exp Pathol. 2015;8:15632–15641. [PMC free article] [PubMed] [Google Scholar]
- 11.Pan L, Huang S, He R, Rong M, Dang Y, Chen G. Decreased expression and clinical significance of miR-148a in hepatocellular carcinoma tissues. Eur J Med Res. 2014;19:68. doi: 10.1186/s40001-014-0068-2. [DOI] [PMC free article] [PubMed] [Google Scholar]
- 12.Wang C, Wang X, Su Z, Fei H, Liu X, Pan Q. MiR-25 promotes hepatocellular carcinoma cell growth, migration and invasion by inhibiting RhoGDI1. Oncotarget. 2015;6:36231–36244. doi: 10.18632/oncotarget.4740. [DOI] [PMC free article] [PubMed] [Google Scholar]
- 13.Shi KQ, Lin Z, Chen XJ, Song M, Wang YQ, Cai YJ, Yang NB, Zheng MH, Dong JZ, Zhang L, Chen YP. Hepatocellular carcinoma associated microRNA expression signature: integrated bioinformatics analysis, experimental validation and clinical significance. Oncotarget. 2015;6:25093–25108. doi: 10.18632/oncotarget.4437. [DOI] [PMC free article] [PubMed] [Google Scholar]
- 14.Hu K, Liang M. Upregulated microRNA-224 promotes ovarian cancer cell proliferation by targeting KLLN. In Vitro Cell Dev Biol Anim. 2017;53:149–156. doi: 10.1007/s11626-016-0093-2. [DOI] [PubMed] [Google Scholar]
- 15.Huang Y, Li Y, Wang FF, Lv W, Xie X, Cheng X. Over-expressed miR-224 promotes the progression of cervical cancer via targeting RASSF8. PLoS One. 2016;11:e0162378. doi: 10.1371/journal.pone.0162378. [DOI] [PMC free article] [PubMed] [Google Scholar]
- 16.Liu F, Liu Y, Shen J, Zhang G, Han J. MicroRNA-224 inhibits proliferation and migration of breast cancer cells by down-regulating Fizzled 5 expression. Oncotarget. 2016;7:49130–49142. doi: 10.18632/oncotarget.9734. [DOI] [PMC free article] [PubMed] [Google Scholar]
- 17.Zhang Y, Li CF, Ma LJ, Ding M, Zhang B. MicroRNA-224 aggrevates tumor growth and progression by targeting mTOR in gastric cancer. Int J Oncol. 2016;49:1068–1080. doi: 10.3892/ijo.2016.3581. [DOI] [PubMed] [Google Scholar]
- 18.Geng S, Gu L, Ju F, Zhang H, Wang Y, Tang H, Bi Z, Yang C. MicroRNA-224 promotes the sensitivity of osteosarcoma cells to cisplatin by targeting Rac1. J Cell Mol Med. 2016;20:1611–1619. doi: 10.1111/jcmm.12852. [DOI] [PMC free article] [PubMed] [Google Scholar] [Retracted]
- 19.Li T, Lai Q, Wang S, Cai J, Xiao Z, Deng D, He L, Jiao H, Ye Y, Liang L, Ding Y, Liao W. MicroRNA-224 sustains Wnt/beta-catenin signaling and promotes aggressive phenotype of colorectal cancer. J Exp Clin Cancer Res. 2016;35:21. doi: 10.1186/s13046-016-0287-1. [DOI] [PMC free article] [PubMed] [Google Scholar]
- 20.Cui R, Kim T, Fassan M, Meng W, Sun HL, Jeon YJ, Vicentini C, Tili E, Peng Y, Scarpa A, Liang G, Zhang YK, Chakravarti A, Croce CM. MicroRNA-224 is implicated in lung cancer pathogenesis through targeting caspase-3 and caspase-7. Oncotarget. 2015;6:21802–21815. doi: 10.18632/oncotarget.5224. [DOI] [PMC free article] [PubMed] [Google Scholar]
- 21.Ni H, Wang X, Liu H, Tian F, Song G. Low expression of miRNA-224 predicts poor clinical outcome in diffuse large B-cell lymphoma treated with R-CHOP. Biomarkers. 2015;20:253–257. doi: 10.3109/1354750X.2015.1068855. [DOI] [PubMed] [Google Scholar]
- 22.He X, Zhang Z, Li M, Li S, Ren L, Zhu H, Xiao B, Shi R. Expression and role of oncogenic miRNA-224 in esophageal squamous cell carcinoma. BMC Cancer. 2015;15:575. doi: 10.1186/s12885-015-1581-6. [DOI] [PMC free article] [PubMed] [Google Scholar]
- 23.Wang M, Deng X, Ying Q, Jin T, Li M, Liang C. MicroRNA-224 targets ERG2 and contributes to malignant progressions of meningioma. Biochem Biophys Res Commun. 2015;460:354–361. doi: 10.1016/j.bbrc.2015.03.038. [DOI] [PubMed] [Google Scholar]
- 24.Lu S, Wang S, Geng S, Ma S, Liang Z, Jiao B. Upregulation of microRNA-224 confers a poor prognosis in glioma patients. Clin Transl Oncol. 2013;15:569–574. doi: 10.1007/s12094-012-0972-2. [DOI] [PubMed] [Google Scholar]
- 25.Wan Y, Zeng ZC, Xi M, Wan S, Hua W, Liu YL, Zhou YL, Luo HW, Jiang FN, Zhong WD. Dysregulated microRNA-224/apelin axis associated with aggressive progression and poor prognosis in patients with prostate cancer. Hum Pathol. 2015;46:295–303. doi: 10.1016/j.humpath.2014.10.027. [DOI] [PubMed] [Google Scholar]
- 26.Boguslawska J, Wojcicka A, Piekielko-Witkowska A, Master A, Nauman A. MiR-224 targets the 3’UTR of type 1 5’-iodothyronine deiodinase possibly contributing to tissue hypothyroidism in renal cancer. PLoS One. 2011;6:e24541. doi: 10.1371/journal.pone.0024541. [DOI] [PMC free article] [PubMed] [Google Scholar]
- 27.Scisciani C, Vossio S, Guerrieri F, Schinzari V, De Iaco R, D’Onorio de Meo P, Cervello M, Montalto G, Pollicino T, Raimondo G, Levrero M, Pediconi N. Transcriptional regulation of miR-224 upregulated in human HCCs by NFkappaB inflammatory pathways. J Hepatol. 2012;56:855–861. doi: 10.1016/j.jhep.2011.11.017. [DOI] [PubMed] [Google Scholar]
- 28.Li Q, Ding C, Chen C, Zhang Z, Xiao H, Xie F, Lei L, Chen Y, Mao B, Jiang M, Li J, Wang D, Wang G. miR-224 promotion of cell migration and invasion by targeting Homeobox D 10 gene in human hepatocellular carcinoma. J Gastroenterol Hepatol. 2014;29:835–842. doi: 10.1111/jgh.12429. [DOI] [PubMed] [Google Scholar]
- 29.Zhang GJ, Zhou H, Xiao HX, Li Y, Zhou T. Up-regulation of miR-224 promotes cancer cell proliferation and invasion and predicts relapse of colorectal cancer. Cancer Cell Int. 2013;13:104. doi: 10.1186/1475-2867-13-104. [DOI] [PMC free article] [PubMed] [Google Scholar]
- 30.Song G, Gu L, He B, Pan Y, Wang S. [Expression of miR-224 in diffuse large B cell lymphoma and its clinical significance] . Zhonghua Xue Ye Xue Za Zhi. 2014;35:619–622. doi: 10.3760/cma.j.issn.0253-2727.2014.07.011. [DOI] [PubMed] [Google Scholar]
- 31.Lin ZY, Huang YQ, Zhang YQ, Han ZD, He HC, Ling XH, Fu X, Dai QS, Cai C, Chen JH, Liang YX, Jiang FN, Zhong WD, Wang F, Wu CL. MicroRNA-224 inhibits progression of human prostate cancer by downregulating TRIB1. Int J Cancer. 2014;135:541–550. doi: 10.1002/ijc.28707. [DOI] [PubMed] [Google Scholar]
- 32.Zhi F, Shao N, Li B, Xue L, Deng D, Xu Y, Lan Q, Peng Y, Yang Y. A serum 6-miRNA panel as a novel non-invasive biomarker for meningioma. Sci Rep. 2016;6:32067. doi: 10.1038/srep32067. [DOI] [PMC free article] [PubMed] [Google Scholar]
- 33.Liu H, Li P, Li B, Sun P, Zhang J, Wang B, Jia B. RKIP suppresses gastric cancer cell proliferation and invasion and enhances apoptosis regulated by microRNA-224. Tumour Biol. 2014;35:10095–10103. doi: 10.1007/s13277-014-2303-4. [DOI] [PubMed] [Google Scholar]
- 34.Ke TW, Hsu HL, Wu YH, Chen WT, Cheng YW, Cheng CW. MicroRNA-224 suppresses colorectal cancer cell migration by targeting Cdc42. Dis Markers. 2014;2014:617150. doi: 10.1155/2014/617150. [DOI] [PMC free article] [PubMed] [Google Scholar]
- 35.Wang Y, Toh HC, Chow P, Chung AY, Meyers DJ, Cole PA, Ooi LL, Lee CG. MicroRNA-224 is up-regulated in hepatocellular carcinoma through epigenetic mechanisms. FASEB J. 2012;26:3032–3041. doi: 10.1096/fj.11-201855. [DOI] [PMC free article] [PubMed] [Google Scholar]
- 36.Zhang Y, Takahashi S, Tasaka A, Yoshima T, Ochi H, Chayama K. Involvement of microRNA-224 in cell proliferation, migration, invasion, and anti-apoptosis in hepatocellular carcinoma. J Gastroenterol Hepatol. 2013;28:565–575. doi: 10.1111/j.1440-1746.2012.07271.x. [DOI] [PubMed] [Google Scholar]
- 37.Ma D, Tao X, Gao F, Fan C, Wu D. miR-224 functions as an onco-miRNA in hepatocellular carcinoma cells by activating AKT signaling. Oncol Lett. 2012;4:483–488. doi: 10.3892/ol.2012.742. [DOI] [PMC free article] [PubMed] [Google Scholar]
- 38.Yu L, Zhang J, Guo X, Li Z, Zhang P. MicroRNA-224 upregulation and AKT activation synergistically predict poor prognosis in patients with hepatocellular carcinoma. Cancer Epidemiol. 2014;38:408–413. doi: 10.1016/j.canep.2014.05.001. [DOI] [PubMed] [Google Scholar]
- 39.Lim YH, Bacchiocchi A, Qiu J, Straub R, Bruckner A, Bercovitch L, Narayan D Yale Center for Mendelian Genomics. McNiff J, Ko C, Robinson-Bostom L, Antaya R, Halaban R, Choate KA. GNA14 somatic mutation causes congenital and sporadic vascular tumors by MAPK activation. Am J Hum Genet. 2016;99:443–450. doi: 10.1016/j.ajhg.2016.06.010. [DOI] [PMC free article] [PubMed] [Google Scholar]
- 40.Oshima H, Ishikawa T, Yoshida GJ, Naoi K, Maeda Y, Naka K, Ju X, Yamada Y, Minamoto T, Mukaida N, Saya H, Oshima M. TNF-alpha/TNFR1 signaling promotes gastric tumorigenesis through induction of Noxo1 and Gna14 in tumor cells. Oncogene. 2014;33:3820–3829. doi: 10.1038/onc.2013.356. [DOI] [PubMed] [Google Scholar]


