

Abstract
Background and objective: Bisphenol A (BPA) disturbs the metabolism in animals and humans through effecting endocrine system. The role of BPA in obesity is not studied well. Therefore, current study is conducted to investigate its association with childhood obesity. Methods: Using gas chromatography-mass spectrometry (GC-MS/MS) serum BPA level was measured in 177 (120 normal and 57 obese) Saudi children. Results: The analyses of the data revealed an elevated level of serum BPA, leptin, systolic blood pressure, triglyceride, insulin and vitamin D in obese children as compare to normal controls. An elevated serum BPA did not show association with increased vitamin D and insulin while positively associated with some of the key markers of obesity. BPA was also positively associated with laptin, insulin and diastolic blood pressure in individuals of both normal and obese groups but with little statistical differences. Conclusion: Higher BPA level in obese children reveals that it may involve in the childhood obesity as it has shown a significant association with the key makers of the obesity in obese children especially in boys.
Keywords: BPA, obesity, Saudi children
Introduction
In last decade, it has been hypothesized that some anthropogenic chemicals act as obesogenic [1-3] thus there are major concerns regarding chemicals that may act as endocrine disrupters. Bisphenol-A (BPA) is an endocrine disrupting chemical (EDC) used extensively in the plastics industry, such as polycarbonate plastics, plastic packaging and water bottles [4,5]. Most of the people worldwide have detectable levels of BPA in their blood or urine indicating a ubiquitous exposure [6,7]. Furthermore, BPA induces obesity in rodents in experimental settings [8,9]. In humans urinary BPA is found to be related with obesity in adult boys and girls [10-13] but biochemical role of BPA in adulthood obesity is still needs to be investigated. Plastic products are extensively used in Saudi Arabia and obesity is also high. The prevalence of obesity has been increasing to an alarming rate. It has been observed that the prevalence of overweight and obesity among primary school male and female students is 7.3% and 17.4% and 12.4% and 20.9% respectively. Among Saudi regions the primary school students in Tabuk are 9.7% overweight and 19% obese [14]. Moreover, the prevalence of obesity in Saudi adolescent boys is significantly higher than the girls [15].
To the best of our knowledge the exposure of BPA and its association with childhood obesity study has never been reported anywhere in the world. Therefore, keeping in mind the role of BPA in obesity, the current study was performed to evaluate its association with childhood obesity in Saudi population. Gender based analysis of its association was also investigated and further we hypothesized that the association of BPA with obesity varies in boys and girls.
Materials and methods
Study population
A total of 177 Saudi children (57 obese and 120 non-obese, age 13-16 years old) were recruited from different public and private schools in Riyadh, Saudi Arabia. For conducting this research an ethical approval was obtained from Ethics Committee of the College of Science Research Center, King Saud University, Riyadh, Saudi Arabia. Permission was also obtained from the Ministry of Education and the principals of the selected schools. Informed written consents were taken from the parents and the participants of the study.
Anthropometrics
Anthropometrics were done at different times according to the break hours of the students. Physical examination was carried out by the attending school physician and nurse to determine whether the participants fulfil the inclusion criteria. Weight and height of the participants were recorded using an appropriate international standard scale (Digital Pearson Scale, ADAM Equipment Inc., USA). Waist, hip and arm circumferences were measured by a non-stretchable tape. Blood pressure was measured twice with an interval of 15 minutes using standardized mercury sphygmomanometer. The mean systolic and diastolic blood pressure of two measurements was noted. The general and central obesity was measured using BMI and waist circumference, respectively.
Cut-offs
The cutoffs for age specific and gender based overweight and obesity were used as proposed for adolescents by Cole and colleagues [16]. Cut-offs for pediatric subjects from the IDF diagnosis of metabolic syndrome was used for LDL-cholesterol, fasting blood glucose and triglycerides [17].
Blood sampling and biochemical assessments
The individuals who fulfilled the inclusion criteria were asked to complete the questionnaire and advised to return school’s clinic on the following day without having breakfast for blood withdrawal. 3-5 cc blood samples were collected and centrifuged on site to isolate serum and delivered immediately to Prince Mutaib Chair for Biomarkers of Osteoporosis (PMCO), Biochemistry Department, King Saud University in Riyadh, Saudi Arabia, for storage and analysis. Fasting blood glucose and lipid profile were measured as a routine analysis. Serum 25-hydroxyvitamin D was measured using COBAS e-411 automated analyzer (Roche Diagnostics, Indianapolis, IN, USA) in a DEQAS-certified laboratory (PMCO). For serum 25-hydroxyvitamin D assay, the inter- and intra-assay coefficients of variation (CV) were 8.0% and 5.6%, respectively, with a lower detection limit (LOD) of < 4 ng/ml).
Serum BPA concentration
BPA concentration level in serum samples (0.3 ml) was measured by gas chromatography coupled with mass spectrometry detector (GC-MS/MS) [18]. The limit of detection (LOD) was 0.1 ng mL-1 based upon a lower calibration standard (0.3 ng mL-1) which gave an instrument signal to noise response of 3:1. The quality control analysis was maintained by analyzing a method blank (serum) and two spiked serum samples 10 ng mL-1, after every 15 samples run in the GC-MS/MS system. Serum BPA was detected in 174 (98%) of the total 177 analyzed samples.
Statistical analysis
Data were analyzed using SPSS (version 22, Chicago, IL, USA) and continuous data were presented as mean ± standard deviation (SD), the gaussian variables and non-gaussian variables were presented in median (1st and 3rd) percentiles. Categorical data were presented as frequencies and percentages (%). All continuous variables were checked for normality using Kolmogorov-Smirnov test, if did not find normal then Non Gaussian variables transform to log & square root transformation. Independent t test was applied to check mean difference in Gaussian variables while Mann Whitney-U test was used for non-Gaussian variables. Relations among variables were sought by Spearman’s & Pearson correlation coefficient for Gaussian and non-Gaussian variables. P-value < 0.05 was considered statistically significant.
Results
Total 57 obese children were investigated for association of serum BPA with the obesity markers and data obtained were compared with 120 ethnically and age matched non-obese controls collected from general population of Riyadh. Different parameters were studied including BMI, waist, hips, SBP, DBP, total cholesterol, glucose, HDL-cholesterol, LDL-cholesterol, triglycerides, insulin, leptin, and BPA. The obesity related biochemical markers were significantly higher in obese children than the normal controls. Thus, as compared to non-obese controls, obese have significantly higher level of BMI (19.36 ± 2.50 vs. 27.88 ± 3.99 kg/m2, P ≤ 0.001), Waist (73.56 ± 10.07 vs. 90.42 ± 10.45 cm, P ≤ 0.001), circumference (89.29 ± 8.20 vs. 106.91 ± 9.16 cm, P ≤ 0.001), SBP (113.03 ± 15.87 vs. 119.39 ± 16.37 mmHg, P = 0.016), HDL-cholesterol (1.16 ± 0.24 vs. 1.08 ± 0.22 mmol/l, P = 0.032), Triglyceride (0.85 (0.63-1.16) vs. 1.03 (0.81-1.29) mmol/l, P = 0.008), and leptin (10.25 (3.75-20.9) vs. 16.72 (13.20-45.42) ng/ml, P ≤ 0.001) for healthy and obese children, respectively Table 1.
Table 1.
General characterization of subjects included in this study
| Parameter | Normal | Obesity | P-Value | P-value* |
|---|---|---|---|---|
| N (Boys/girls) | 120 (51/69) | 57 (29/28) | ||
| Age (years) | 14.25 ± 1.89 | 14.7 ± 1.28 | 0.705 | --- |
| Body Mass Index (kg/m2) | 19.36 ± 2.50 | 27.88 ± 3.99 | < 0.001 | --- |
| Waist circumference (cm) | 73.56 ± 10.07 | 90.42 ± 10.45 | < 0.001 | 0.779 |
| Hip circumference (cm) | 89.29 ± 8.20 | 106.91 ± 9.16 | < 0.001 | 0.849 |
| WHR | 0.82 ± 0.08 | 0.86 ± 0.08 | 0.006 | 0.499 |
| Systolic Blood Pressure (mmHg) | 113.03 ± 15.9 | 119.9 ± 16.7 | 0.012 | 0.496 |
| Diastolic Blood Pressure (mmHg) | 71.17 ± 12.02 | 70.38 ± 11.85 | 0.687 | 0.836 |
| Total Cholesterol (mmol/l) | 4.65 ± 0.90 | 4.82 ± 0.73 | 0.232 | 0.180 |
| Glucose (mmol/l) | 5.11 ± 0.56 | 5.21 ± 0.63 | 0.297 | 0.236 |
| HDL-Cholesterol (mmol/l) | 1.16 ± 0.24 | 1.08 ± 0.22 | 0.032 | 0.739 |
| LDL-Cholesterol (mmol/l) | 3.03 ± 0.74 | 3.22 ± 0.59 | 0.104 | 0.126 |
| Triglyceride (mmol/l)# | 0.85 (0.63-1.16) | 1.03 (0.81-1.29) | 0.008 | 0.564 |
| 25 (OH) Vitamin D (nmol/l)# | 24.1 (18.7-32.5) | 24.2 (18.2-31.2) | 0.414 | 0.240 |
| BPA (ng/ml)# | 1.89 (1.32-2.62) | 1.65 (1.07-2.44) | 0.184 | 0.840 |
| Insulin (pg/ml)# | 516.69 ± 210.44 | 606.65 ± 281.46 | 0.187 | 0.085 |
| Leptin (ng/ml)# | 10.25 (3.75-20.9 | 16.72 (13.20-45.42) | < 0.001 | 0.164 |
Note: Data presented as mean ± standard deviation & median (25th -75th) percentile for Non Gaussian variables (# represent non Gaussian); P-Value denotes significance at < 0.05 and 0.01 level.
indicates P-values adjusted for age, gender and BMI.
Further, we studied sex based differences; obese boys have significantly higher systolic blood pressure (P = 0.025), LDL-cholesterol (P = 0.045) and leptin (P ≤ 0.001) than the healthy boys while obese girls have significantly higher levels of HDL-cholesterol (P < 0.05) and leptin (P ≤ 0.001) than the healthy girls (P ≤ 0.001) Table 2.
Table 2.
Gender based analysis on effect of BPA on obesity and its markers
| Parameter | Boys | P-Value | Girls | P-Value | ||
|---|---|---|---|---|---|---|
|
|
|
|||||
| Normal | Obese | Normal | Obese | |||
| N | 51 (63.8) | 29 (36.3) | 69 (71.1) | 28 (28.9) | ||
| Age (years) | 13.9 ± 0.9 | 14.0 ± 1.0 | 0.588 | 14.5 ± 1.3 | 14.4 ± 1.5 | 0.594 |
| Body Mass Index (kg/m2) | 18.9 ± 2.4 | 28.0 ± 4.1 | < 0.001 | 19.8 ± 2.5 | 27.8 ± 4.0 | < 0.001 |
| Waist circumference (cm) | 73.8 ± 6.5 | 93.9 ± 9.5 | < 0.001 | 73.5 ± 11.4 | 88.2 ± 10.6 | < 0.001 |
| Hip circumference (cm) | 85.7 ± 6.9 | 105.8 ± 9.8 | < 0.001 | 91.0 ± 8.2 | 107.6 ± 8.8 | < 0.001 |
| WHR | 0.9 ± 0.1 | 0. 9 ± 0.1 | 0.045 | 0.8 ± 0.1 | 0.8 ± 0.1 | 0.038 |
| Systolic Blood Pressure (mmHg) | 119.5 ± 15.0 | 125.9 ± 14.4 | 0.025 | 108.2 ± 14.9 | 112.9 ± 15.9 | 0.178 |
| Diastolic Blood Pressure (mmHg) | 73.8 ± 14.1 | 69.4 ± 11.9 | 0.171 | 69.2 ± 9.8 | 71.4 ± 11.9 | 0.363 |
| Total Cholesterol (mmol/l) | 4.5 ± 0.9 | 4.7 ± 0.7 | 0.122 | 4.8 ± 0.9 | 4.9 ± 0.8 | 0.619 |
| Glucose (mmol/l) | 5.3 ± 0.5 | 5.3 ± 0.5 | 0.723 | 5.0 ± 0.6 | 5.2 ± 0.7 | 0.209 |
| HDL-Cholesterol (mmol/l) | 1.1 ± 0.2 | 1.1 ± 0.3 | 0.882 | 1.2 ± 0.3 | 1.0 ± 0.2 | 0.005 |
| LDL-Cholesterol (mmol/l) | 2.9 ± 0.8 | 3.2 ± 0.5 | 0.045 | 3.1 ± 0.7 | 3.2 ± 0.7 | 0.525 |
| Triglyceride (mmol/l)# | 0.8 ± 0.3 | 1.1 ± 0.4 | 0.011 | 0.9 ± 0.3 | 1.2 ± 0.5 | 0.011 |
| 25 (OH) Vitamin D (nmol/l) | 35.4 ± 13.3 | 28.2 ± 11.1 | 0.028 | 21.7 ± 7.5 | 23.1 ± 7.8 | 0.445 |
| BPA (ng/ml)# | 2.4 (1.6-3.4) | 1.9 (1.3-2.8) | 0.249 | 1.6 (1.2-2.2) | 1.4 (1.0-1.8) | 0.155 |
| Insulin (pg/ml) | 377.5 ± 83.1 | 445.8 ± 175.2 | 0.294 | 613.1 ± 218.8 | 745.9 ± 209.2 | 0.187 |
| Leptin (ng/ml)# | 3.4 (1.5-8.7) | 13.5 (11.7-18.4) | < 0.001 | 16.2 (8.6-23.7) | 54.7 (18.4-62.9) | < 0.001 |
Note: Data presented as mean ± standard deviation & median (25th -75th) percentile for Non Gaussian variables;
indicates non-normal variables;
P-Value denotes significance at < 0.05 and 0.01 level.
We performed correlation analyses of BPA with other parameters in obese and normal children which revealed a significant (P < 0.05) association with BMI (-0.230), systolic blood pressure (SBP) (0.234), insulin (-0.311) and leptin (-0.634) in normal children. The analysis of obese children showed that BPA positively correlated with Hip (0.317), while negatively insulin (-0.755) and leptin (-0.446) (Figure 1). Gender based analyses showed, WHR (-0.417), SBP (-0.517), glucose (-0.364) and 25OH-vitaminD (-0.398) has significant (P < 0.05) correlation in normal boys while on the other hand total cholesterol (0.315) and LDL-cholesterol (0.278) showed significant correlation with normal girls. Glucose (-0.405) and insulin (-0.680) showed significant negative correlation in obese boys while LDL-cholesterol showed significant correlation with obesity in girls (0.408) Table 3.
Figure 1.
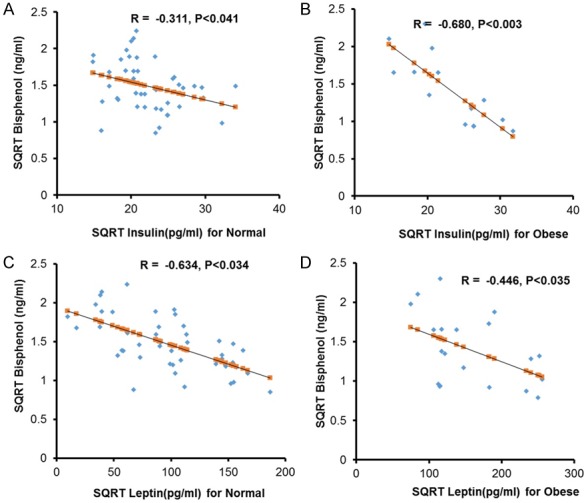
Association of Bisphenol with Leptin and Insulin. (A) Showing negative correlation between BPA and Insulin in normal controls. (B) Showing strong negative correlation between BPA and Insulin in obese children. (C) BPA is negatively associated with Leptin in normal controls and (D) Obese children.
Table 3.
Correlation between BPA level and biochemical parameters
| Parameter | Normal | Obesity | ||||
|---|---|---|---|---|---|---|
|
| ||||||
| 93 (Boys/girls) | 57 (Boys/girls) | |||||
|
| ||||||
| All | Boys | Girls | All | Boys | Girls | |
| N | 120 | 51 | 69 | 57 | 29 | 28 |
| Age (years) | 0.032 | 0.174 | 0.172 | -0.047 | -0.105 | 0.142 |
| Body Mass Index (kg/m2) | -0.230** | -0.226 | -0.162 | 0.108 | 0.181 | 0.009 |
| Waist circumference (cm) | -0.108 | -0.261 | -0.070 | 0.172 | 0.120 | 0.126 |
| Hip circumference (cm) | -0.155 | 0.034 | -0.192 | 0.107 | 0.020 | 0.187 |
| WHR | 0.029 | -0.417* | 0.138 | 0.317* | 0.166 | 0.350 |
| Systolic Blood Pressure (mmHg) | 0.234** | 0.517** | -0.234 | 0.087 | 0.160 | -0.353 |
| Diastolic Blood Pressure (mmHg) | 0.127 | 0.040 | 0.106 | 0.084 | 0.032 | 0.276 |
| Total Cholesterol (mmol/l) | 0.013 | -0.060 | 0.315* | 0.034 | -0.187 | 0.360 |
| Glucose (mmol/l) | -0.031 | -0.364** | 0.073 | -0.117 | -0.405* | 0.156 |
| HDL-Cholesterol (mmol/l) | -0.007 | 0.171 | 0.037 | -0.015 | -0.119 | 0.155 |
| LDL-Cholesterol (mmol/l) | -0.043 | -0.156 | 0.278* | 0.104 | -0.125 | 0.408* |
| Triglyceride (mmol/l)# | -0.041 | 0.046 | 0.009 | -0.089 | -0.135 | 0.059 |
| 25 (OH) Vitamin D (nmol/l)# | 0.025 | -0.398** | 0.151 | -0.050 | -0.333 | 0.149 |
| Insulin (pg/ml)# | -0.311* | 0.136 | 0.271 | -0.755** | -0.680** | -0.735 |
| Leptin (pg/ml)# | -0.634* | -0.335 | -0.353 | -0.446* | -0.014 | -0.116 |
Note: Data presented as coefficient (R);
denotes significance at 0.05 level;
denotes significance at 0.01 level;
denotes Non Gaussian variables.
Discussion
Childhood obesity is an epidemic worldwide, both in advanced and developing countries. The underlying mechanisms causing obesity are not fully understood yet but it is believed as multifactorial disorder including age, sex, lifestyles and environmental factor such as pollutants exposure etc. Exposure to endocrine disruptors not only increases the risk of metabolic and cardiovascular diseases (CVD) but it has also been associated with the obesity. In addition to lifestyle and environmental factors, chemicals agents acting as endocrine disruptors may cause childhood obesity [19]. Several studies have confirmed that the exposure to BPA increases body weight and adiposity [20-22]. Few studies have examined the association of urinary BPA and obesity in humans [11,23,24], while recently a study has showed the association between exposure to BPA with cardio metabolic and obesity in children [25]. To best of our knowledge, no other similar studies have been conducted so far on the association between serum BPA level and childhood obesity. As it is well known that BPA act as endocrine disrupting agent and also effect the metabolism in human and other animals. Therefore, we believe that BPA must have association with obesity or its associated factors.
Hence, in current study we examined the exposure and association of serum BPA concentrations with childhood obesity in 177 children from Saudi Arabia (57 Obese and 120 non-obese control subjects). The results of the study showed a higher serum BPA concentration in overweight and obese. Serum BPA level was significantly associated with increasing LDL-cholesterol in girls only, while in boys the level of BPA decreased with glucose and insulin levels. These results are suggestive that BPA exposure in children, can lead to adverse metabolic effects and high systolic blood pressure. The mean serum BPA concentrations in the obese children was in average 2.24 ng/ml range (1.45 to 3.01 ng/ml), as compared to 4.4 ng/ml reported in US population based sample of children aged 6-19 years in 2009-2010 NHANES [26]. In the current study, results showed significant associations with several metabolic outcomes even at comparatively lower BPA concentrations.
Our results indicated that there is a negative correlation between BPA level and insulin levels, in both obese and normal control children, respectively. This relation reflects clearly and confirms that BPA can affect insulin secretion and this association could be explained by the ability of BPA to increase [27]. A similar trend was observed by Ropero et al [28]. They suggested that the BPA can exert effects on the insulin-secreting beta cells, as well as on the glucagon-secreting alpha cells of the pancreas. Furthermore, they reported that exposure of male mice to BPA for 4 days leads to hyperinsulinemia and then to insulin resistance [28,29]. An early study reported that the exposure to a chemical pollutants can cause obesity in women [30] BPA exposure may have effects on body weight. Sex- and dose- dependent differences in body weight in response to early postnatal exposure to DES, an estrogenic compound with structural similarities to BPA have been reported [31]. The evidences of relations between BPA level and obesity in human are not much frequently available. various studies have reported an association between environmental chemicals exposure and the development of obesity [1,32-35] Mechanistic studies suggested that the disruptive effects of endocrine disrupting chemicals are exerted on adipocyte development [36,37]. In current study serum leptin level increased in both obese boys and girls but girls have significantly higher level; overall increased level of BPA has been associated with the increase in Leptin level. This is consistent with results of an experimental study conducted by Wei et al. in which leptin levels were increased in perinatal BPA-treated offspring [38]. On the other hand, serum leptin levels in mice were lower in the female offspring of dams exposed to BPA than in the offspring of control dams [39].
The main strengths of our study include its representation of young children and the availability of extensive data on metabolic and hormonal profiles of the candidates. To the best of our knowledge, this is the first ever report on an association between BPA exposure-response with metabolic and hormonal changes in obese Saudi children. However, there is a limitation i.e. this is the small sample size for a robust statistical analysis. Further, a study on a larger sample size with robust statistical analysis is recommended.
Acknowledgements
The study was funded by Prince Mutaib Chair for Biomarkers of Osteoporosis (PMCO), Deanship of Research Chairs in King Saud University, Riyadh, Saudi Arabia.
Disclosure of conflict of interest
None.
References
- 1.Baillie-Hamilton PF. Chemical toxins: a hypothesis to explain the global obesity epidemic. J Altern Complement Med. 2002;8:185–192. doi: 10.1089/107555302317371479. [DOI] [PubMed] [Google Scholar]
- 2.Grun F, Blumberg B. Endocrine disrupters as obesogens. Mol Cell Endocrinol. 2009;304:19–29. doi: 10.1016/j.mce.2009.02.018. [DOI] [PMC free article] [PubMed] [Google Scholar]
- 3.Ronn M, Lind L, Orberg J, Kullberg J, Soderberg S, Larsson A, Johansson L, Ahlstrom H, Lind PM. Bisphenol A is related to circulating levels of adiponectin, leptin and ghrelin, but not to fat mass or fat distribution in humans. Chemosphere. 2014;112:42–48. doi: 10.1016/j.chemosphere.2014.03.042. [DOI] [PubMed] [Google Scholar]
- 4.Calafat AM, Kuklenyik Z, Reidy JA, Caudill SP, Ekong J, Needham LL. Urinary concentrations of bisphenol A and 4-nonylphenol in a human reference population. Environ Health Perspect. 2005;113:391–395. doi: 10.1289/ehp.7534. [DOI] [PMC free article] [PubMed] [Google Scholar]
- 5.Cooper JE, Kendig EL, Belcher SM. Assessment of bisphenol A released from reusable plastic, aluminium and stainless steel water bottles. Chemosphere. 2011;85:943–947. doi: 10.1016/j.chemosphere.2011.06.060. [DOI] [PMC free article] [PubMed] [Google Scholar]
- 6.Olsen L, Lampa E, Birkholz DA, Lind L, Lind PM. Circulating levels of bisphenol A (BPA) and phthalates in an elderly population in Sweden, based on the Prospective Investigation of the Vasculature in Uppsala Seniors (PIVUS) Ecotoxicol Environ Saf. 2012;75:242–248. doi: 10.1016/j.ecoenv.2011.09.004. [DOI] [PubMed] [Google Scholar]
- 7.Vandenberg LN, Hauser R, Marcus M, Olea N, Welshons WV. Human exposure to bisphenol A (BPA) Reprod Toxicol. 2007;24:139–177. doi: 10.1016/j.reprotox.2007.07.010. [DOI] [PubMed] [Google Scholar]
- 8.Miyawaki J, Sakayama K, Kato H, Yamamoto H, Masuno H. Perinatal and postnatal exposure to bisphenol a increases adipose tissue mass and serum cholesterol level in mice. J Atheroscler Thromb. 2007;14:245–252. doi: 10.5551/jat.e486. [DOI] [PubMed] [Google Scholar]
- 9.Somm E, Schwitzgebel VM, Toulotte A, Cederroth CR, Combescure C, Nef S, Aubert ML, Huppi PS. Perinatal exposure to bisphenol a alters early adipogenesis in the rat. Environ Health Perspect. 2009;117:1549–1555. doi: 10.1289/ehp.11342. [DOI] [PMC free article] [PubMed] [Google Scholar]
- 10.Lang IA, Galloway TS, Scarlett A, Henley WE, Depledge M, Wallace RB, Melzer D. Association of urinary bisphenol A concentration with medical disorders and laboratory abnormalities in adults. JAMA. 2008;300:1303–1310. doi: 10.1001/jama.300.11.1303. [DOI] [PubMed] [Google Scholar]
- 11.Shankar A, Teppala S, Sabanayagam C. Urinary bisphenol a levels and measures of obesity: results from the national health and nutrition examination survey 2003-2008. ISRN Endocrinol. 2012;2012:965243. doi: 10.5402/2012/965243. [DOI] [PMC free article] [PubMed] [Google Scholar]
- 12.Wang T, Li M, Chen B, Xu M, Xu Y, Huang Y, Lu J, Chen Y, Wang W, Li X, Liu Y, Bi Y, Lai S, Ning G. Urinary bisphenol A (BPA) concentration associates with obesity and insulin resistance. J Clin Endocrinol Metab. 2012;97:E223–227. doi: 10.1210/jc.2011-1989. [DOI] [PubMed] [Google Scholar]
- 13.Harley KG, Aguilar Schall R, Chevrier J, Tyler K, Aguirre H, Bradman A, Holland NT, Lustig RH, Calafat AM, Eskenazi B. Prenatal and postnatal bisphenol A exposure and body mass index in childhood in the CHAMACOS cohort. Environ Health Perspect. 2013;121:514–520. doi: 10.1289/ehp.1205548. [DOI] [PMC free article] [PubMed] [Google Scholar]
- 14.Al-Enazy WH, Al-Enazy FS, Al-Enazy FA, Al-Qahtani MA. PREVALENCE Pervalence of overweight and obesity among Saudi primary school students Tabuk, Saudi Arabia. International Journal of Medical Science and Public Health. 2014;3:993–999. [Google Scholar]
- 15.Al-Daghri NM, Al-Saleh Y, Aljohani N, Alokail M, Al-Attas O, Alnaami AM, Sabico S, Alsulaimani M, Al-Harbi M, Alfawaz H, Chrousos GP. Vitamin D deficiency and cardiometabolic risks: A juxtaposition of arab adolescents and adults. PLoS One. 2015;10:e0131315. doi: 10.1371/journal.pone.0131315. [DOI] [PMC free article] [PubMed] [Google Scholar]
- 16.Cole TJ, Bellizzi MC, Flegal KM, Dietz WH. Establishing a standard definition for child overweight and obesity worldwide: international survey. BMJ. 2000;320:1240–1243. doi: 10.1136/bmj.320.7244.1240. [DOI] [PMC free article] [PubMed] [Google Scholar]
- 17.Kassi E, Pervanidou P, Kaltsas G, Chrousos G. Metabolic syndrome: definitions and controversies. BMC Med. 2011;9:48. doi: 10.1186/1741-7015-9-48. [DOI] [PMC free article] [PubMed] [Google Scholar]
- 18.Geens T, Neels H, Covaci A. Sensitive and selective method for the determination of bisphenol-A and triclosan in serum and urine as pentafluorobenzoate-derivatives using GC-ECNI/MS. J Chromatogr B Analyt Technol Biomed Life Sci. 2009;877:4042–4046. doi: 10.1016/j.jchromb.2009.10.017. [DOI] [PubMed] [Google Scholar]
- 19.Khalil N, Ebert JR, Wang L, Belcher S, Lee M, Czerwinski SA, Kannan K. Bisphenol A and cardiometabolic risk factors in obese children. Sci Total Environ. 2014;470-471:726–732. doi: 10.1016/j.scitotenv.2013.09.088. [DOI] [PubMed] [Google Scholar]
- 20.Vom Saal FS, Nagel SC, Coe BL, Angle BM, Taylor JA. The estrogenic endocrine disrupting chemical bisphenol A (BPA) and obesity. Mol Cell Endocrinol. 2012;354:74–84. doi: 10.1016/j.mce.2012.01.001. [DOI] [PMC free article] [PubMed] [Google Scholar]
- 21.Rubin BS. Bisphenol A: an endocrine disruptor with widespread exposure and multiple effects. J Steroid Biochem Mol Biol. 2011;127:27–34. doi: 10.1016/j.jsbmb.2011.05.002. [DOI] [PubMed] [Google Scholar]
- 22.Rubin BS, Soto AM. Bisphenol A: Perinatal exposure and body weight. Mol Cell Endocrinol. 2009;304:55–62. doi: 10.1016/j.mce.2009.02.023. [DOI] [PMC free article] [PubMed] [Google Scholar]
- 23.Eng DS, Lee JM, Gebremariam A, Meeker JD, Peterson K, Padmanabhan V. Bisphenol A and chronic disease risk factors in US children. Pediatrics. 2013;132:e637–645. doi: 10.1542/peds.2013-0106. [DOI] [PMC free article] [PubMed] [Google Scholar]
- 24.Bhandari R, Xiao J, Shankar A. Urinary bisphenol A and obesity in U.S. children. Am J Epidemiol. 2013;177:1263–1270. doi: 10.1093/aje/kws391. [DOI] [PMC free article] [PubMed] [Google Scholar]
- 25.Vafeiadi M, Roumeliotaki T, Myridakis A, Chalkiadaki G, Fthenou E, Dermitzaki E, Karachaliou M, Sarri K, Vassilaki M, Stephanou EG, Kogevinas M, Chatzi L. Association of early life exposure to bisphenol A with obesity and cardiometabolic traits in childhood. Environ Res. 2016;146:379–387. doi: 10.1016/j.envres.2016.01.017. [DOI] [PubMed] [Google Scholar]
- 26.Trasande L, Attina TM, Blustein J. Association between urinary bisphenol A concentration and obesity prevalence in children and adolescents. JAMA. 2012;308:1113–1121. doi: 10.1001/2012.jama.11461. [DOI] [PubMed] [Google Scholar]
- 27.Alonso-Magdalena P, Ropero AB, Carrera MP, Cederroth CR, Baquie M, Gauthier BR, Nef S, Stefani E, Nadal A. Pancreatic insulin content regulation by the estrogen receptor ER alpha. PLoS One. 2008;3:e2069. doi: 10.1371/journal.pone.0002069. [DOI] [PMC free article] [PubMed] [Google Scholar]
- 28.Ropero AB, Alonso-Magdalena P, Garcia-Garcia E, Ripoll C, Fuentes E, Nadal A. Bisphenol-A disruption of the endocrine pancreas and blood glucose homeostasis. Int J Androl. 2008;31:194–200. doi: 10.1111/j.1365-2605.2007.00832.x. [DOI] [PubMed] [Google Scholar]
- 29.Alonso-Magdalena P, Morimoto S, Ripoll C, Fuentes E, Nadal A. The estrogenic effect of bisphenol A disrupts pancreatic beta-cell function in vivo and induces insulin resistance. Environ Health Perspect. 2006;114:106–112. doi: 10.1289/ehp.8451. [DOI] [PMC free article] [PubMed] [Google Scholar]
- 30.Power C, Jefferis BJ. Fetal environment and subsequent obesity: a study of maternal smoking. Int J Epidemiol. 2002;31:413–419. [PubMed] [Google Scholar]
- 31.Newbold RR, Padilla-Banks E, Jefferson WN, Heindel JJ. Effects of endocrine disruptors on obesity. Int J Androl. 2008;31:201–208. doi: 10.1111/j.1365-2605.2007.00858.x. [DOI] [PubMed] [Google Scholar]
- 32.Heindel JJ. Endocrine disruptors and the obesity epidemic. Toxicol Sci. 2003;76:247–249. doi: 10.1093/toxsci/kfg255. [DOI] [PubMed] [Google Scholar]
- 33.Heindel JJ, Levin E. Developmental origins and environmental influences--Introduction. NIEHS symposium. Birth Defects Res A Clin Mol Teratol. 2005;73:469. doi: 10.1002/bdra.20141. [DOI] [PubMed] [Google Scholar]
- 34.Newbold RR, Padilla-Banks E, Snyder RJ, Jefferson WN. Perinatal exposure to environmental estrogens and the development of obesity. Mol Nutr Food Res. 2007;51:912–917. doi: 10.1002/mnfr.200600259. [DOI] [PubMed] [Google Scholar]
- 35.Newbold RR, Padilla-Banks E, Snyder RJ, Phillips TM, Jefferson WN. Developmental exposure to endocrine disruptors and the obesity epidemic. Reprod Toxicol. 2007;23:290–296. doi: 10.1016/j.reprotox.2006.12.010. [DOI] [PMC free article] [PubMed] [Google Scholar]
- 36.Grun F, Blumberg B. Environmental obesogens: organotins and endocrine disruption via nuclear receptor signaling. Endocrinology. 2006;147:S50–55. doi: 10.1210/en.2005-1129. [DOI] [PubMed] [Google Scholar]
- 37.Grun F, Watanabe H, Zamanian Z, Maeda L, Arima K, Cubacha R, Gardiner DM, Kanno J, Iguchi T, Blumberg B. Endocrine-disrupting organotin compounds are potent inducers of adipogenesis in vertebrates. Mol Endocrinol. 2006;20:2141–2155. doi: 10.1210/me.2005-0367. [DOI] [PubMed] [Google Scholar]
- 38.Wei J, Lin Y, Li Y, Ying C, Chen J, Song L, Zhou Z, Lv Z, Xia W, Chen X, Xu S. Perinatal exposure to bisphenol A at reference dose predisposes offspring to metabolic syndrome in adult rats on a high-fat diet. Endocrinology. 2011;152:3049–3061. doi: 10.1210/en.2011-0045. [DOI] [PubMed] [Google Scholar]
- 39.Anderson OS, Peterson KE, Sanchez BN, Zhang Z, Mancuso P, Dolinoy DC. Perinatal bisphenol A exposure promotes hyperactivity, lean body composition, and hormonal responses across the murine life course. FASEB J. 2013;27:1784–1792. doi: 10.1096/fj.12-223545. [DOI] [PMC free article] [PubMed] [Google Scholar]