Abstract
Background: Increasing severity of carpal tunnel syndrome (CTS), as graded by nerve conduction studies (NCS), has been demonstrated to predict the speed and completeness of recovery after carpal tunnel release (CTR). The purpose of this study is to compare the cross-sectional area (CSA) of the median nerve in patients with severe and nonsevere CTS as defined by NCS. Methods: Ultrasound CSA measurements were taken at the carpal tunnel inlet at the level of the pisiform bone by a hand fellowship–trained orthopedic surgeon. Severe CTS on NCS was defined as no response for the distal motor latency (DML) and/or distal sensory latency (DSL). Results: A total of 274 wrists were enrolled in the study. The median age was 51 years (range: 18-90 years), and 72.6% of wrists were from female patients. CSA of median nerve and age were comparatively the best predictors of severity using a linear regression model and receiver operator curves. Using cutoff of 12 mm2 for severe CTS, the sensitivity and specificity are 37.5% and 81.9%, respectively. Conclusions: Ultrasound can be used to grade severity in younger patients (<65 years) with a CTS-6 score of >12.
Keywords: severity of carpal tunnel syndrome, role of ultrasound in diagnosis, carpal tunnel syndrome, test for severe carpal tunnel syndrome, measurement of the median nerve, median nerve cross-sectional area, nerve conduction studies
Introduction
Carpal tunnel syndrome (CTS) manifests as numbness, tingling, burning, and/or pain as a result of localized compression of the median nerve at the wrist.17 CTS is the most common peripheral compressive neuropathy1 accounting for 90% of all compressive neuropathies in the upper extremity.4 The estimated prevalence is 9.2% in females and 6% in males with approximately 500 000 decompressions per year.14 The prevalence of CTS is estimated at 3.8% of the general population,10 leading to substantial morbidity and work absenteeism.2 The ideal confirmatory diagnostic test needs to have high diagnostic accuracy and the ability to assess severity of disease.
The diagnosis of CTS is elicited from patient history and physical examination; electrodiagnostic test is used to confirm the diagnosis and grade severity.4 Currently, electrodiagnostic testing (EDX), specifically nerve conduction studies (NCS), is considered the reference standard for the detection of CTS. However, the procedure is uncomfortable to patients, time-consuming, and costly.8 According to the American Academy of Orthopaedic Surgeons (AAOS) evidence-based guidelines, there is limited evidence to support ultrasonography and NCS for the diagnosis for CTS.16 However, several experts in the field have proposed ultrasound (US) as a confirmatory test for CTS. US has the potential benefits of patient comfort, increased cost-effectiveness, and lack of pain. In addition, US has been proposed as a better confirmatory test for patients who meet certain criteria such as a positive Boston Carpal Tunnel Scale Questionnaire (BCTQ).2
NCS have the advantages of supplying objective evidence of nerve compression and the ability to grade the severity based on the degree of slowing. Increasing severity of CTS as graded by NCS has been demonstrated to predict the speed and completeness of recovery after carpal tunnel release.7 Although US measurement of the cross-sectional area (CSA) of the median nerve at the wrist has been demonstrated to have similar diagnostic accuracy to NCS in specific clinical scenarios,5,8 it is unclear whether US can be used to grade CTS severity in a similar manner to NCS. The purpose of this study is to evaluate whether ultrasound CSA of the median nerve can discriminate severe CTS based on NCS.
Methods
Participants
After institutional review board approval, patients with clinical signs and symptoms of CTS presenting to 1 of 3 hand fellowship–trained orthopedic surgeons were prospectively enrolled in the study. For clinical diagnosis of CTS, patients were asked to report numbness and tingling predominantly in a median nerve distribution with at least 2 of the following criteria: (1) Worsening of symptoms with activities of daily living such as driving a car, reading a book or magazine, or using a phone; (2) nocturnal symptoms; and (3) reproduction or aggravation of paresthesia or pain with provocative maneuvers on physical exam (carpal tunnel compression test, Phalen test, or Tinel test). These criteria have previously been applied in other studies.18,11 Exclusion criteria included diagnosis of cervical radiculopathy and/or peripheral neuropathy, history of prior ipsilateral carpal tunnel release, diagnosis of thyroid disorder, diagnosis of rheumatoid arthritis, chronic kidney disease, or clinical evidence of diabetic polyneuropathy. Patients with diabetes mellitus without polyneuropathy were not excluded.
Assessments
US measurement of the CSA of the median nerve was obtained at the carpal tunnel inlet at the level of the pisiform bone. The measurements were obtained by a fellowship-trained hand surgeon with extensive musculoskeletal diagnostic ultrasound experience. US examinations were performed using a 15-6 MHz linear array transducer (Sonosite M Turbo; Sonosite, Bothell, Washington), which was positioned perpendicular to the long axis of the forearm. Patients were positioned with the elbow flexed 90° and the dorsal forearm resting on the examination table with the forearm fully supinated. The CSA was measured just inside the hyperechoic epineurium using the ellipse function, a function of the US machine that places an ellipse over the area of interest and calculates the area within the ellipse. The CSA of the median nerve was reported to the nearest mm2. This technique has previously been utilized in related studies.5,6,8,13
Following US examination, a certified EDX physician who was blinded to the results of the US examination performed EDX using the guidelines of the American Association of Neuromuscular and Electrodiagnostic Medicine. This study was performed within 4 weeks of US examination, and no treatment or use of orthoses was performed between the US examination and EDX. For the purposes of this study, the final report of the EDX physician was used to determine whether the patient had an EDX diagnosis of CTS. Severe CTS was defined by no response on the distal sensory or distal motor latencies. The functional severity score (FSS), sensory severity score (SSS), and CTS-6 scores were calculated by a trained examiner who was blinded to the results of all the other tests. A CTS-6 score of ⩾12 was considered positive for CTS.9
Statistical Methods
Age, CSA, FSS, CTS-6, and SSS were compared between nonsevere and severe CTS using the Mann-Whitney U test. Multivariable logistic regression analysis using backward selection was used to identify independent predictors of severe CTS. All tests were 2-sided and P values <.05 were considered statistically significant. A receiver operating characteristic (ROC) curve analysis was performed to measure the ability of each of the aforementioned assessment to diagnose severe CTS. The ROC analysis was also conducted on subgroups to assess whether CSA was better at predicting severity in across different groups of age and CTS-6.
Results
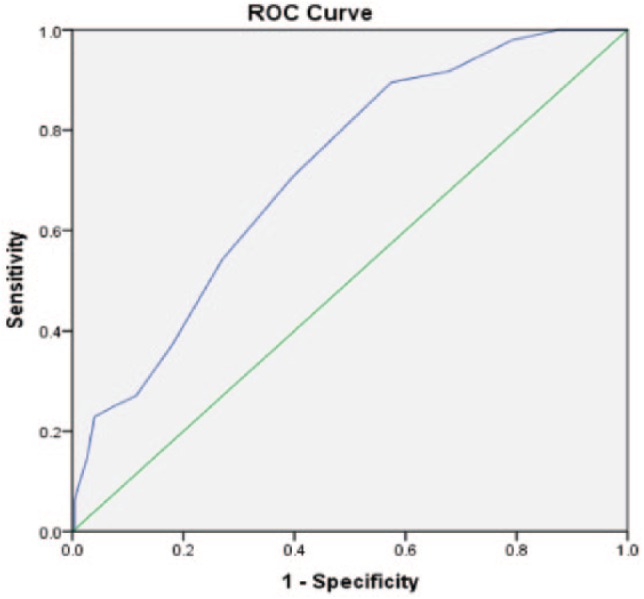
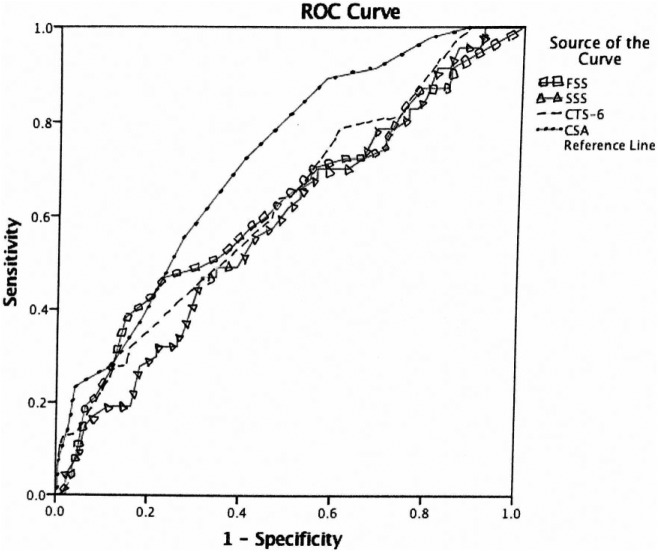
Of the 274 wrists included in the study, 226 (82.5%) had nonsevere CTS and 48 (17.5%) severe CTS. The median age was 51 years (range: 18-90 years), and 72.6% of wrists were from female patients. A comparison of studied variables between patients with nonsevere and severe CTS is shown in Table 1. Compared with nonsevere patients, patients with severe CTS were older, had increased CSA, increased FSS, and increased CTS-6 scores (all P < .05); there was no significant difference in SSS score between groups. Using multivariable logistic regression analysis with backward elimination (Table 2), age and CSA were the only statically significant independent predictors of severe CTS (all P < .001). The ROC curve analysis was utilized to assess diagnostic ability of each CTS assessment (Figure 1). The area under the curve (AUC) for each CTS assessment is listed in Table 3. CSA had the largest AUC = 0.719 (Figures 2-4) (95% confidence interval [CI], 0.634-0.793). Using a CSA cutoff of 12 mm2 for severe CTS, the sensitivity and specificity are 37.5% and 81.9%, respectively.
Table 1.
Comparison of Clinical Variables Between Nonsevere and Severe CTS.
| Variable | Severity (Median [Q1,
Q3]) |
P value | |
|---|---|---|---|
| Nonsevere | Severe | ||
| Age | 49 (40, 57) | 58.5 (50, 74.5) | <.001 |
| CSA | 10.0 (8.00, 12.0) | 12.0 (10.0, 14.75) | <.001 |
| FSS | 2.0 (1.38, 2.75) | 2.63 (1.60, 3.25) | .011 |
| CTS-6 | 13.0 (7.50, 16.5) | 16.5 (12.5, 21.0) | .007 |
| 2.82 (2.18, 3.55) | 3.09 (2.36, 3.73) | .063 | |
Note. CTS = carpal tunnel syndrome; Q1 = quartile 1; Q3 = quartile 3; CSA = cross-sectional area; FSS = functional severity score.
Table 2.
Multivariate Logistic Regression Using Backward Elimination Model.
| Odds ratio (95% CI) | P value | |
|---|---|---|
| CSA | 1.221 (1.092-1.364) | <.001 |
| Age | 1.057 (1.030-1.085) | <.001 |
| CTS-6 | 1.067 (1.002-1.136) | .044 |
Note. CI = confidence interval; CSA = cross-sectional area; CTS = Carpal tunnel syndrome.
Figure 1.
ROC curve for each carpal tunnel syndrome assessment.
Note. Diagonal segments are produced by ties. ROC = receiver operating characteristic; FSS = functional severity score; SSS = sensory severity score; CTS = Carpal tunnel syndrome; CSA = cross-sectional area.
Table 3.
Area Under the Curve for Each Carpal Tunnel Syndrome Assessment.
| Test result variable(s) | Area | Asymptotic 95% confidence
interval |
|
|---|---|---|---|
| Lower bound | Upper bound | ||
| FSS | 0.617 | 0.523 | 0.711 |
| SSS | 0.584 | 0.496 | 0.673 |
| CTS-6 | 0.625 | 0.538 | 0.713 |
| CSA | 0.719 | 0.644 | 0.793 |
Note. FSS = functional severity score; SSS = sensory severity score; CTS = Carpal tunnel syndrome; CSA = cross-sectional area.
Figure 2.

ROC curve for cross-sectional area.
Note. Diagonal segments are produced by ties. ROC = receiver operating characteristic.
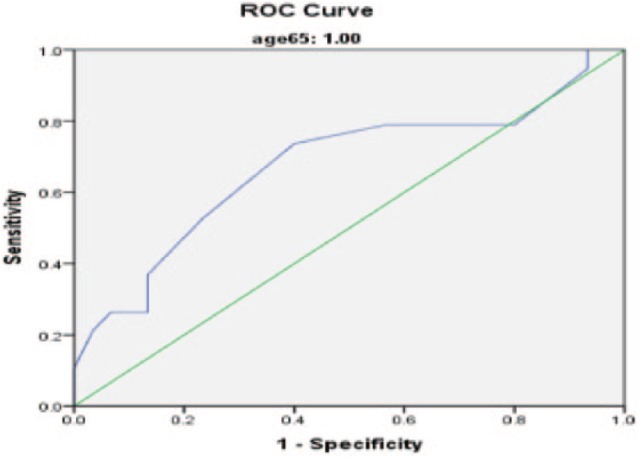
Figure 3.

ROC curve of cross-sectional area in ages >65 years.
Note. Diagonal segments are produced by ties. ROC = receiver operating characteristic.
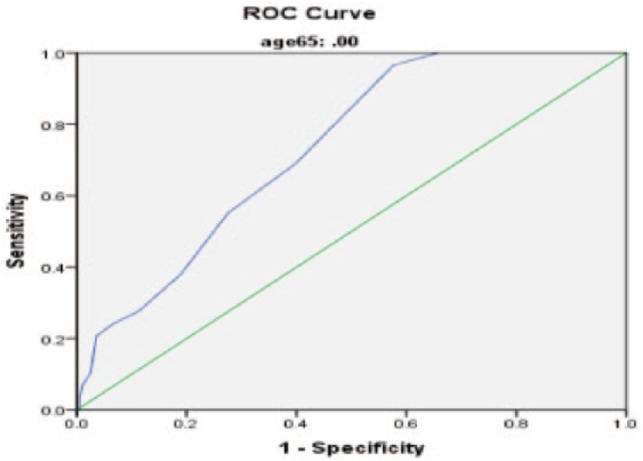
Figure 4.

ROC curve of cross-sectional area in ages <65 years.
Note. Diagonal segments are produced by ties. ROC = receiver operating characteristic.
Discussion
The ideal confirmatory test for CTS remains in debate. Historically, EDX has been the test of choice and there is a large body of literature supporting its use. US has gained increasing attention given its low cost, efficiency, and similar diagnostic accuracy to EDX. However, there remain unanswered questions regarding the ability of US to predict the severity of CTS. Interestingly, EDX does not correlate very well with the BCTQ14 despite a general assumption from surgeons and physicians that it does. Therefore, comparison of US with a reference standard of EDX is suboptimal. Despite the suboptimal comparison, EDX is the most frequently used test and determining the strength of correlation between US CSA and EDX graded severity may be useful from a clinical standpoint. If the 2 tests were to have a very strong correlation, one could argue that NCS could be replaced by US if the reason for ordering EDX is to determine severity of CTS.
Our data demonstrate that an US CSA >12 mm2 has AUC that fairly predicts severe changes on EDX. This cutoff value has a sensitivity and specificity of 37.5% and 81.9%, respectively; this could be potentially used in future studies to define severe CTS on US. The high specificity is of great importance as the test helps rule out false positives for severe CTS. US CSA was the strongest predictor of severity compared with any other variable tested. It is unclear whether the below optimal AUC (<0.9) is due to a true lack of correlation between the tests (EDX and US) or an inability of EDX to accurately define severe CTS. As with any diagnostic test, specific patient characteristics can increase or decrease the accuracy of the test. For example, older patients may have asymptomatic slowing of median nerve on EDX based simply on age.15 The current study has also demonstrated that US is more accurate in predicting severe CTS in younger patients. In addition, a positive CTS-6 (score >12) also resulted in increased accuracy for US. These findings suggest that US may be a more useful test in younger patients with a positive CTS-6 and that the results should be more cautiously interpreted in elderly patients and/or patients with a CTS-6 <12. That is not to say that US should not be considered in this latter patient group, just the interpretation of the results should be more critically evaluated.12
Mohammadi et al measured the US CSA of the median nerve in 164 wrists with EDX confirmed CTS. The authors found that the difference in median nerve CSA between mild, moderate, and severe CTS was not statistically different. The current study differs from the study by Mohammadi and colleagues, as the current study divides the cohort into only 2 groups: severe and nonsevere. In addition, the current study chose the most “severe” EDX cutoff of no response. This distinction is important as patients with severe CTS, in our practice, are encouraged to proceed with carpal tunnel release rather than undergoing nonoperative measures. In addition, the cutoffs used by Mohammadi and colleagues was arbitrary and by changing the cutoffs for each group, the results may have been different.
The severity of CTS may have important implications when counseling patients regarding treatment. Physicians may be more likely to offer conservative treatments such as splinting, corticosteroid injections, and therapy in patients with EDX graded mild carpal tunnel. However, patients with severe carpal tunnel may be counseled to have surgery to prevent permanent damage and atrophy. Therefore, obtaining an objective measurement of severity may add value to the standard physical examination. In addition, preoperative NCS has been shown to predict time to recovery.8 It is unclear whether US shares similar predictive value, but intuitively severe CTS based on US findings would have a similar recovery to severe CTS based on EDX findings.
This study has several limitations. First, we chose an arbitrary cutoff for severe CTS. There are numerous classification schemes and cutoff values in the literature.3 We purposely chose patients with no response on either distal motor latency (DML) or distal sensory latency (DSL) because nearly everyone would agree that level of dysfunction is consistent with severe CTS. However, this classification system therefore classified some patients with significantly prolonged DML and DSL as “nonsevere” that other systems would have classified as “severe.” It is possible that US would have performed better (or worse) using different cutoffs. Second, all patients included in this study were seen by hand fellowship–trained surgeons and were given a clinical diagnosis of CTS. This high prevalence increases the pretest probability of the diagnostic tests and artificially increased the diagnostic accuracy of the tests. A more ideal study design would be to include asymptomatic and symptomatic subjects from the general population. However, it is difficult to get patients to consent to EDX testing when asymptomatic.
Conclusion/Clinical Relevance
In patients, younger than 65 years or with a CTS-6 score greater than 12, CSA findings are able predict the severity of CTS and could influence the decision to proceed with surgical treatment.
Footnotes
Ethical Approval: The study was approved by our institutional review board.
Statement of Human and Animal Rights: No experiments on animals were performed for this study. No experimental procedures were performed in any human subject for this study.
Statement of Informed Consent: Informed consent was not needed for this study.
Declaration of Conflicting Interests: The author(s) declared no potential conflicts of interest with respect to the research, authorship, and/or publication of this article.
Funding: The author(s) disclosed receipt of the following financial support for the research, authorship, and/or publication of this article: Financial support was received from our institution’s Department of Orthopaedics and American Foundation for Surgery of the Hand.
References
- 1. Alfonso C, Jann S, Massa R, et al. Diagnosis, treatment and follow-up of the carpal tunnel syndrome: a review. Neurol Sci. 2010;31(3):243-252. [DOI] [PubMed] [Google Scholar]
- 2. Aroori S, Spence RA. Carpal tunnel syndrome. Ulster Med J. 2008;77(1):6-17. [PMC free article] [PubMed] [Google Scholar]
- 3. Bland JD, Rudolfer S, Weller P. Prospective analysis of the accuracy of diagnosis of carpal tunnel syndrome using a web-based questionnaire. BMJ Open. 2014;4(8):e005141. [DOI] [PMC free article] [PubMed] [Google Scholar]
- 4. Chen YT, Williams L, Zak MJ, et al. Review of ultrasonography in the diagnosis of carpal tunnel syndrome and a proposed scanning protocol. J Ultrasound Med. 2016;35(11):2311-2324. [DOI] [PubMed] [Google Scholar]
- 5. Fowler JR, Cipolli W, Hanson T. A comparison of three diagnostic tests for carpal tunnel syndrome using latent class analysis. J Bone Joint Surg Am. 2015;97(23):1958-1961. [DOI] [PubMed] [Google Scholar]
- 6. Fowler JR, Hirsch D, Kruse K. The reliability of ultrasound measurements of the median nerve at the carpal tunnel inlet. J Hand Surg Am. 2015;40(10):1992-1995. [DOI] [PubMed] [Google Scholar]
- 7. Fowler JR, Munsch M, Huang Y, et al. Pre-operative electrodiagnostic testing predicts time to resolution of symptoms after carpal tunnel release. J Hand Surg Eur Vol. 2016;41(2):137-142. [DOI] [PubMed] [Google Scholar]
- 8. Fowler JR, Munsch M, Tosti R, et al. Comparison of ultrasound and electrodiagnostic testing for diagnosis of carpal tunnel syndrome: study using a validated clinical tool as the reference standard. J Bone Joint Surg Am. 2014;96(17):e148. [DOI] [PubMed] [Google Scholar]
- 9. Graham B. The value added by electrodiagnostic testing in the diagnosis of carpal tunnel syndrome. J Bone Joint Surg Am. 2008;90(12):2587-2593. [DOI] [PubMed] [Google Scholar]
- 10. Ibrahim I, Khan WS, Goddard N, et al. Carpal tunnel syndrome: a review of the recent literature. Open Orthop J. 2012;6:69-76. [DOI] [PMC free article] [PubMed] [Google Scholar]
- 11. Kasius KM, Claes F, Verhagen WI, et al. Ultrasonography in severe carpal tunnel syndrome. Muscle Nerve. 2012;45(3):334-337. [DOI] [PubMed] [Google Scholar]
- 12. Mohammadi A, Afshar A, Etemadi A, et al. Diagnostic value of cross-sectional area of median nerve in grading severity of carpal tunnel syndrome. Arch Iran Med. 2010;13(6):516-521. [PubMed] [Google Scholar]
- 13. Nakamichi KI, Tachibana S. Enlarged median nerve in idiopathic carpal tunnel syndrome. Muscle Nerve. 2000;23(11):1713-1718. [DOI] [PubMed] [Google Scholar]
- 14. Pulikkottil BJ, Schub M, Kadow TR, et al. Correlating median nerve cross-sectional area with nerve conduction studies. J Hand Surg Am. 2016;41(10):958-962. [DOI] [PubMed] [Google Scholar]
- 15. Srikanteswara PK, Cheluvaiah JD, Agadi JB, et al. The relationship between nerve conduction study and clinical grading of carpal tunnel syndrome. J Clin Diagn Res. 2016;10(7):OC13-OC18. [DOI] [PMC free article] [PubMed] [Google Scholar]
- 16. American Academy of Orthopaedic Surgeons. Clinical Practice Guideline on The Diagnosis of Carpal Tunnel Syndrome. 1st ed Rosemont, IL: American Academy of Orthopaedic Surgeons; 2007. [Google Scholar]
- 17. Werner RA, Andary M. Electrodiagnostic evaluation of carpal tunnel syndrome. Muscle Nerve. 2011;44(4):597-607. [DOI] [PubMed] [Google Scholar]
- 18. Witt JC, Hentz JG, Stevens JC. Carpal tunnel syndrome with normal nerve conduction studies. Muscle Nerve. 2004;29(4):515-522. [DOI] [PubMed] [Google Scholar]


