

Abstract
Background
Quetiapine fumarate, a 2nd generation anti-psychotic drug has oral bioavailability of 9% because of hepatic first pass metabolism. Reports suggest that co-administration of drugs with lipids affects their absorption pathways, enhances lymphatic transport thus bypassing hepatic first-pass metabolism resulting in enhanced bioavailability.
Objective
The present work aimed at developing, and characterising potentially lymphatic absorbable Solid Lipid Nanoparticles (SLN) of quetiapine fumarate by Quality by Design approach.
Methods
Hot emulsification followed by ultrasonication was used as a method of preparation. Precirol ATO5, Phospholipon 90G and Poloxamer 188 were used as a lipid, stabilizer and surfactant respectively. A32 Central Composite design optimised the 2 independent variables, lipid concentration and stabilizer concentration and assessed their effect on percent Entrapment Efficiency (%EE: Y1). The lyophilized SLNs were studied for stability at 5 ±3οC and 25 ± 2οC/60 ± 5% RH for 3 months.
Results
The optimised formula derived for SLN had 270mg Precirol ATO5 and 107mg of Phospholipon 90G giving %EE of 76.53%. Mean particle size was 159.8nm with polydispersity index 0.273 and zeta potential -6.6mV. In-vitro drug release followed Korsmeyer-Peppas kinetics (R2=0.917) with release exponent n=0.722 indicating non-Fickian diffusion. Transmission electron microscopy images exhibited particles to be spherical and smooth. Fourier-transform infrared spectroscopy, differential scanning calorimetry and X-ray diffraction studies ascertained drug-excipient compatibility. Stability studies suggested 5οC as appropriate temperature for storage and preserving important characteristics within acceptable limits.
Conclusion
Development and optimisation by Quality by Design were justified as it yielded SLN having acceptable characteristics and potential application for intestinal lymphatic transport.
Keywords: Quetiapine fumarate, solid lipid nanoparticles, percent entrapment efficiency, precirol ATO5, phospholipon 90G, quality by design
1. INTRODUCTION
Quetiapine Fumarate (QF) is an atypical antipsychotic drug belonging to the 2nd generation of antipsychotics [1]. It is frequently used for the treatment of chronic or intermittent psychotic diseases mainly schizophrenia and bipolar disorders in adults and adolescents. The daily dose of QF ranges from 100 to 800 mg. per day [2]. QF belongs to BCS class II having low solubility and high permeability. Its elimination half-life is approximately 6 h [3]. The empirical formula for QF is C42H50N6O4S2.C4H4O4 and the molecular weight is 883.09 [4].
On oral administration, QF is absorbed rapidly but has a low oral bioavailability of only 9% due to extensive hepatic first-pass metabolism [3]. It has been established that QF is primarily metabolised by the CYP3A4 enzyme in the liver [5]. The low oral bioavailability of QF necessitates frequent administration of the drug in high doses to achieve therapeutic plasma levels. QF has cardiovascular, extrapyramidal and many other dose-related side effects which affect the lifestyle and longevity of a person [6-8]. Therefore, enhancement in bioavailability thereby resulting in the reduction of the daily dose of the drug is very desirable.
It has been reported that drugs highly metabolised on first-pass metabolism by the liver, on being absorbed through the intestinal lymphatic system can be protected from hepatic first-pass metabolism as mesenteric lymph directly enters the systemic circulation without first passing through the liver, thus resulting in the enhancement of oral bioavailability [9, 10]. It has also been reported that coadministration of drugs with lipids impacts their absorption pathway [11] and enhances lymphatic transport of the drug, thus giving direct access to systemic circulation without having to pass through the liver first. So, a number of lipidic formulations like emulsions, microemulsions, micellar systems, SEDDS, SMEDDS, SNEDDS, liposomes, solid lipid nanoparticles (SLN), and Nanostructured Lipid Carriers (NLC), have been investigated as drug carriers for a lymphatic system [12].
SLNs have been identified as an alternative to traditional colloidal drug carriers like liposomes, microemulsions, niosomes and nanoemulsions as they have many advantages compared with the above mentioned colloidal carriers like good physical stability, improved chemical stability of drug [12, 13], good tolerability and site-specific targeting [14]. SLNs are made of solid lipids which are solid at room temperature and body temperature [14], having a monolayer phospholipid shell stabilised by the surfactant aqueous solution. The minute size of this formulation (20-500nm.) facilitates the uptake of drugs into the intestine especially through the lymphatic route when administered orally [12]. SLNs can encapsulate both hydrophilic and lipophilic drugs as the drugs are embedded in the voids or spaces of solid lipid matrix [15]. Drug entrapment depends on the type of solid lipids, drug solubility in lipid, processing techniques and polymorphic changes in lipid crystals [15]. Researchers have shown the importance of the physiological process of digestion of lipids in enhancing lymphatic transport by stimulating the production of chylomicrons. Lipophilic drugs enter the lymphatic system in association with triglyceride core of chylomicrons [16]. Therefore, the use of SLN as a carrier for the lymphatic system after oral administration has been extensively studied by many researchers [17- 20].
The novelty of the present work lies in the use of a simple method requiring simple and easy to use equipment which has been optimised using Quality by Design (QbD) approach. The method used for the preparation of SLN does not involve the use of any organic solvent and is therefore safe as no traces of organic solvent would be left behind in the SLN, making it a better method over previously used and reported methods of QF SLN[1, 3, 4]. The developed SLN can be potentially used for lymphatic transport via the intestinal route for bypassing the hepatic first-pass metabolism which can result in enhanced bioavailability.
In the present study, QF loaded SLN were designed and developed by DoE approach for potential transport through the intestinal lymphatic system. SLNs were prepared by hot emulsification followed by ultrasonication using a probe sonicator [21]. A 2-factor, 3 level central composite design (CCD) was used to optimize the formulation of SLN. The amount of lipid (X1) and the amount of stabilizer (X2) were taken as independent variables at 3 levels (low, medium, high) and entrapment efficiency was selected as dependent variable (Y1). The amount of drug and surfactant (Poloxamer188) was kept constant in all the formulations. CCD was applied by Design-Expert software (Trial version 7.0.0, Stat-Ease Inc.). Process variables like emulsification time, ultrasonication amplitude and cycles were also optimised separately in preliminary studies. The prepared SLN were evaluated for physico-chemical characteristics like size, entrapment efficiency, morphology, and in-vitro drug release. Stability studies were carried out for a period of 3 months.
2. MATERIALS AND METHODS
Quetiapine fumarate (QF) was obtained as a gift sample from IPCA laboratories (Ratlam, India). Precirol ATO5 and Compritol 888 were obtained from Gattefosse, Cedex, France, Dynasan114, Dynasan 116, Dynasan118 from IOI Oleo Gmbh, Witten, Germany as gift samples.
Poloxamer 188 (Kolliphor P188) was kindly supplied by BASF (Mumbai, India). Phospholipon 90G (P90G) was kindly supplied by Lipoid (Germany). Dialysis membrane (molecular weight cut off between 12,000-14000 daltons) was purchased from Himedia (Mumbai, India). HPLC grade acetonitrile, methanol and triethylamine were obtained from Fisher Scientific, Mumbai. Water used in all the experiments was ultrapure, obtained from Millipore Direct-Q Ultrapure water system (Millipore, France). All other chemicals and reagents were of analytical or HPLC grade.
2.1. Methods
2.1.1. Screening of Solid Lipids
Selection of solid lipids for preparing SLN was done on the basis of solubility of QF in various lipids. Solubility was determined by semi-quantitative method. Accurately weighed QF (10 mg) was transferred to culture tubes having screw caps. Weighed quantity of solid lipid (10g) was taken in a separate tube and added in small increments to the tube containing the drug. The mixture was heated on a hot water bath shaker at a temperature 5oC above the melting point of the lipid. The addition of solid lipid was continued until a clear melt was obtained, after which the remaining lipid was weighed and the quantity required to dissolve 10mg of QF was determined.
2.1.2. Preparation of QF SLN
SLN of QF were prepared by the method of hot emulsification followed by ultrasonication by a probe sonicator. Selection of solid lipid was done on the basis of solubility of the drug in 5 lipids. The method used for the preparation of SLN can be briefly given as; the weighed quantity of the selected lipid, stabilizer (lipophilic surfactant) and the drug (25mg) were taken in a beaker and heated on a water bath, 5oC above the melting point of the solid lipid. An aqueous phase was prepared by dissolving the hydrophilic surfactant (Poloxamer188) in a fixed amount of Millipore ultrapure water. The aqueous phase was maintained at the same temperature as the lipid phase and was added to the molten lipid. This was followed by homogenisation on a homogeniser (Remi Electrotechnik, Vasai, India, RQT 127/A/D) at 6000 rpm for 3 min (fixed based on preliminary studies), to obtain a coarse hot oil in water emulsion. The coarse o/w emulsion was then ultrasonicated using a probe sonicator (PCI Analytics, PKS -750F) at an amplitude of 60W for 20min (based on preliminary studies). During ultrasonication, the temperature was maintained 5oC above the melting point of lipid. Finally, the hot nanodispersion obtained was allowed to cool at room temperature.
Based on preliminary studies, 2 factors, the amount of lipid(X1) and the amount of stabilizer (X2) were chosen as independent variables for optimization of the formulation. Percentage entrapment efficiency (%EE:Y1) was chosen as the dependent variable or the response variable.
2.1.3. Design of Experiment
Response surface methodology is a combination of statistical and mathematical methods to select the best experimental conditions requiring the least number of experiments to get appropriate results. A 13 run, 2 factor, 3 level Central Composite Design (CCD) was used for the optimization procedure. Based on preliminary data obtained, the 2 independent variables chosen were the amount of lipid (X1) and the amount of stabilizer (X2) at 3 levels as these showed a significant effect on %EE.
Design –Expert (version7.0.0; Stat-Ease Inc. Minneapolis, USA) was used to build the design matrix. Table 1 gives the coded and actual values of independent variables for the desired response. According to CCD matrix generated, a total of 13 experiments were performed including 4 factorial point, 4 axial points and 5 replicates at the centre points by varying the amount of X1 and X2. The batches suggested by the software were prepared in the same manner as given above and the predicted value of response (%EE) was compared with the actual values of response. The second order polynomial model generated by the design for the response is as follows:
Table 1. Coded and actual values of independent variables.
| Levels | Lipid Amount:Precirol (X1) | Stabilizer Amount:P90G (X2) |
|---|---|---|
| Low | -1 (100mg) | -1 (90 mg) |
| Medium | 0 (200mg) | 0 (100 mg) |
| High | +1 (300mg) | +1 (110 mg) |
Y1= B0+ B1X1 + B2X2+ B3X1X2 + B4X12 + B5X22
Where, Y1, is the measured response, B0 is the intercept, B1, and B2 are the linear coefficients corresponding to linear effects (X1 and X2) respectively. B3 is the interaction coefficient, B4, and B5 are quadratic or squared coefficients corresponding to the interaction effect of X1, X2, the quadratic effect of X12 and X22 respectively. This equation was used to assess the linear, interactive and quadratic effects of the independent variables on the response, Y1. The results obtained were statistically analysed to determine the effect of independent variables on the response by ANOVA through Fisher’s test using Design Expert version 7.0.0 as the software. P-value less than 0.05was considered statistically significant. The significance of the model was also estimated by ANOVA.
2.1.4. Characterisation of the Prepared SLN
2.1.4.1. Drug Entrapment Efficiency (%EE)
%EE is the percentage of drug entrapped within the nanoparticles. Entrapment efficiency was determined by an indirect method by analyzing the free drug content in the supernatant. The nanodispersion was centrifuged at 16,000 rpm for 40min. at 4oC to separate the supernatant from nanoparticles. The supernatant was filtered through 0.2 µm membrane filter to remove all the particles and analysed for the unentrapped drug (Aue) by the validated HPLC method (I.P 2014) (HPLC: Shimadzu, Kyoto, Japan. Model LC2010 CHT). The %EE was calculated as follows:
%EE= At-Aue/ At [22]
At= weight of total drug taken
Aue= weight of unentrapped drug present in the supernatant.
Briefly, the HPLC method used for the analysis of drug is as follows- methanol, water, acetonitrile and triethylamine were used as the mobile phase mixed in the ratio 500: 300:200:0.4. Lichrospher 100-RP-18 end-capped (250mm X 4.6 mm internal diameter, 5 µm particle size) was used as the column with an injection volume of 20µL. The flow rate was kept at 1.5ml/min and UV detection was done at 254nm. The retention time was taken as 6.448min ± 0.1min. The results obtained were processed by LC-solution (version 6.42) software.
2.1.4.2. Lyophilization of SLN
The pellet obtained after centrifugation was redispersed in Millipore ultrapure water to get the nanodispersion. The nanodispersion was frozen to -80oC in a deep freezer (Voltas, India) for 12 hrs at a pressure of 0.4bar and then the sample was transferred to a lyophilizer (Virtis) for 24 hrs after mixing with D-mannitol (2%w/v) as a cryoprotectant. Cryoprotectant was used to prevent aggregation of particles due to stress during lyophilisation. The lyophilized product was stored at -20oC in airtight screw-capped vials.
2.1.4.3. Determination of Particle Size, Polydispersity Index (PDI) and Zeta Potential
The particle size, PDI and zeta potential of the optimised batch of SLN were determined by Zetasizer (Nano ZS, Malvern Instruments limited, U.K) at 25oC. Dynamic Light Scattering (DLS) was used for the determination of particle size. Before measurement, the samples were appropriately diluted with ultrapure water and sonicated to remove air bubbles. Scattering of light was measured at 90o. The particle size distribution was given in terms of the polydispersity index (PDI). Values close to 0 indicate a homogenous sample and values greater than 0.5 indicate a heterogeneous sample. Zeta potential, determined by electrophoretic light scattering technique, indicates the surface charge of a particle and influences the stability of particles in dispersion through electrostatic repulsion.
2.1.4.4. Transmission Electron Microscopy (TEM)
The morphology of the optimised batch of QF-SLN was determined by TEM (FEI, Tecnai F20). The lyophilized SLN were appropriately diluted with ultrapure water and then drop cast onto a carbon-coated copper grid with mesh size 200. The sample was stained with phosphotungstic acid (1.5%w/v) Excess dispersion was removed with the help of a tissue paper and the grid was air-dried at room temperature before being loaded into the electron microscope.
2.1.4.5. Fourier Transform Infrared Spectroscopy (FTIR)
Drug excipient interactions were studied by FTIR spectra obtained by using FTIR-Bruker (model Alpha E). The spectra were recorded for the drug QF, physical mixture of drug and excipients and lyophilized drug-loaded SLN formulation. The samples were prepared by press pellet technique, by compressing 2mg sample with 200mg potassium bromide to form a disk. The scanning range was 600-4000cm-1 and resolution was 4cm-1. Comparison of FTIR spectra of drug with a physical mixture and lyophilized formulation reveals the interaction of the drug with excipients by showing major shifts in the peaks.
2.1.4.6. Differential Scanning Calorimetry (DSC)
DSC study was performed to evaluate any possible physical interactions between the drug and the excipients and to detect any modification in the form of the drug after incorporation into SLN. DSC scans were recorded for QF, Precirol, Poloxamer188, mannitol, P90G, physical mixture of QF and Precirol and QF loaded lyophilized SLN by using a differential scanning calorimeter (DSC 3, Mettler Toledo Inc.). The samples were sealed in the aluminum pan and heated at a scanning temperature range of 40-300oC at a heating rate of 10oC/min in an atmosphere of nitrogen. Empty pan was taken as the reference. Minor changes in the endothermic peak of drug or excipients may result due to the presence of impurity. The drug endothermic peak may shift or become broadened in mixture with excipients.
2.1.4.7. X-Ray Diffraction Study (XRD)
XRD study was performed to determine the crystalline/amorphous changes in the form of drug and lipid after incorporation in SLN. XRD study was carried out for pure QF, Precirol ATO5, physical mixture of the QF with excipients and optimised, lyophilised SLN. XRD patterns were recorded on a powder X-ray diffractometer (Xpert Pro, PANanalytical, The Netherlands.) using Nickel-Beta filter, Copper Kα radiation, at a voltage of 45kV and a current of 40mA. The scanning range employed was from 5o to 50o at diffraction angle 2θ.
2.1.4.8. In Vitro Drug Release Studies
In vitro drug release studies were performed using the dialysis method. Dialysis membrane (Himedia Dialysis membrane-70, Mumbai) having molecular weight cut-off between 12,000-14,000 daltons was used for the studies. Dissolution studies were performed in 0.1N hydrochloric acid (HCl) for the first 2 h followed by Phosphate buffer pH 6.8(PB 6.8) (I.P 2014) for the next 22 h. Experimental set up consisted of a dialysis bag having lyophilized SLN equivalent to 25mg of QF suspended in 5ml HPLC grade water, sealed at both ends and a beaker acting as the receptor compartment. The receptor compartment contained 100ml of release medium (0.1N HCl or PB6.8) maintained at 37oC± 0.5oC, magnetically stirred at 100rpm. The donor compartment was immersed in the release medium at all times. At 0.25, 0.5, 1, 2, 3, 4, 6,8, 10, 12, 24 h time points, 2 ml samples were withdrawn from the receptor compartment and replenished with the same volume of fresh release medium, to maintain sink conditions. The collected samples were filtered through a 0.2µm membrane filter (Pall Corporation) to remove all the particles and analyzed by HPLC as described earlier. The studies were carried out in triplicate and the results were presented as % cumulative drug released at each time point (mean ± SD). The data obtained from in vitro drug release studies was fitted in various release kinetic models like zero order, first order, Higuch’s, Korsmeyer –Peppas. The R2 values obtained from each model were compared to ascertain the in-vitro drug release kinetic model. The model giving the highest R2 was considered as the best fit model. Ko, the zero-order release constant, K1, the first-order release constant, KH, the Higuchi dissolution constant, Kp, the Korsmeyer-Peppas release constant, incorporating structural and geometrical characteristics of dosage form, and n, the release exponent were calculated.
2.2. Stability Studies
Stability studies were carried out with the optimized lyophilized batch of nanoparticles of QF. Sealed vials containing freshly prepared freeze-dried SLN of QF were put in stability chambers at 25oC ± 2oC/ 60± 5%RH and at a refrigerated temperature of 5 ± 3oC according to ICH Q1A (R2) guidelines for 3 months. The samples were analyzed at 0, 1 and, 3 months for particle size, PDI, zeta potential and %EE to assess the stability of nanoparticles.
3. RESULTS AND DISCUSSION
3.1. Screening of Solid Lipids
The solubility of QF in different solid lipids was determined by the semi-quantitative method as the solubility of the drug in lipid is a very important factor in drug loading capacity of SLN. The solubility of QF was tested in 5 lipids having different chain lengths, Dynasan 114 (trimyristate), Dynasan 116 (tripalmitate), Dynasan 118 (tristearate), PrecirolATO5 (glyceryl palmitostearate) and Compritol 888(glyceryl behenate). Long-chain triglycerides were considered for solubility studies as they are shown to be better for lymphatic targeting as compared to medium and short-chain triglycerides [12]. PrecirolATO5 showed the highest solubilisation capacity for QF (4.068g lipid was used for solubilising 10mg QF) and was therefore chosen as the lipid for formulation. The results of solubility have been given as g of lipid/10mg of the drug (Table 2, Fig. 1). The solubilising capacity of the tested lipids can be given in the following order- Precirol ATO5> Dynasan 114> Compritrol888> Dynasan 118> Dynasan 116. Moreover, Dynasan 114, 116, and 118 being highly crystalline and having fatty acids of the same chain length would show less drug loading as compared to PrecirolATO5 which has fatty acids of different chain lengths (palmitic acid and stearic acid). Drug molecules are accommodated in the crystal defects of the lipid lattice and lipids with fatty acids of different chain lengths have imperfections which provide space to accommodate the drug [14-24]. Precirol ATO5 being Glyceryl palmitostearate is expected to accommodate drug better.
Table 2. Solubility of drug in different solid lipids.
| Lipids | Lipid/drug (g/10mg)* |
|---|---|
| DYANASAN 116 | 7.123 ±0.064 |
| DYANASAN 114 | 6.012±0.047 |
| DYANASAN 118 | 7.014±0.024 |
| Precirol ATO 5 | 4.068 ±0.011 |
| Compritol 888 | 6.121 ±0.082 |
*mean ± SD (n=3).
Fig. (1).
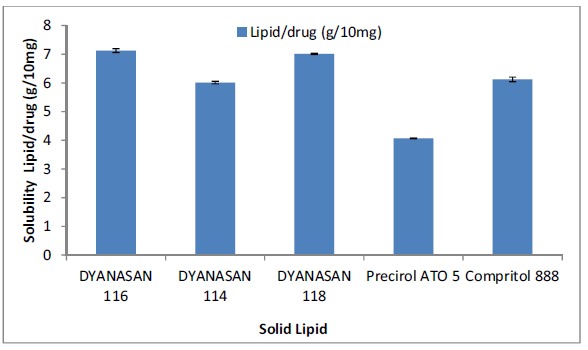
Bar graph of solubility of drug in different solid lipids.
3.2. Preparation of Solid Lipid Nanoparticles of Quetiapine Fumarate
In the present study, hot emulsification followed by ultrasonication (at a temperature 5oC above the melting point of lipid) was chosen as the method of preparation as it is a simple method and gave reproducible results. Precirol ATO5 was chosen as the lipid based on screening solubility studies of drug in various lipids. Soya lecithin (Phospholipon 90G) was selected as the stabilizer for the lipid phase (lipid phase surfactant). Poloxamer 188 was taken as the aqueous phase surfactant, dissolved in double distilled water to act as the external phase of the o/w emulsion (dispersion medium for SLN). A combination of surfactants was taken as it has been reported that surfactant combinations show a smaller particle size and prevent particle agglomeration efficiently, thus giving better storage stability [25]. The amount of drug taken in all the trials was kept constant at 25mg. Preliminary trials were conducted using varying quantities of Precirol ATO5, P90G and Poloxamer 188 by the method stated. During the trials, it was found that 300mg of PrecirolATO5, 110mg of Phospholipon90G, and 100mg of Poloxamer188 dissolved in double distilled water along with 25mg of QF (kept constant in all trials) gave a formulation with desirable characteristics with respect to physical appearance (no phase separation observed) and %EE (maximum among the preliminary trial batches). Preliminary trials also showed the quantity of lipid and quantity of stabilizer to have an effect on the entrapment efficiency of the nanoparticles, so, they were subjected to optimization by the Design of Experiments (DoE) using Central Composite Design (CCD).
3.3. Design of Experiment
The 2 significant variables selected during preliminary trials, the amount of lipid (Precirol) and amount of stabilizer (P90G) were optimized by 13 run face-centered CCD to maximise the %EE taken as the dependent response variable by Design-Expert software version 7.0.0. The %EE of each formulation batch of design matrix was determined by the method stated in the materials and methods section. The various formulation batches suggested by the software and the predicted and observed values of %EE are given in Table 3. The effect of independent variables, X1 and X2 on the dependent variable %EE (Y1), was studied by regression analysis and the following quadratic 2nd order polynomial equation for the model was generated.
Table 3. Design matrix table showing Actual, Predicted and Residual values for % Entrapment Efficiency (Y1).
| Formulation Code | Precirol (LIPID(mg)) (X1) | P90G (soy Lecithin(mg)) (X2) | %EE:Y1* (Actual Values) | %EE:Y1 (Predicted Values) | Residual |
|---|---|---|---|---|---|
| F1 | 300 | 110 | 75.43495±0.194 | 77.729 | -2.294 |
| F2 | 300 | 90 | 70.69804±0.142 | 68.360 | 2.337 |
| F3 | 200 | 100 | 68.29381±1.23 | 65.983 | 2.309 |
| F4 | 200 | 110 | 70.62766±0.231 | 67.938 | 2.689 |
| F5 | 200 | 100 | 66.96071±0.112 | 65.983 | 0.977 |
| F6 | 200 | 100 | 63.82486±0.000 | 65.983 | -2.158 |
| F7 | 200 | 90 | 58.45182±0.076 | 65.026 | -6.574 |
| F8 | 200 | 100 | 65.2718±0.604 | 65.983 | -0.711 |
| F9 | 100 | 110 | 42.24389±0.347 | 42.638 | -0.394 |
| F10 | 300 | 100 | 72.50335±0.451 | 72.546 | -0.042 |
| F11 | 100 | 90 | 50.4222±0.194 | 46.184 | 4.237 |
| F12 | 100 | 100 | 40.0706±0.142 | 43.913 | -3.842 |
| F13 | 200 | 100 | 69.4527±1.23 | 65.983 | 3.469 |
* mean ± SD (n=3).
Y1 (%EE) = 65.983 + 14.316 X1 + 1.455X2 + 3.228X1.X2 – 7.753 X12 +0.498 X22
Coefficient of each factor (X1, X2, X1X2, X12, X22) of the equation was studied for statistical significance by finding out the F-value (of Fisher’s test) and p-value of prob>F at 95% confidence interval. A p<0.05 indicated the significance of model terms and values greater than 0.05 (p> 0.05) indicated the insignificance of model terms.
Design Expert 7.0.0 software was used to calculate the coefficients of the quadratic second-order polynomial equation and model suitability was tested using analysis of variance (ANOVA). Results of ANOVA have been summarized in Table 4.
Table 4. ANOVA for response surface quadratic model for checking model suitability.
| ANOVA | Sum of Squares | DF | Mean Square | F Value | p-value | - |
|---|---|---|---|---|---|---|
| Model | 1469.738 | 5 | 293.9476 | 17.50292 | 0.0008 | Significant |
| X1-Lipid concentration | 1229.791 | 1 | 1229.791 | 73.22715 | < 0.0001 | - |
| X2-Soy lecithin concentration | 12.71507 | 1 | 12.71507 | 0.757111 | 0.4131 | - |
| X1X2 | 41.70073 | 1 | 41.70073 | 2.483044 | 0.1591 | - |
| X1^2 | 166.0571 | 1 | 166.0571 | 9.887768 | 0.0163 | - |
| X2^2 | 0.687123 | 1 | 0.687123 | 0.040914 | 0.8455 | - |
| Residual | 117.5594 | 7 | 16.7942 | - | - | - |
| - | - | - | - | - | - | - |
| Lack of Fit | 97.08759 | 3 | 32.36253 | 6.323339 | 0.0534 | Not significant |
| Pure Error | 20.4718 | 4 | 5.11795 | - | - | - |
| Cor Total | 1587.297 | 12 | - | - | - | - |
| R-Squared | 0.925937 | |||||
| Std. Dev. | 4.098073 | |||||
| Mean | 62.63508 | |||||
| C.V. % | 6.542776 | |||||
| R-squared | 0.9259 | |||||
| Adjusted R Squared | 0.8730 | |||||
| Adeq Precision | 12.60405 | |||||
As can be seen from Table 4, the model is highly significant as (p<0.05) and can be used to predict response function (%EE). The model has an insignificant lack of fit as (p>0.05). The obtained ‘lack of fit F-value’ of 6.32 implies that there is only 5.34% chance that ”lack of fit F-value” this large could occur due to noise. Also, X1 (amount of lipid) with (p<0.0001), and X12, second-order effect of X1, with (p<0.05) were found to be significant. Other factors with p>0.05 were considered to be insignificant like the amount of stabilizer (X2), the interaction effect of the amount of lipid and stabilizer (X1X2) and second-order effect of stabilizer (X22). The coefficient of correlation (R2) and adjusted R2 (Adj-R2) were 0.9225 and 0.8730, respectively. The high value of R2 indicates the reliability of the model and also shows that the model can explain 92% variability in response and 8% variability could be due to noise. Also, the small difference between R2 and Adj- R2 shows that the model is adequate to predict response. The value of Coefficient of Variation (CV%) of 6.542 shows precision and a small value suggests a good model fit. The value of adequate precision of 12.604 indicates adequate precision and shows that this model can be used to navigate Design space. Looking at the full model polynomial regression equation, it can be seen that the positive coefficient (14.316) of X1 (amount of Precirol) has a positive effect on entrapment efficiency showing increased entrapment efficiency with an increase in the amount of Precirol, although the second-order effect of X1 (X12) was negative on entrapment efficiency (-7.753). X2 (amount of P90G), interaction term X1X2 and second-order effect of X2 (X22: amount of P90G), although insignificant factors, had positive coefficients. 3-d response surface graphs and 2d contour plots produced for the response %EE in relation to the amount of Precirol (X1) and P90G (X2) are graphical representation of the regression equation (Fig. 2).
Fig. (2).
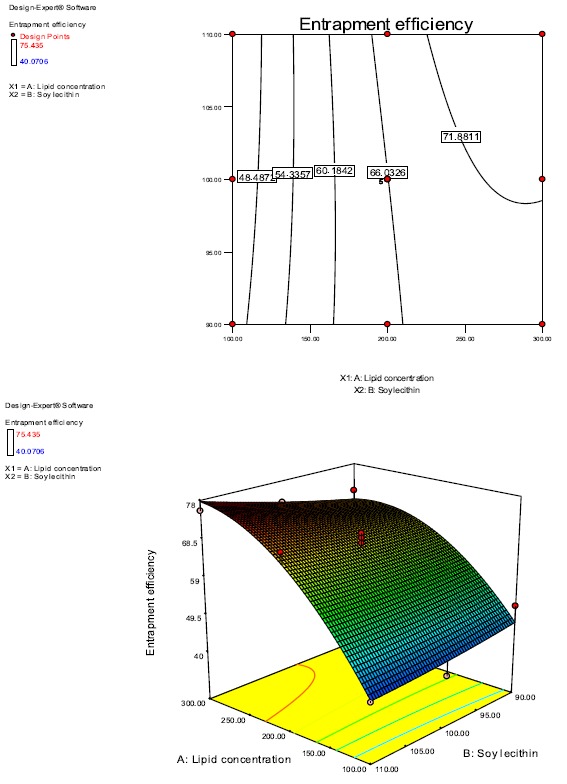
2d and 3d response Surface curves showing the effect of Precirol and Phospholipon 90G on %Entrapment Efficiency.
3.3.1. Effect of Independent Variables on % Entrapment Efficiency
The %EE ranged from 42.63% to 77.72% for various factor level combinations for predicted values and for actual values, it was 40.07% to 75.43% as shown in Table 3. It can be seen from the 3d graph and 2d contour plot (Fig. 2) and model equation that the amount of Precirol (X1) and the amount of P90G (X2), both have a positive effect on %EE although the effect of X2 is not pronounced. Thus the maximum %EE (75.43%) has been obtained at the highest level of lipid and stabilizer used as can be seen from the graphs. It can also be seen that on keeping the amount of Precirol constant and increasing the amount of P90G, the %EE increases and also on keeping the P90G amount constant and increasing the amount of Precirol, the %EE increases. But the effect of the amount of P90G(X2) is not very significant as is evident from the curvature of the 3D response surface graph and the contour plot. Thus, it can be concluded that both the factors, i.e the amount of Precirol and P90G have a positive effect on the %EE but the positive effect of P90G is not very significant. The probable reason for increased %EE with an increase in the amount of lipid could be the increased entrapment of drug with an increased matrix of lipid. Increased %EE on increasing the amount of P90G could be due to increased solubility of the drug in the lipid phase.
3.4. Selection of Optimized Batch
Optimization of the formulation was done based on numerical optimization by desirability approach. Batches with desirability 1, suggested by the software were formulated and their %EE was determined (Table 5). SD between the actual and predicted %EE was calculated and the batch having the maximum %EE and minimum SD was selected as the optimized batch. The validity of this approach was confirmed by the low SD values obtained for predicted and actual %EE values. Similar work has been done and reported by several other researchers for development and optimization of dosage forms by DoE [26, 27]. Batch SS2, having 270mg as the amount of lipid, 107mg as the amount of stabilizer, actual %EE as 76.53% and predicted %EE as 75.05% was considered as the optimized batch as it had the maximum %EE and minimum SD (1.050) between the predicted and actual response (%EE). This batch was used for further qualitative and quantitative analysis after lyophilisation using 2%w/v mannitol as the cryoprotectant.
Table 5. Batches with Desirability 1 suggested by Design Expert Software with predicted and actual % entrapment efficiencies.
| Formulation Code | Precirol (mg) | Phospholipon 90G (mg) | Predicted % EE | Actual %EE | SD |
|---|---|---|---|---|---|
| SS1 | 300 | 90 | 68.3605 | 65.12584 | 2.287254 |
| SS2 | 270 | 107 | 75.05134 | 76.53685 | 1.050413 |
| SS3 | 300 | 100 | 72.54626 | 69.30073 | 2.294935 |
| SS4 | 200 | 90 | 65.02667 | 63.03474 | 1.40851 |
| SS5 | 200 | 110 | 67.93815 | 65.92903 | 1.420663 |
| SS6 | 200 | 100 | 65.98363 | 64.02347 | 1.386041 |
3.5. Characterisation of the Prepared SLN
3.5.1. Particle Size and Polydispersity Index (PDI)
The optimized lyophilized batch SS2 was analysed for particle size and PDI. The z-average of particle size was found to be 159.8nm and PDI was 0.273 (Fig. 3). The particle size obtained can be considered appropriate for intestinal lymphatic absorption as it has been reported that particles less than 200nm in size are best for intestinal lymphatic targeting [12, 28, 29]. Although, particles larger than 200nm are also transported by the lymphatics but their uptake and transport is slow [12, 29]. PDI below 0.3 is considered optimum but PDI below 0.5 is also considered acceptable by some researchers [30]. Thus, the obtained PDI of 0.273 was considered appropriate and acceptable and indicated a narrow size distribution of nanoparticles.
Fig. (3).
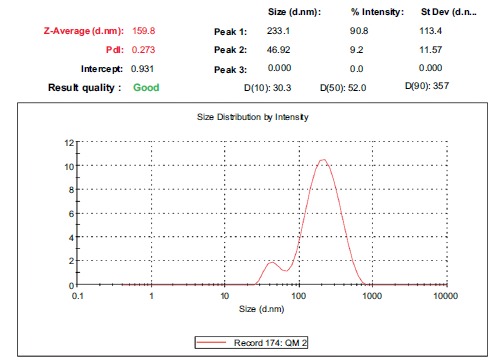
Particle size of the optimized batch SS2.
The values of D(10%), D(50%), D(90%) were 30.3nm, 52nm and 357nm, respectively, showing that 10% of the sample had a size of 30.3nm or smaller, 50% of the sample had a size of 52nm or smaller and 90% of the sample had a size of 357nm or smaller, respectively.
3.5.2. Zeta Potential
The zeta potential of the optimized batch SS2 was found to be -6.60mV (Fig. 4). The negative charge on the particles was due to the use of lipids which have a negative charge. The negative charge was desirable as it favoured lymphatic uptake [20]. Although the zeta potential was not found to be high enough to provide stability merely by electrostatic repulsion, lyophilisation of the formulation provided enhanced chemical and physical stability. Poloxamer 188 used as the hydrophilic surfactant in the aqueous phase also facilitated steric stability and compensated for the low zeta potential, as it is a non-ionic steric surfactant [31, 32]. The use of P90G also provided stability as P90G formed a barrier layer on the surface of SLNs preventing their aggregation [33]. Thus, steric stabilization along with electrostatic stabilization provided stability to the nanoparticles by forming a steric barrier around the particles [33].
Fig. (4).
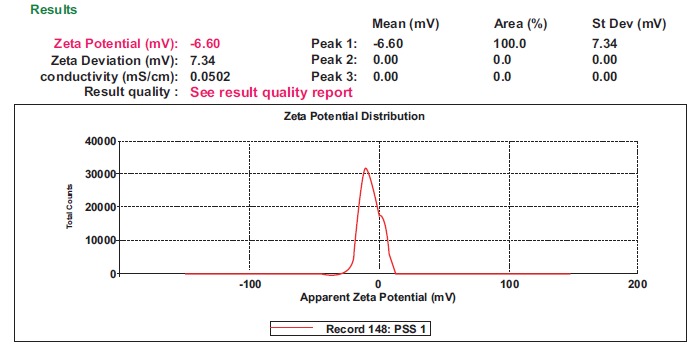
Zeta potential of the optimized batch SS2.
3.5.3. Transmission Electron Microscopy (TEM)
The images of transmission electron microscopy of the optimised batch of SLN (SS2) on a scale of 0.2µm and 100nm showed the particles to be spherical in shape with a smooth surface, without any sign of aggregation (Fig. 5).
Fig. (5).
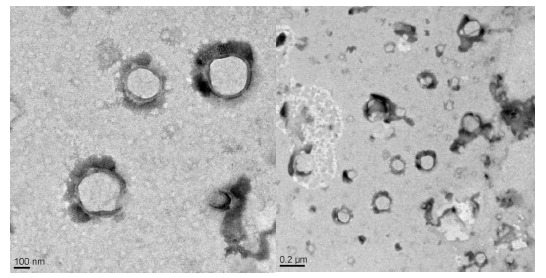
TEM of optimised batch SS2 showing particle size and morphological characteristics.
The grey diffused boundary around the particles may be due to the presence of steric stabilizer on the surface. The results were found to be in agreement with the particle size data determined by DLS.
3.5.4. Fourier Transform Infrared Spectroscopy (FTIR)
FTIR spectra of pure drug (QF), physical mixture of QF and excipients and of optimised lyophilized SLN formulation were obtained (Fig. 6). The spectrum of QF showed peaks at 1642 (C=O stretch), 3311.73 (N-H stretching in secondary amine and O-H stretching), 2865.44 (C-H stretching) and 1374 (C-H bending in plane). Similar peaks were observed in the physical mixture spectrum. The peaks found in lyophilized SLN spectrum were at 1649.77, 3400.69, 2850.78 and 1384 cm-1. Comparison of spectra of pure drug with that of the physical mixture and lyophilized optimised formulation showed the presence of all the characteristic peaks of the drug without any significant spectral shift in lyophilised SLN, suggesting perseverance of pharmacophore of drug and demonstrating the absence of interaction between the drug and excipients. The slight spectral shift and change in size/ shape of the characteristic peaks are acceptable when a drug is formulated with excipients.
Fig. (6).
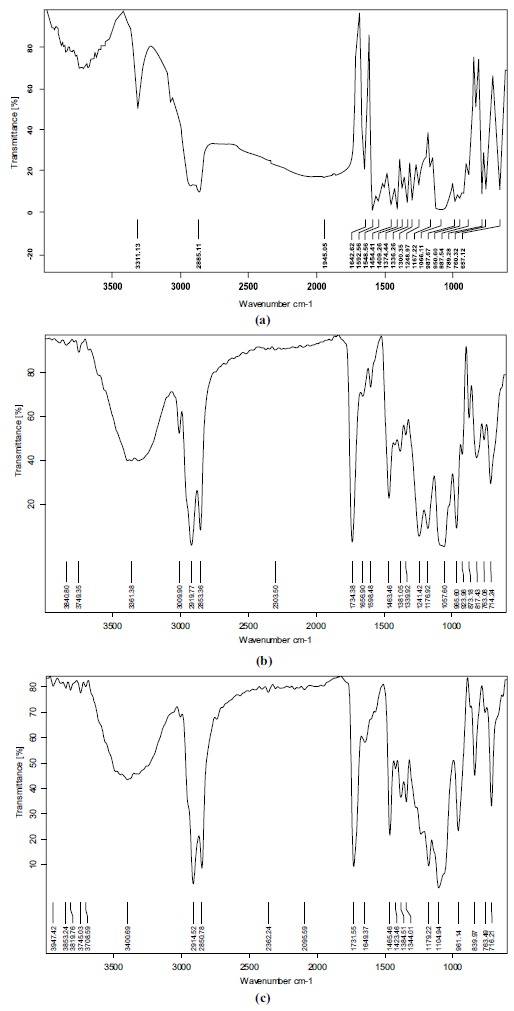
FTIR spectra of (a) Quetiapine fumarate, (b) physical mixture of drug and excipients (c) optimised formulation.
3.5.5. Differential Scanning Calorimetry (DSC)
Fig. (7) shows the DSC thermogram of pure QF with a sharp endothermic peak at 174.3oC representing its melting point. The sharp tapering peak shows the drug to be in the crystalline state. DSC thermograms of Precirol ATO5, Poloxamer 188, mannitol, P90G, physical mixture of drug and lipid and optimised lyophilized batch of QF-SLN are also shown in Fig. (7). DSCs of the lipid Precirol ATO5, Poloxamer and Mannitol show sharp endothermic peaks at 63.26 oC, 51.64 oC and 168.5 oC, respectively, representing their melting points and crystalline nature. DSC of P90G shows endothermic peaks at 85.4, 129.4, 233.5 and 272.4 oC and an exothermic peak at 281.3oC representing its various transition states from liquid crystalline state to trans/gauche rotational isomerism to isotropic liquid phase of lipid at 272.4 and the release of bound water at 281.3 shown as an exothermic peak [34]. Thermogram of a physical mixture of the main component, Precirol, and QF shows separate endothermic peaks of both the components with only a slight shift suggesting no interaction. Thermogram of lyophilised optimized formulation shows an endothermic peak at 165.6 but no peak at 174.3 (melting point of drug) indicating that the drug is no longer present in the crystalline state but is in the amorphous sate. The peak at 165.6oC was due to the presence of mannitol as a cryoprotectant as it was physically mixed with the formulation after its preparation and not incorporated in it. Slight shifting in the endothermic peak of mannitol occurred from 168.5 to 165.6 due to the presence of other chemical components as impurities. A small rounded endothermic peak on the left of the DSC curve of optimised SLN was that of the lipid Precirol, other excipients and the drug added. Reduction in the melting point of Precirol from 63.2 to 56.2oC and its round shape indicate a much less ordered crystalline state of the lipid, favouring drug loading in crystal defects. Also, the small size of the SLNs, produces a large surface area and a high surface energy resulting in a decrease in the melting point of the lipid [35]. Thus, the presence of an endothermic peak of the lipid and excipients and no separate peak of the drug clearly show the drug to be present in a solubilised state in the lipid.
Fig. (7).
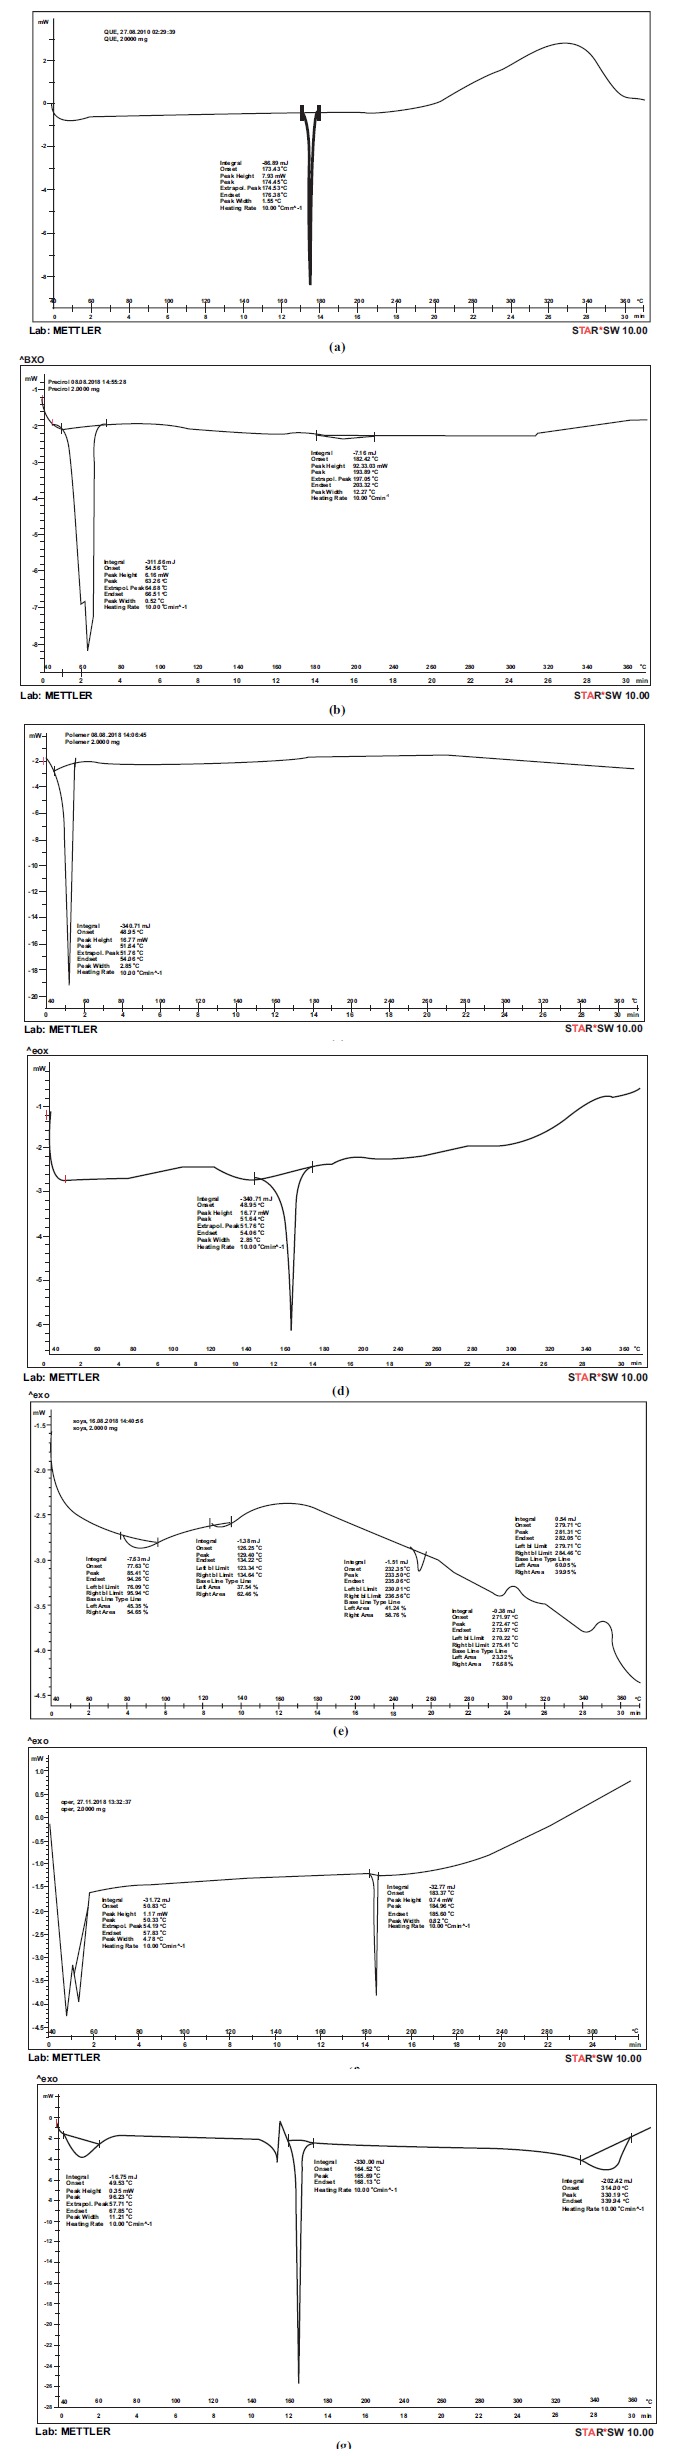
DSC of (a) QF (b) Precirol (c) Poloxamer (d) Mannitol (e) Phospholipon 90G (f) physical mixture of QF and Precirol (g) optimised SLN.
3.5.6. X-Ray Diffraction (XRD)
X-ray diffractograms of QF, PrecirolATO5, physical mixture of drug and excipients and optimised lyophilised QF-SLN are shown in Fig. (8). The diffraction pattern of QF shows distinct sharp peaks at 2θ scattered angles of 16.31ο, 20.04, 20.33, 21.13, 21.86, and 23.48 indicating the crystalline form of the drug. Diffractogram of bulk lipid Precirol shows high-intensity peaks at 2θ angles of 5.5, 19.48,19.06. These peaks are not very sharp but slightly broadened indicating random arrangement of crystals and a low degree of periodicity. The physical mixture of the drug and excipients shows almost all the characteristic peaks of the drug. Some peaks are missing maybe due to the formation of a homogenous mixture of the drug with excipients during sample preparation for XRD.
Fig. (8).
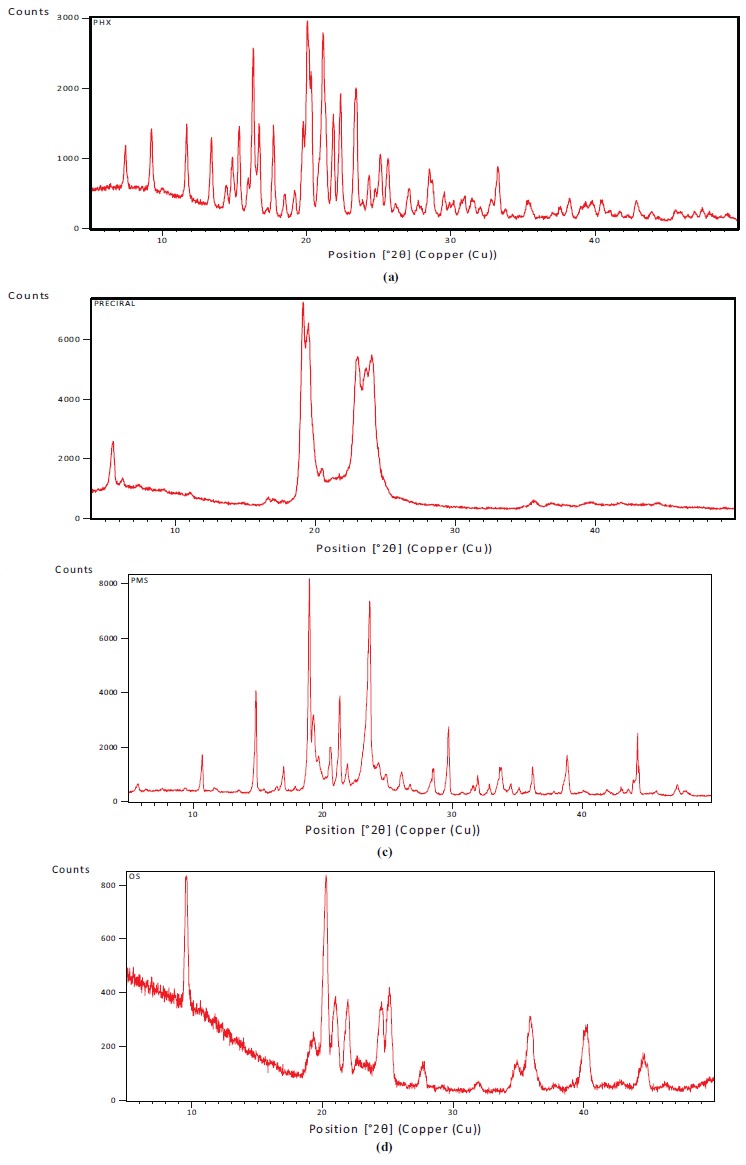
XRD of (a) QF (b) Precirol (c) Physical mixture (d) optimised SLN.
The diffraction pattern of lyophilized and optimised QF-SLN shows a halo with a few broadened and shifted peaks of the drug. The characteristic peaks of the drug especially the highest intensity peaks at 20.04 and 21.13 are absent in diffractogram of the optimised formulation. The presence of some peaks of the drug could be due to some poorly entrapped drug present at the periphery of SLN. The characteristic peaks of Precirol are not distinctly seen probably due to its conversion into a less ordered crystalline state as is evident from the presence of halo before 20o region.
XRD and DSC are complementary techniques in the assessment of crystallinity of substances; the compilation and interpretation of the results of both the analytical techniques for QF-SLN show most of the drug to be present in the amorphous state. This is evident by the absence of a characteristic endothermic peak of the drug in DSC at 174.3oC. The few peaks of the drug in XRD diffractogram of the optimised QF-SLN may be due to the presence of some drug on the periphery. The small broadened peak on the left side in the DSC of optimised QF-SLN confirms the presence of excipients and drug as a homogenous mixture in disorderly crystalline arrangement with lattice defects. This is also confirmed by the XRD diffractogram of optimised QF-SLN which shows few peaks with a halo in the region where characteristic peaks of excipients are present in its bulk phase XRD. Presence of imperfections and lattice defects in the crystalline structure of lipid is desirable as these defects provide space for the accommodation of the drug, facilitating higher drug loading.
Thus, interpretation of the results of both the techniques, DSC and XRD, confirms the presence of most of the drug in the amorphous state and lipid in the disorderly crystalline state favouring incorporation of the drug in crystal defects.
3.6. In Vitro Drug Release Study
In vitro drug release profile and data of optimised QF-SLN formulation in 0.1N hydrochloric acid (for the 1st 2 h)
and in phosphate buffer pH 6.8 (for the next 22 h) are given in Fig. (9) and Table 6. The data manifests release in 2 phases, initial burst release in the first 2h wherein approximately 23% of the drug released and subsequent controlled release over a period of 22h wherein almost 67% of the drug released. The initial burst release could be attributed to the drug adsorbed on the surface or present near the periphery of the QF-SLN. It may also be due to the large surface area of the SLN (very small size). The burst release also suggests a drug enriched shell model of SLN. At the end of 24 h, approximately 90% of the drug was found to be released. Thus, t25%, t50% and t90% (time taken for 25%, 50% and 90% of the drug to be released) were determined to be approximately 2 h, 6 h and 24 h respectively.
Fig. (9).
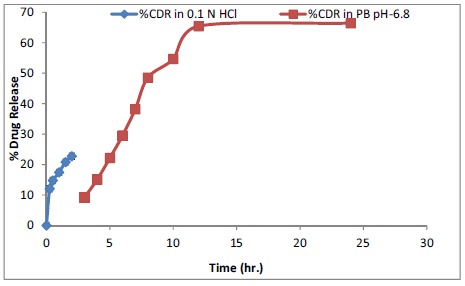
In-vitro dissolution profile of optimised formulation SS2 in 0.1N Hydrochloric acid and Phosphate buffer pH 6.8.
Table 6. Percentage drug release of optimized Formulation SS2 in 0.1N Hydrochloric acid and Phosphate buffer pH 6.8.
| Time (h) | % Drug Release of Formulation* | |
|---|---|---|
| 0.1 N HCl | PB pH-6.8 | |
| 0 | 00 | 00 |
| 0.25 | 12.08±0.45 | - |
| 0.5 | 14.78±0.54 | - |
| 1 | 17.45±0.17 | - |
| 1.5 | 20.82±0.54 | - |
| 2 | 22.75±0.36 | - |
| 3 | - | 9.25±0.18 |
| 4 | - | 15.09±0.31 |
| 5 | - | 22.17±0.25 |
| 6 | - | 29.54±14.81 |
| 7 | - | 38.17±0.39 |
| 8 | - | 48.55±0.30 |
| 10 | - | 54.68±0.35 |
| 12 | - | 65.43±0.42 |
| 24 | - | 66.44±0.46 |
* mean ± SD (n=5).
The in-vitro release data of the drug from QF-SLN (excluding the burst effect release data of the first 2 h in 0.1N hydrochloric acid) was fitted to various kinetic models like zero order, first order, Higuchi and Korsmeyer-Peppas model to determine the release kinetics. The regression equation and R2 (correlation coefficient) were calculated for each model. R2 value was used to find the goodness of fit. The release data of QF-SLN in PB pH 6.8 fitted best in Korsmeyer-Peppas model (R2=0.917). R2 values obtained for zero order, first order and Higuchi model were 0.675, 0.540 and 0.839, respectively, in PB with pH 6.8 (Table 7). The value of drug release exponent (n) was calculated to be 0.722 establishing the release mechanism to be anomalous or non-Fickian diffusion (as when 0.45<n< 0.89, the mechanism is non-Fickian diffusion) [23] showing that diffusion and lipid erosion both are involved in the release mechanism.
Table 7. Kinetic equation parameters for formulation SS2.
| Formulation Name | Zero order | First order | Higuchi | Korsmeyer-Peppas | ||||
|---|---|---|---|---|---|---|---|---|
| R2 | K0 | R2 | K1 | R2 | KH | R2 | KP | |
| SS2 | 0.675 | 2.740 | 0.540 | 0.078 | 0.839 | 17.80 | 0.917 | 1.021 |
| n=0.722 | ||||||||
3.7. Stability Studies
The optimised lyophilised QF-SLN were kept for stability studies at 5± 3οC and at 25 ± 2οC/60± 5% RH for 3 months. The results of stability studies with respect to particle size, PDI, zeta potential and %EE at 0, 1 and 3 months are given in Table 8. The results show an increase in particle size from 159.8nm to 230.7nm over a period of 3months at 5οC. The PDI was found to change from 0.273 to 0.396 in 3 months at 5 οC. The particles increased in size from 159.8nm to 309.3nm at 25 ± 2οC/60± 5% RH over a period of 3 months. The PDI changed from 0.273 to 0.442 in 3 months.
Table 8. Table showing Stability data for optimised formulation SS2.
| Formulation | Time Duration | Stability Condition | Particle Size (nm) | PDI | Zeta Potential | %EE* |
|---|---|---|---|---|---|---|
| SS2 | 0 month | 4 ºC | 159.8 | 0.273 | -6.60 | 76.53±1.440 |
| 25 ºC | 159.8 | 0.273 | -6.60 | 76.53±1.440 | ||
| 1 month | 4 ºC | 179.5 | 0.337 | -14.4 | 73.57±0.112 | |
| 25 ºC | 225 | 0.684 | -17.8 | 71.10±0.239 | ||
| 3 month | 4 ºC | 230.7 | 0.396 | -18.3 | 71.11±0.815 | |
| 25 ºC | 309.3 | 0.442 | -12.4 | 61.68±0.510 |
mean ± SD (n=3).
The zeta potential was found to be -6.6mV at 0 months and -18.3mV at 3 months at 5οC showing an increasing trend (towards the negative side). The zeta potential at 25οC was -6.6mV at zero month and -12.4mV at 3 months. The change in zeta potential on storage could be due to changes in the crystalline structure of the lipid. Also, crystalline reorientation could have resulted in the change of charge on the surface of nanoparticles, giving a change in zeta potential [36].
%EE decreased from 76.53% at zero month to 72.11% at 3 months at 5οC showing minimal (approximately 4%) drug expulsion. Similarly, %EE decreased from 76.53% at zero month to 61.68% at 3 months at 25οC, showing greater drug expulsion at a higher temperature as compared to expulsion at 5οC. The data of drug expulsion supports the argument of change in crystalline structure and crystalline reorientation of lipid given in zeta potential as changes in crystalline structure to a more stable form result in drug expulsion. The results of stability study(particle size and zeta potential) are represented graphically in Fig. (10).
Fig. (10).
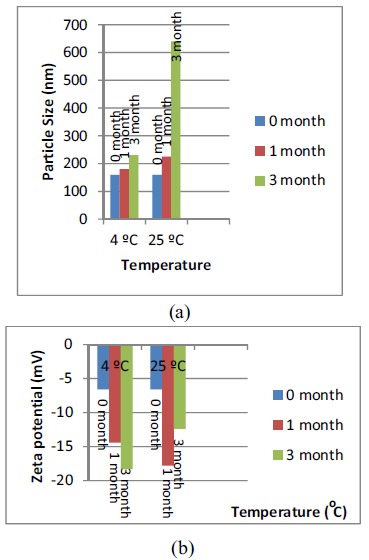
Change in (a) Mean particle size and (b) zeta potential of optimised SLN SS2 with time and temperature.
Thus the formulation can be said to be stable for 3 months at 5 οC ± 3οC with respect to its important characteristics like particle size, PDI, zeta potential and %EE. Although, the particle size increased significantly over the period of 3 months at 5οC, but the obtained particle size can still be useful for lymphatic targeting [12-20].
Thus, it can be concluded from stability studies that the best storage temperature for SLN is 5oC where its important characteristics like particle size, PDI, zeta potential and %EE are preserved within acceptable limits.
CONCLUSION
In the study conducted, solid lipid nanoparticles of an antipsychotic drug, QF were successfully formulated and optimised by QbD for potential intestinal lymphatic transport. Hot emulsification followed by ultrasonication proved to be a simple and safe method for producing SLNs free from traces of organic solvent. FTIR, DSC and XRD confirmed the compatibility of the drug with the selected excipients and gave an insight into the crystallinity changes of the excipients and drug during the formulation. These techniques also confirmed the incorporation of drug into SLN. Determination of particle size, PDI and zeta potential, by DLS shows the particle size to be appropriate for lymphatic targeting. The prepared SLNs were lyophilized for achieving enhanced stability using mannitol as the cryoprotectant. The in-vitro drug release studies showed an initial burst effect followed by Korsmeyer Peppas kinetic model (n=0.722) establishing the release mechanism to be anomalous or non-Fickian diffusion. The storage temperature for the optimised formulation was established to be 5oC, at which, the formulation remained stable for 3months with desired characteristics. Thus, the QbD approach can be successfully used for optimization of the formulation. Desirability method proved to be a useful tool for optimization of formulation with desired characteristics.
ACKNOWLEDGEMENTS
Declared none.
ETHICS APPROVAL AND CONSENT TO PARTICIPATE
Not applicable.
HUMAN AND ANIMAL RIGHTS
No Animals/Humans were used for studies that are the basis of this research.
CONSENT FOR PUBLICATION
Not applicable.
AVAILABILITY OF DATA AND MATERIALS
The authors confirm that the data supporting the findings of this research are available within the article.
FUNDING
None.
CONFLICT OF INTEREST
The authors declare no conflict of interest, financial or otherwise.
REFERENCES
- 1.Aboti P., Shah P., Patel D., Dalwadi S. Quetiapine fumarate loaded solid lipid nanoparticles for improved oral bioavailability. Drug Deliv. Lett. 2014;2:170–184. doi: 10.2174/221030310402140805105127. [DOI] [Google Scholar]
- 2. https://reference.medscape.com/drug/seroquel-xr-quetiapine-342984 [Accessed Dec.14, 2018]
- 3.Narala A., Veerabrahma K. Preparation, characterization and evaluation of quetiapine fumarate solid lipid nanoparticles to improve the oral bioavailability. J. Pharm. (Cairo) 2013;2013:265741–265748. doi: 10.1155/2013/265741. [DOI] [PMC free article] [PubMed] [Google Scholar]
- 4.Lohan S., Sharma S., Murthy R.S.R. Formulation and evaluation of solid lipid nanaoparticles of quetiapine fumarate and quetiapine hemifumarate for brain delivery in rat model. Pharm. Nanotechnol. 2013;3:239–247. [Google Scholar]
- 5.Mauri M.C., Paletta S., Pace C.D., Reggiori A., Cernigliaro G., Valli I., Altamura A.C. Clinical pharmacokinetics of atypical antipsychotics: An Update. Clin. Pharmacokinetics. 2018;6:36pages. doi: 10.1007/s40262-018-0664-3. [DOI] [PubMed] [Google Scholar]
- 6.Burns M.J. The pharmacology and toxicology of atypical antipsychotic agents. J. Toxicol. Clin. Toxicol. 2001;39(1):1–14. doi: 10.1081/CLT-100102873. [DOI] [PubMed] [Google Scholar]
- 7.Gareri P., Segura-García C., Manfredi V.G., Bruni A., Ciambrone P., Cerminara G., De Sarro G., De Fazio P. Use of atypical antipsychotics in the elderly: A clinical review. Clin. Interv. Aging. 2014;9:1363–1373. doi: 10.2147/CIA.S63942. [DOI] [PMC free article] [PubMed] [Google Scholar]
- 8.Pacher P., Kecskemeti V. Cardiovascular side effects of new antidepressants and antipsychotics: New drugs, old concerns? Curr. Pharm. Des. 2004;10(20):2463–2475. doi: 10.2174/1381612043383872. [DOI] [PMC free article] [PubMed] [Google Scholar]
- 9.Trevaskis N.L., Charman W.N., Porter C.J.H. Lipid-based delivery systems and intestinal lymphatic drug transport: A mechanistic update. Adv. Drug Deliv. Rev. 2008;60(6):702–716. doi: 10.1016/j.addr.2007.09.007. [DOI] [PMC free article] [PubMed] [Google Scholar]
- 10.Yáñez J.A., Wang S.W.J., Knemeyer I.W., Wirth M.A., Alton K.B. Intestinal lymphatic transport for drug delivery. Adv. Drug Deliv. Rev. 2011;63(10-11):923–942. doi: 10.1016/j.addr.2011.05.019. [DOI] [PMC free article] [PubMed] [Google Scholar]
- 11.Nanjwade B.K., Patel D.J., Udhani R.A., Manvi F.V. Functions of lipids for enhancement of oral bioavailability of poorly water-soluble drugs. Sci. Pharm. 2011;79(4):705–727. doi: 10.3797/scipharm.1105-09. [DOI] [PMC free article] [PubMed] [Google Scholar]
- 12.Ali Khan A., Mudassir J., Mohtar N., Darwis Y. Advanced drug delivery to the lymphatic system: Lipid-based nanoformulations. Int. J. Nanomedicine. 2013;8:2733–2744. doi: 10.2147/IJN.S41521. [DOI] [PMC free article] [PubMed] [Google Scholar]
- 13.Muller R.H. Lipid nanoparticles: Recent advances. Adv. Drug Deliv. Rev. 2007;59:375–376. doi: 10.1016/j.addr.2007.05.002. [DOI] [Google Scholar]
- 14.Singhal G.B., Patel R.P., Prajapati B.G., Patel N.A. Solid lipid nanaoparticles and nano lipid carriers: As novel solid based drug carrier. Int. Res. J Pharm. 2011;2:40–52. [Google Scholar]
- 15.Lin C.H., Chen C.H., Lin Z.C., Fang J.Y. Recent advances in oral delivery of drugs and bioactive natural products using solid lipid nanoparticles as the carriers. Yao Wu Shi Pin Fen Xi. 2017;25(2):219–234. doi: 10.1016/j.jfda.2017.02.001. [DOI] [PMC free article] [PubMed] [Google Scholar]
- 16.O’Driscoll C.M. Lipid-based formulations for intestinal lymphatic delivery. Eur. J. Pharm. Sci. 2002;15(5):405–415. doi: 10.1016/S0928-0987(02)00051-9. [DOI] [PubMed] [Google Scholar]
- 17.Mishra A., Vuddanda P.R., Singh S. Intestinal lymphatic delivery of Praziquantel by solid lipid nanoparticles: Formulation design, in vitro and in vivo studies. J. Nanotechnol. 2014;2:12. [Google Scholar]
- 18.Paliwal R., Rai S., Vaidya B., Khatri K., Goyal A.K., Mishra N., Mehta A., Vyas S.P. Effect of lipid core material on characteristics of solid lipid nanoparticles designed for oral lymphatic delivery. Nanomedicine (Lond.) 2009;5(2):184–191. doi: 10.1016/j.nano.2008.08.003. [DOI] [PubMed] [Google Scholar]
- 19.Alex M.R.A., Chacko A.J., Jose S., Souto E.B. Lpoinavir loaded solid lipid nanoparticles (SLN) for intestinal lymphatic targeting. Eur. J. Pharm. Sci. 2011;1-2:11–18. doi: 10.1016/j.ejps.2010.10.002. [DOI] [PubMed] [Google Scholar]
- 20.Bhalekar M.R., Upadhaya P.G., Madgulkar A.R., Kshirsagar S.J., Dube A., Bartakke U.S. In-vivo bioavailability and lymphatic uptake evaluation of lipid nanoparticulates of darunavir. Drug Deliv. 2016;23(7):2581–2586. doi: 10.3109/10717544.2015.1037969. [DOI] [PubMed] [Google Scholar]
- 21.Padhye S.G., Nagarsenker M.S. Simvastatin solid lipid nanoparticles for oral delivery: Formulation development and in vivo evaluation. Indian J. Pharm. Sci. 2013;75(5):591–598. [PMC free article] [PubMed] [Google Scholar]
- 22.Singh S., Dobhal A.K., Jain A., Pandit J.K., Chakraborty S. Formulation and evaluation of solid lipid nanoparticles of a water soluble drug: Zidovudine. Chem. Pharm. Bull. (Tokyo) 2010;58(5):650–655. doi: 10.1248/cpb.58.650. [DOI] [PubMed] [Google Scholar]
- 23.Costa P., Lobo S. J.M. Modeling and comparison of dissolution profiles. Eur. J. Pharm. Sci. 2001;13(2):123–133. doi: 10.1016/S0928-0987(01)00095-1. [DOI] [PubMed] [Google Scholar]
- 24.Manjunath K., Reddy J.S., Venkateswarlu V. Solid lipid nanoparticles as drug delivery systems. Methods Find. Exp. Clin. Pharmacol. 2005;27(2):127–144. doi: 10.1358/mf.2005.27.2.876286. [DOI] [PubMed] [Google Scholar]
- 25.Cai S., Yang Q., Bagby T.R., Forrest M.L. Lymphatic drug delivery using engineered liposomes and solid lipid nanoparticles. Adv. Drug Deliv. Rev. 2011;63(10-11):901–908. doi: 10.1016/j.addr.2011.05.017. [DOI] [PMC free article] [PubMed] [Google Scholar]
- 26.Mercuri A.M. Quality by design appied to ocular solid lipid nanoparticles containing a hydrophilic peptide prepared via hot high pressure homogeniser. Curr. Drug Deliv. 2016;13(8):1247–1260. doi: 10.2174/1567201813666160325131831. [DOI] [PubMed] [Google Scholar]
- 27.Deshkar S.S., Quazi N.A., Patil A.T., Poddar S.S. Effect of gelucire 44/14 on fluconazole solid lipid nanoparticles: Formulation, optimization and in vitro chatacterization. Drug Deliv. Lett. 2015;5:173–187. doi: 10.2174/221030310503160401121141. [DOI] [Google Scholar]
- 28.Singh I., Swami R., Khan W., Sistla R. Lymphatic system: A prospective area for advanced targeting of particulate drug carriers. Expert Opin. Drug Deliv. 2014;11(2):211–229. doi: 10.1517/17425247.2014.866088. [DOI] [PubMed] [Google Scholar]
- 29.Saraf S., Ghosh A., Kaur C.D., Saraf S. Novel modified nanosystem based lymphatic targeting. Res. J. Nanosci. Nanotechnol. 2011:1–14. [Google Scholar]
- 30.Shah R., Eldridge D., Palombo E., Harding I. Optimisation and stability assessment of solid lipid nanoparticles using particle size and zeta potential. J. Phy. Sci. 2014;1:59–75. [Google Scholar]
- 31.Schwarz C., Mehnert W., Lucks J.S., Muller R.H. Solid lipid nanoparticles (SLN) for controlled drug delivery. I. Production, characterization and sterilization. J. Control. Release. 1994;1:83–96. doi: 10.1016/0168-3659(94)90047-7. [DOI] [Google Scholar]
- 32.Khalil R.M., Abd-Elbary A., Kassem M.A., Ghorab M.M., Basha M. Nanostructured lipid carriers (NLCs) versus solid lipid nanoparticles (SLNs) for topical delivery of meloxicam. Pharm. Dev. Technol. 2014;19(3):304–314. doi: 10.3109/10837450.2013.778872. [DOI] [PubMed] [Google Scholar]
- 33.Emami J., Mohiti H., Hamishehkar H., Varshosaz J. Formulation and optimization of solid lipid nanoparticle formulation for pulmonary delivery of budesonide using Taguchi and Box-Behnken design. Res. Pharm. Sci. 2015;10(1):17–33. [PMC free article] [PubMed] [Google Scholar]
- 34.Yusuf M., Sharma V., Pathak K. Nanovesicles for transdermal delivery of felodipine: Development, characterization, and pharmacokinetics. Int. J. Pharm. Investig. 2014;4(3):119–130. doi: 10.4103/2230-973X.138342. [DOI] [PMC free article] [PubMed] [Google Scholar]
- 35.S.M. Noronha, C.M. NorFlorianionha, C.L. Lino, R.C. Rocha, G Bellettini, I.C Ogliari, P.J Barreto. P.L.M. Optimisation of α- tocopherol loaded solid lipid nanoparticles by central composite design. Ind. Crops Prod. 2013;49:278–285. doi: 10.1016/j.indcrop.2013.04.054. [DOI] [Google Scholar]
- 36.Vivek K., Reddy H., Murthy R.S.R. Investigations of the effect of the lipid matrix on drug entrapment, in vitro release, and physical stability of olanzapine-loaded solid lipid nanoparticles. AAPS PharmSciTech. 2007;8(4):E83. doi: 10.1208/pt0804083. [DOI] [PubMed] [Google Scholar]
Associated Data
This section collects any data citations, data availability statements, or supplementary materials included in this article.
Data Availability Statement
The authors confirm that the data supporting the findings of this research are available within the article.