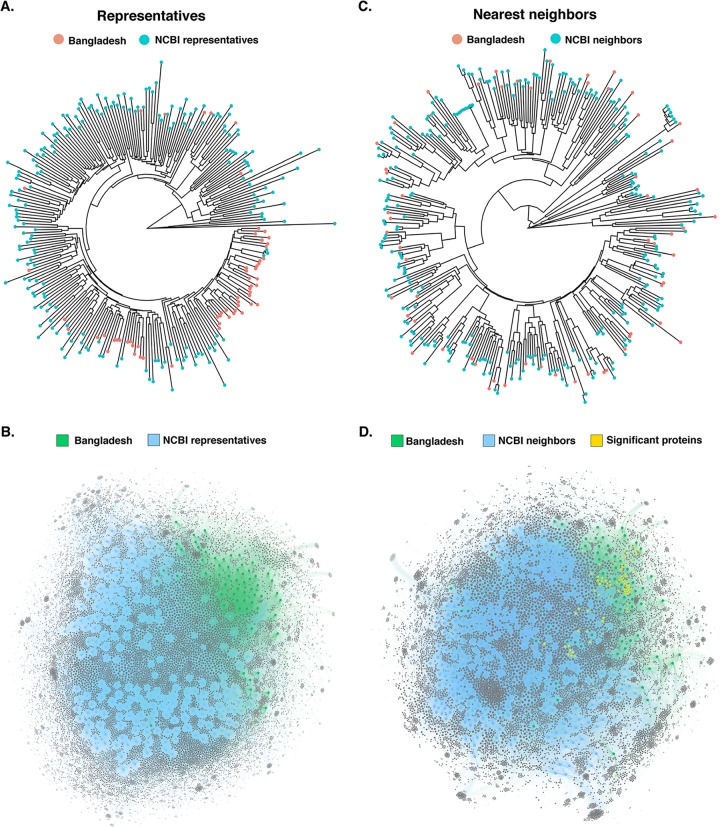
FIG 3.
Phylogenetic distance and accessory genome analyses of soil and fecal E. coli isolates from rural Bangladesh against representative and nearest E. coli genomes available in NCBI. Mash distance hierarchical dendrogram of the 60 Bangladeshi E. coli isolates against 199 representative (A) and 265 nearest-neighbor (C) E. coli genomes available in NCBI (see Table S5 in the supplemental material for the list of the genomes used for comparison). Accessory-genome bipartite network generated by AcCNET with the 199 representative (B) and 265 nearest-neighbor (D) accessory genomes. Proteins with a P value of <0.001 and frequency in Bangladesh data set of >50% are represented.

