Abstract
Continuous respiratory monitoring is extensively important in clinical applications. To effectively assess respiration rate (RR), tidal volume (TV), and minute ventilation (MV), we propose and experimentally demonstrate a respiration monitoring system using an in-line few-mode fiber Mach-Zehnder interferometer (FMF-MZI), which is the first to introduce in-line MZI into an optimal wearable design for respiration rate and volume monitoring. The optimal linear region of the proposed sensor is analyzed and positioned by a flexible arch structure with curvature sensitivity up to 8.53 dB/m−1. Respiration monitoring results are in good agreement with a standard spirometer among different individuals. The difference in TV estimation is ± 0.2 L, and the overall error of MV estimation is less than 5%.
1. Introduction
Obstructive sleep apnea is a common and potentially lethal sleep disorder affecting at least 4% of adult males and 2% of adult females worldwide [1]. From a clinical point of view, respiratory volume monitors (RVMs), which can provide real-time respiration rate and volume information, are significant indicators for obstructive sleep apnea diagnoses [2]. A continuous respiratory assessment has been well recognized as critical to certain disease diagnosis and patient safety, particularly for post-operation of surgical patients. Among the respiratory parameters, respiration rate (RR) refers to the frequency of breaths and is normally expressed as breaths-per-minute (bpm). The irregular alteration of RR is found to be a significant indicator of a series of clinical emergencies, such as asphyxia [3], cardiac abnormality [4], tissue hypoxia [5], sympathetic and parasympathetic responses to trauma [6]. Tidal volume (TV) refers to the volume of air moved into or out of the lungs within each breath, which provides information for respiration depth. Minute ventilation (MV) refers to the amount of air the patient moves in one minute, which can be obtained from the product of the RR and TV. The assessment of TV and MV is commonly used to ensure protective mechanical ventilation without causing trauma to the lungs [7]. Real-time monitoring of RR, TV, and MV plays a vital role in the diagnosis of some diseases such as obstructive sleep apnea and post-operation of surgical patients. So far, the majority of obstructive sleep apnea patients remain undiagnosed prior to surgery [8]. Thus, portable and easy-to-use monitors are highly desired for both out-of-hospital healthcare and clinical care and diagnosis.
To date, various techniques and instruments have been developed for continuous RR and TV monitoring, including contact and non-contact methods [9–14]. For the contact monitoring, sensors are usually placed over the human body to measure respiratory activities, such as airflow [9], blood oxygen saturation (SpO2) [10], electrocardiogram (ECG) morphology [11] and abdominal movement [12]. The non-contact methods usually involve image sensors or radiological technologies without direct contact with the human body, but are often immovable and complicated [13,14]. In a clinical standard, current methods for RR and TV monitoring usually involve specialized devices, including spirometry, impedance pneumography, inductance plethysmography and photo-plethysmography [15]. However, these methods are designed only in hospital tests, and hence, difficult to translate to everyday use due to their high costs, needs for skilled operators, or limited mobility. Meanwhile, with numerous reports on specific solutions or devices, the detected signals are usually electrically modulated by respiratory activities. However, when an anesthetized patient is in magnetic resonance imaging (MRI), traditional electrical/electronic sensors will fail as most of them are susceptible to electromagnetic interference (EMI) [16]. Moreover, electrical devices also inevitably introduce external power sources, like voltages or currents, which may raise safety concerns when contacting with human body [17].
Optical fiber sensors provide an alternative for respiration monitoring due to several advantages, among which are electromagnetic immunity, high sensitivity, lightweight and bio-compatibility [18]. Several optical fiber sensors have recently been proposed for respiration measurement, and their interrogation modes can be classified as wavelength-based and intensity-based [19–24]. For wavelength interrogation, Wo et al. proposed a non-invasive respiration sensor based on distributed Bragg reflector (DBR) fiber laser [19]. Elsarnagawy developed a system for simultaneously heartbeat and respiration rate monitoring using fiber Bragg grating (FBG) [20]. These wavelength-based methods often cause high costs. Intensity interrogation is cost-saving since the optical power can be detected by a photodiode. For example, Yang et al. reported a textile fiber optic microbend sensor for wearable respiration monitoring through the detection of bending loss [21]. Hu et al. designed a zigzag curvature modulator for sedentary respiration monitoring [22]. Di et al. used a fiber-optic deformation sensor for respiration monitoring with a light leakage zone to increase the sensitivity [23]. These sensors exhibit unique and useful properties for RR measurement; however, they may not be suitable for clinical evaluation as they are not able to acquire instantaneous information and actual gas volume exchange. In [24], Petrović et al. employed a long-period fiber grating (LPG) curvature sensors with a curvature sensitivity of approximately 1.45 dB/m−1 for continuous monitoring of respiratory TV, which is based on a correlation between the change in local torso curvature and the change in lung volume. However, the measurement of instantaneous RR is not discussed in this paper. Moreover, due to the out-coupling of light from the core to the radiation cladding modes, the commercial LPG is known as sensitive to changes in ambient parameters. A recent work of Chen et al. proposed a prototype system using a multi-core fiber (MCF) interferometer only for respiration rate monitoring, the performance of the MCF, however, is not presented in this paper [25]. Therefore, the evaluation and adaptation to clinical requirements are still in an exploratory phase in the state of the art.
In an attempt to overcome these challenges, we propose a wearable and compact optical fiber sensor for RR and TV monitoring using an in-line few-mode fiber Mach-Zehnder interferometer (FMF-MZI) based on the interference of two core modes, LP01 and LP11. Compared with most grating-type sensors, the fabricated FMF-MZI features high sensitivity to curvature change, while remaining insensitive to surrounding refractive index (RI) since the interference is centered within the core of FMF [26]. We are the first to successfully fabricate and validate the FMF-MZI optical interferometers for respiration monitoring that is capable of RR, TV, and MV acquisition, which provides a wearable and portable solution for clinical respiratory assessment and long-term home monitoring.
The rest of the paper is organized as follows: Section 2 theoretically analyzes and models the sensing principle and experimentally designed to maximize the sensitivity for respiration monitoring. Section 3 introduces the system design. Section 4 is the validation experiments and results of respiratory monitoring for different individuals. The experimental results are evaluated and calibrated using a standard device. Section 5 summarizes the results of the paper and provides possible improvements for future investigation.
2. Sensing principle and theoretical analysis
2.1. FMF-MZI curvature sensing principle
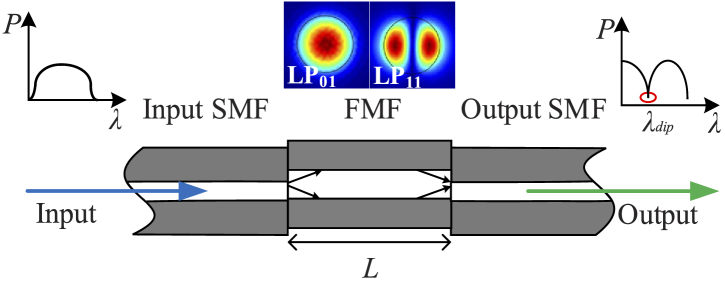
To illustrate the sensor design, we first briefly introduce the sensing principle of an FMF-MZI. The curvature sensor based on an FMF-MZI is shown in Fig. 1 , where an FMF with length L is sandwiched between two single-mode fibers (SMFs) by a commercial fusion splicer (FITEL S178A). The SMF is step-index SMF-28e and the FMF is supplied by YOFC Inc. with only two core modes, LP01 and LP11. An enhanced extinction ratio in the interference spectrum is obtained by introducing an axial offset of 5 µm at each end of the FMF. When light is emitted from a broadband source and launched into the sensor section of FMF through an input SMF, the two modes will be excited in the FMF. After traveling along the FMF, they will interfere at the interface between the FMF and the output SMF. The phase difference between the two modes is determined by:
| (1) |
where λ is the central wavelength, neff1 and neff2 are the effective refractive indices of LP01 and LP11 modes, △neff is the difference of effective refractive indices between the two modes. Thus, the intensity distribution of transmission spectra is given by:
| (2) |
where I01 and I11 are the intensities of the LP01 and LP11 modes, respectively. It is well known that the free spectral range (FSR) will decrease with the increase of interference length L [27]. After repeated experiments, the length of 80 mm is chosen as an appropriate value since at least one valley is included within the range of 1525-1565 nm for interrogation as shown in the inset of Fig. 3(a).
Fig. 1.
Structure of FMF-MZI. (FMF: few-mode fiber; MZI: Mach-Zehnder interferometer; SMF: single-mode fiber)
Fig. 3.
Experimental power loss versus curvature change of the FMF. (a) Power response to the curvature at 1550 nm of the FMF-MZI. The optimal linear region is boxed in the dotted blue line. Inset: Selected transmission spectral under different curvatures. (b) Linear fitting line of the boxed region.
When introducing the FMF-MZI design into respiration monitoring, a change in the abdominal movement is detected as the bending of the FMF attached to the surface. When the sensing portion of the fiber is subjected to external bending, neff1, neff2, and L will vary, which leads to the shift of the phase difference and then the modulate of the light intensity. In a sector, the derivative of length L to curvature C is expressed by:
| (3) |
where θ is the fan angle. Therefore, the sensitivity of curvature induced intensity variation is calculated by:
| (4) |
It can be seen that the sensitivity varies under different curvature values. Therefore, a nonlinear response of curvature induced intensity variation can be expected in a large curvature range, which is experimentally demonstrated in Section 2.2. This sensing principle is similar to fiber gratings like FBG or LPG whose spectral profile is periodically modulated with external perturbation; however, the FMF-MZI has its advantages. First of all, most of the fiber gratings are easily influenced by local ambient conditions, such as temperature varying or surrounding material refractive index change. Besides, the stress or bending sensitivity of most commercial fabricated grating-type fibers is quite limited. For the FMF-MZI used in our study, such a structure features high sensitivity to bending while remaining insensitive to local ambient changes, since the interfered modes are tightly bounded in the fiber core without the intervention of cladding mode.
2.2. FMF-MZI curvature sensing evaluation
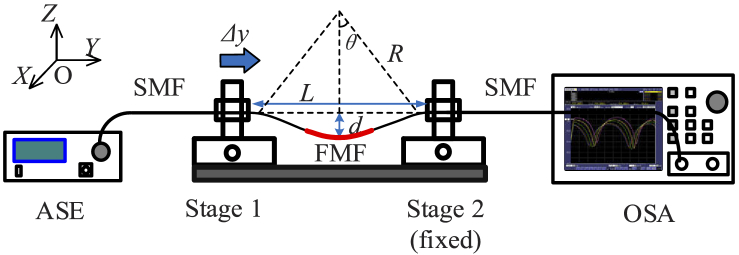
The performance of the FMF curvature sensor is evaluated based on a schematic experimental setup as shown in Fig. 2 . The input SMF is connected to an amplified spontaneous emission (ASE) (Haoyuan HYASECG13MFA) which acts as a broadband light source ranging from 1525 nm to 1565 nm. The output SMF is sent to an optical spectrum analyzer (OSA) (Yokogawa AQ6370C) to monitor the transmission spectrum. A section of FMF-MZI is fabricated with a length of 80 mm based on the experiments described in Section 2.1. In the setup, the entire workspace is considered as a space with coordinates x-y-z as noted in Fig. 2. In the experiment, the fiber sensor is placed on a pair of stages with a distance of L with a resolution of 50 nm. One of the stages is fixed and the other one is movable inward y-direction with an increment of 10 µm. With the movement of Stage 1, the distance L between the two stages will decrease while the bending displacement d will increase. Therefore, the curvature is increased with the displacement Δy and the values can be calculated by adopting the approximation of the sine function to the second-order as [27]:
| (5) |
where L0 (L0>>Δy) is the initial distance between the stages. For practical concern, we evaluate the power variation at 1550nm under different curvature values. The reason is that the light source of this wavelength is an off-the-shelf product with compact design and stable performance. The details of this light source will be presented in 3.2. Figure 3(a) shows the power loss of transmission power at 1550 nm in response to the curvature, which is recorded by the OSA in the experiment. With the curvature changing, the power loss varies. The inset subfigure is the selected transmission spectra under different curvatures. Through the experimental test, we find that the power loss (dB) exhibits a non-linear response to the curvature change ranging from 0 m−1 to 4.5 m−1. An optimal linear region is also obtained in the dotted blue box, indicating the possible working region with maximum sensitivity. The linear fitting result is given in Fig. 3(b) as well. Through linear fitting results, the maximum linear sensitivity of the curvature sensor is up to 8.53 dB/m−1.
Fig. 2.
Schematic diagram of the experimental setup for FMF curvature sensing evaluation. L is the distance between the two stages, d is the bending displacement of the FMF, Δy is the displacement along y-direction, θ is the half angle of the sector, R is the bending radius.
From a clinical point, chest and abdominal wall mobility are usually used for respiratory assessment [28]. In this study, we evaluate respiration by monitoring the abdominal movement. During human respiration monitoring, the abdominal movement is in the level of millimeter or sub-millimeter. This periodic abdominal movement can be sensed by the proposed FMF-MZI under varying the curvature during respiration.
3. System design
3.1. Wearable design
With the theoretical analysis and the experimental validation of the proposed FMF-MZI, we then introduce it to respiration monitoring, which aims to provide a wearable solution for respiratory monitoring.
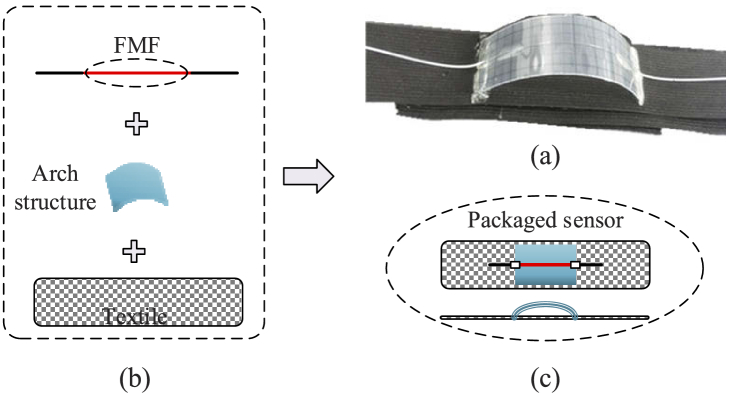
To monitor respiration with maximum sensitivity, the optimal linear region is positioned by a flexible arch structure to create the time-varying FMF curvature caused by periodic abdomen movement during respiration as the structure shown in Fig. 2. The two ends of the structure are well fixed on an elastic textile as shown in Fig. 4(a) . The textile used for respiration monitoring should be flexible, durable and comfortable to wear. To meet these requirements, we use the off-the-shelf product made of spandex and nylon due to their exceptional elasticity and durability. For flexible concern, the two ends of the textile are equipped with Loop and Hook, making it length-adjustable for different individuals with different sizes of waist. Figure 4(b) shows the packaging procedure of the respiration sensor. The sensing section of the fiber is well attached to the arch with an initial curvature within the optimal linear region, allowing the sensor to work at maximum sensitivity when using for respiration monitoring. Instead of placing the sensing fiber directly on the elastic belt, such an arch structure also periodically produces elastic force to the sensing fiber, thus enhance the stability during respiratory movement. Figure 4(c) shows the corresponding top view and side view of the packaged wearable respiration sensor. When the textile is subjected to external stretching, the sensing fiber will bend freely and synchronously with the flexible structure, thus leading to the power change in the transmission spectrum. Besides, the structure ensures that the bending direction is in the same plane vertical to its surface. The mechanical design overcomes the asymmetry issue introduced by the splicing, which may lead to different responses in different bending directions. This power change can then be detected and analyzed for respiration monitoring. Through this wearable design, the FMF curvature change can accurately follow the abdomen movement resulted from respiration and thus the detected signal contains sufficient information for respiration monitoring.
Fig. 4.
Wearable design of the proposed FMF curvature sensor. (a) Picture of the real respiration sensor; (b) packaging procedure for respiration sensor; (c) top view and side view of the proposed packaged wearable sensor.
3.2. System architecture
The entire monitoring system is composed of four major components as shown in Fig. 5(a) , including a light source, the packaged FMF-MZI curvature sensor, a photodiode, and a data acquisition system. To provide a portable and wearable solution, the light source is a 1550 nm handheld laser, and the output signal is detected by an InGaAs photodiode (PDA 10CS (-EC), Thorlabs). The hardware of data acquisition is provided by National Instrument Corp. (USB-6002, NI) and the sampling rate is set with a frequency of 50 Hz, which is large enough for respiration monitoring (normal respiration rate is between 0.2-0.3 Hz) [19], and the data acquisition system is built on a LabVIEW platform. Figure 5(b) shows the wearable design of the FMF-MZI sensor. When the textile is fastened on the abdomen position of a monitored person, the movement of the abdomen will periodically stretch the textile during respiration, thus leading to the curvature change of the flexible structure and the sensor attached on it. In this way, respiratory characteristics can be obtained by monitoring the power loss of the output signal.
Fig. 5.
System architecture. (a) Schematic of respiration monitoring system architecture; (b) wearable design
3.3. Respiration monitoring
With the design, our system is capable of monitoring the three significant parameters for continuous respiration monitoring. RR refers to the frequency of breaths and normally expressed as breaths-per-minute (bpm). For this study, the goal is to test the feasibility of the FMF-MZI sensor for average RR and instantaneous RR monitoring. To accurately acquire RR, we propose to use time-frequency analysis (TFA) since it provides effective methods for analyzing non-stationary signals whose frequency varies over time. The details are shown in Section 4.2 with experimental results.
TV refers to the volume of air into or out of the lungs within each breath, which provides information for respiration depth. Konno and Mead first proposed that the respiration volume exchange could be measured on the surface of the torso [29]. With the measure of the respiration movement on the surface of the torso, it is highly likely to acquire the respiration volume with a data-driven model. The FMF-MZI sensor detects a time-varying signal of respiration including abdominal movement features, which can be used for establishing the data model. To perform this task, a data-driven linear model was applied and then validated through experiments as:
| (6) |
where yi (with the unit of L) is the predicted value of volume for respiration cycle i, xi (with the unit of a.u) is an input feature vector of measured respiration intensity of the same cycle by the FMF-MZI sensor, w is a model coefficient vector and b is the bias. The training process for predicting TV is formulated as:
| (7) |
where the argmin function represents finding the value of w that minimizes the argument, i.e. the loss function, and y is the vector of labeled volume measured by a standard spirometer. The datasets for training the model are divided into training and testing sets. The TV is then calculated by the amplitude difference of two consecutive breath-cycles in the abdominal movement signal. The details of performing on experimental data are shown in Section 4.3.
MV refers to the volume of gas inhaled or exhaled from a person's lung per minute, which is an important parameter in respiratory medicine due to its relationship with blood carbon dioxide levels. For clinical evaluation, we estimate MV by integrating the TV over one minute, , where Δt is one minute and Vsensor min is the MV value estimated by the optical fiber sensor. To estimate the accuracy of the proposed FMF-MZI sensor for MV measurement, we use a clinical spirometer for validation in the experiments and calculate its relative error as measured by the optical sensor and the spirometer, respectively. The relative error is defined by:
| (8) |
where Vspiro min is the actual MV measured by the spirometer. The proposed FMF-MZI sensor for respiration monitoring is then validated in experiments and the results are illustrated in Section 4.4.
4. Experiments and results
4.1. Respiration monitoring validation
For respiration monitoring validation, five healthy volunteers aged 23-25 years old are recruited. The volunteers are students from Tianjin University (TJU). Before the experiments, the experimental procedure was clearly explained to each participant and written consent was also obtained before data recording. This study was approved by the ethical committee of the Department of Biomedical Engineering at TJU before experiments.
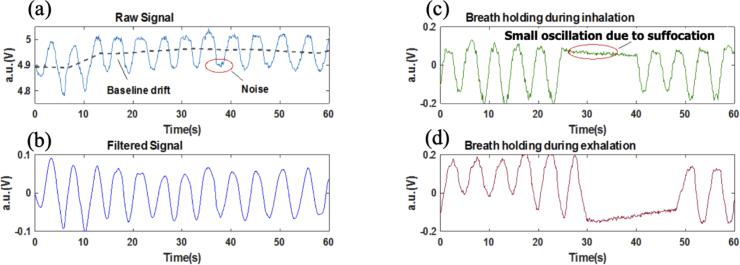
During the experiments, the elastic textile is fastened on the abdomen position of different participants and they are asked to relax and breathe normally for a time period. A minute sample of the respiration signal detected by the FMF curvature sensor is shown in Fig. 6(a) . From the results, we observe that the detected respiration raw signal changes with time periodically, indicating the behavior of inhalation and exhalation are well recorded and presented. The original waveform is improved using a low pass filter to remove 50 Hz powerline interference and other high-frequency noises. Unavoidable baseline drift due to motion artifacts is further eliminated using a wavelet decomposition algorithm. The issue of body movement during respiration monitoring, which exists in all current optical fiber sensors [18–24], is still an open problem for future research. The original signal is processed with MATLAB (Mathworks, Inc.) and the results are shown in Fig. 6(b).
Fig. 6.
Respiration waveform of one volunteer. (a) Raw signal; (b) filtered signal; (c) breath-holding during inhalation; (d) breath-holding during exhalation.
Besides, to validate the feasibility of apnea detection by the proposed sensing system, the scenario of apnea simulation is also investigated in the experiments. The volunteers were asked to breathe normally in the beginning and then hold the breath for about 15 seconds. The results of breath-holding during inhalation and exhalation are shown in Fig. 6(c) and Fig. 6(d), respectively. From the waveform, we observe a period of a flat area which corresponds to the temporary stop of breathing. There are some small oscillations at this period. It can be explained that the subject did not keep the abdomen stable during breath-holding [23]. Thus, the results show that the respiration system could be used for monitoring transient sleep apnea, which is promising for long-term monitoring and clinical diagnosis due to the ease of wearability.
4.2. Respiration rate monitoring
To analyze the frequency distribution, Fast Fourier Transform (FFT) is applied and the respiration frequency is acquired. Figure 7(a) and Fig. 7(b) show the frequency spectrums of volunteer 1 (male) and volunteer 5 (female), respectively. It can be seen that the peak values of the frequency spectrums are within the range of 0.2-0.4 Hz, which is in agreement with the physical truth [19]. The difference in results indicates that the proposed FMF-MZI sensor can distinguish the respiratory characteristics of different individuals.
Fig. 7.
Normalized respiration frequency spectrum of different volunteers. (a) A typical result from a male volunteer; (b) a typical result from a female volunteer.
The use of classical FFT can process signals that are stationary and infinite in time. However, the respiration waveform could change gradually or abruptly with physiological conditions. For obstructive sleep apnea, it is a typical respiratory disorder featured by repetitive episodes of shallow or paused breathing during sleep. Therefore, time-frequency analysis (TFA) is proposed to use since it provides effective methods for analyzing non-stationary signals whose frequency varies over time. In this study, we use smoothed pseudo-Wigner-Ville distribution (SPWVD) to estimate the instantaneous RR of the subject during continuous monitoring. SPWVD is an improvement of traditional Wigner-Ville distribution (WVD), which attempts to reduce the interference of cross-terms by introducing smoothing windows as given by:
| (9) |
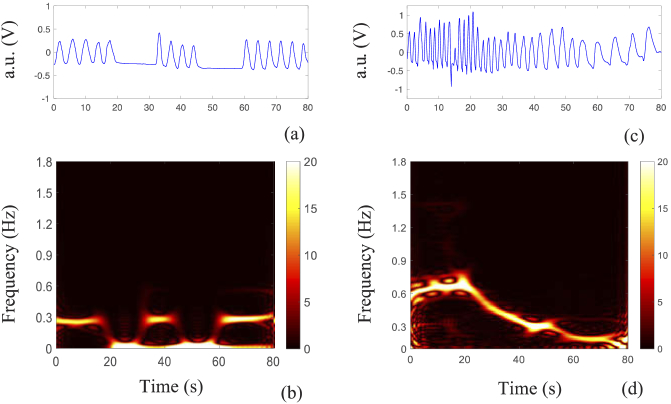
where x(t) and x*(t) are the detected signal and its complex conjugate, respectively; h(•) and g(•) are the smoothing windows in the frequency and time domain, respectively. Figure 8(a) and Fig. 8(c) shows the respiration waveform during respiration apnea and respiration recovery after strenuous exercise. The corresponding instantaneous RR estimation via the SPWVD is shown in Fig. 8(b) and Fig. 8(d), respectively. The maximum energy indicates the frequency at each time instant. From Fig. 8(b), the energy concentrates on 0.3 Hz when breathing normally while drops to 0 Hz when respiration disappeared, which corresponds to the flat area in the time domain. Figure 8(d) shows the respiration recovery of a volunteer after strenuous exercise. It can be observed that the subject was breathing fast after exercise, while it dropped to a normal rate in the following period.
Fig. 8.
Instantaneous respiration rate analysis (a) filtered respiration apnea in the time domain; (b) respiration apnea in the frequency domain; (c) filtered respiration recovery in the time domain; (d) respiration recovery in the frequency domain.
With the SPWVD transformation, the instantaneous RR of the respiratory signal can be effectively analyzed to help medical staff to locate the local characteristics of patients’ respiration, and thus prevent potential danger.
4.3. Tidal volume estimation
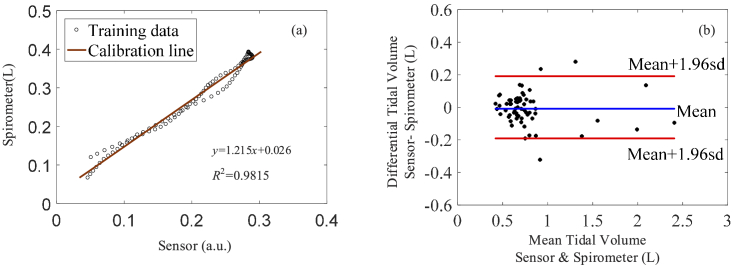
To validate the wearable optical fiber respiration monitoring system for TV estimation, a standard spirometer system (BH-AX-MAPG) is used to record the volume signal for calibration. The spirometer system consists of a respiration flow head connected to a differential pressure transducer to measure the air exchange. As illustrated in Section 3.3, the acquisition of the TV by our proposed system is divided into two steps as data training and testing. In the training phase, we randomly select a set of training data for calibration. A calibration function is obtained by linear regression between the reference signal and the sensor signal as Eq. (4). The entire experiment for each subject last for 3 mins, which can generate a raw dataset from the sensor and the spirometer with a sampling frequency of 50 Hz. After preprocessing, the entire signal is windowed by one second to generate sufficient datasets to acquire the proposed data-driven model for TV acquisition. Each subject thus has approximately 180 datasets for training and testing, in which 70% of these datasets are used as training data and 30% are used as testing data. We found that with increasing the training data from 70% to 80%, the successful rate does not significantly affect the results and thus choose 70% as the minimum for training. After training, the data-driven model is robust for the following testing to estimate TV values for individuals. The medical metric named the Bland-Altman plot is used to evaluate our predictive performance on the testing dataset which is shown in Fig. 10(b). It should be noticed that the calibration function is individual dependent, thus the experiment test should be performed on the same subject after data training. In the testing phase, the established function is used to map the volume variations detected by the sensor.
Fig. 10.
Calibration and estimation of TV measurement. (a) Calibration line of training data, (b) Bland-Altman plot of TV test. (The blue line indicates the bias and the red line indicates the 95% limits of agreements.)
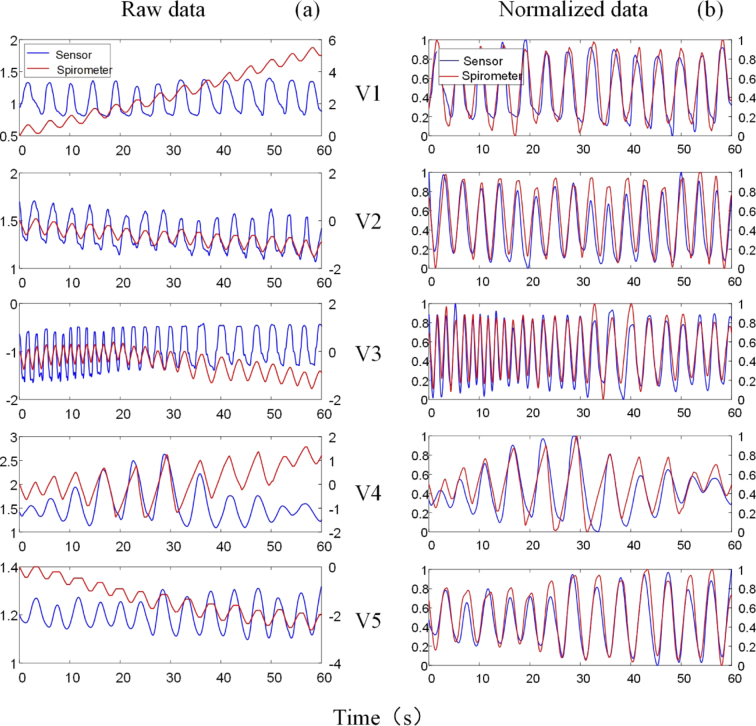
Figure 9(a) shows a minute sample of the raw respiration signals from the sensor and the spirometer. The wavelet decomposition is implemented to eliminate the noise and baseline drift in the MATLAB wavelet toolbox. Figure 9(b) shows the normalized waveform of filtered signals. To numerically analyze the performance of the sensor, Table 1 presents the correlation using the spirometer as reference. r is the Pearson correlation coefficient, which is defined by:
| (10) |
where xi and yi are the sample values of the two groups of data acquired by the sensor and the spirometer, respectively; N is the sample size of the data. p represents the statistical significance of the two groups of data. From the records, a high correlation coefficient (<0.8) and low statistical significance (p < 0.001) are found between the sensor and the spirometer, indicating the proposed optical fiber sensor is highly correlated with the standard device, and hence effective for respiration monitoring.
Fig. 9.
Experimental results of respiration signals from the FMF-MZI sensor and the spirometer. (a) Raw signals, (b) normalized signals after filtering and detrending.
Table 1. Results of abdominal movement signals correlated to volume signals from spirometer.
| No. | r | p | N |
|---|---|---|---|
| V1 | 0.904 | <0.001 | 3000 |
| V2 | 0.896 | <0.001 | 3000 |
| V3 | 0.928 | <0.001 | 3000 |
| V4 | 0.809 | <0.001 | 3000 |
| V5 | 0.935 | <0.001 | 3000 |
For TV estimation, Fig. 10(a) shows the data training results of one subject. The scattering points indicate that the amplitude of the abdominal movement detected by the sensor and the reference volume signal measured by the spirometer are linearly correlated. Figure 10(b) shows the Bland-Altman plot of TV estimation for test subjects. The statistical results show that when calibrating on a subject-by-subject basis, the optical fiber sensor produces a bias of 0.0085 L and a standard deviation of 0.19 L. Accordingly, the 95% limit of agreements were about -0.2-0.2 L, indicating the maximum error for TV estimation is within 0.2 L.
4.4. Minute ventilation estimation
The MV estimation is based on the measured TV values as it refers to the product of RR and TV in one minute. During experiments, 3 mins of data for each subject are recorded, thus we calculate the average of the 3 mins for each subject. With the TV values obtained from Section 4.3, the calculated MV results are listed as the second column in Table 2 .
Table 2. Results of minute volume estimation and its relative error.
| No. | MV (L/min) | Difference(L) | MVerror(%) | |
|---|---|---|---|---|
| Sensor | Spirometer | |||
| V1 | 9.1509 | 8.8863 | 0.2646 | 2.98 |
| V2 | 9.7393 | 9.8203 | 0.0810 | 0.82 |
| V3 | 19.5590 | 19.9899 | 0.4309 | 2.16 |
| V4 | 15.2874 | 15.7073 | 0.4199 | 2.67 |
| V5 | 7.7684 | 7.4102 | 0.3582 | 4.83 |
To evaluate the proposed MV measurement method based on our FMF-MZI sensor, the MV error calibrated by the clinical spirometer system is defined by Eq. (6) and discussed in Section 3.3. In the experiment, we measure the MV by the FMF-MZI sensor and the spirometer simultaneously and the MVerror for each subject is then calculated and also listed in Table 2. The lowest error can reach 0.82% whereas the maximum is 4.83%. From the statistical results, the overall error of MV estimation can be within 5%.
5. Conclusion
In this paper, we propose an optical respiration monitoring method based on an FMF-MZI sensor, which is capable of monitoring the significant respiratory parameters, RR, TV, and MV through a wearable design. We carefully consider the curvature sensitivity and the optimal linear working region of the fiber sensor through experimental design to achieve maximum sensitivity for accurate respiration monitoring. Through wearable design, the linear working reign is positioned by an arch structure, which is easily wearable on human abdomen for long-term continuous monitoring. The proposed respiratory monitoring system is then validated on different individuals. The instantaneous rate of the abnormal respiratory waveform is analyzed, and the TV and MV are estimated through a simultaneous test with a standard spirometer. The experimental results show that the sensitivity of the respiration sensor is up to 8.53 dB/m−1 when working in the linear region. Respiration monitoring results are in good agreement with those measured by a standard clinical spirometer. The maximum difference in TV estimation is 0.2 L, and the overall error of MV estimation is less than 5%. This optical fiber-based sensor shows high feasibility for long-term monitoring for clinical applications especially for post-operation and care for surgical patients.
Funding
National Natural Science Foundation of China10.13039/501100001809 (61875152, U1813207).
Disclosures
The authors declare that there are no conflicts of interest related to this article.
References
- 1.Tran V. P., Ali Al-Jumaily A., “Non-contact real-time estimation of intrapulmonary pressure and tidal volume for chronic heart failure patients,” in Proceedings of Annual International Conference of the IEEE EMBS (IEEE, 2016), pp. 3564–3567. [DOI] [PubMed] [Google Scholar]
- 2.Voscopoulos C., Ladd D., Campana L., George E., “Non-invasive respiratory volume monitoring to detect apnea in post-operative patients: case series,” J. Clin. Med. Res. 6(3), 209–214 (2014). 10.14740/jocmr1718w [DOI] [PMC free article] [PubMed] [Google Scholar]
- 3.Chenivesse C., Similowski T., Bautin N., Fournier C., Robin S., Wallaert B., Perez T., “Severely impaired health-related quality of life in chronic hyperventilation patients: Exploratory data,” Respir. Med. 108(3), 517–523 (2014). 10.1016/j.rmed.2013.10.024 [DOI] [PubMed] [Google Scholar]
- 4.Bonsignore M., Marrone O., Insalaco G., Bonsignore G., “The cardiovascular effects of obstructive sleep apnoeas: analysis of pathogenic mechanisms,” Eur. Respir. J. 7(4), 786–805 (1994). 10.1183/09031936.94.07040786 [DOI] [PubMed] [Google Scholar]
- 5.Joshi A., Gerhardt T., Shandloff P., Bancalari E., “Blood transfusion effect on the respiratory pattern of preterm infants,” Surv. Anesthesiol. 32(2), 121 (1988). 10.1097/00132586-198804000-00050 [DOI] [PubMed] [Google Scholar]
- 6.Fathizadeh P., Shoemaker W., Wo C., Colombo J., “Autonomic activity in trauma patients based on variability of heart rate and respiratory rate,” Crit. Care Med. 32(6), 1300–1305 (2004). 10.1097/01.CCM.0000127776.78490.E4 [DOI] [PubMed] [Google Scholar]
- 7.Semmes B., Tobin M., Snyder J., Grenvik A., “Subjective and objective measurement of tidal volume in critically iii patients,” Chest 87(5), 577–579 (1985). 10.1378/chest.87.5.577 [DOI] [PubMed] [Google Scholar]
- 8.Zhang X., Kassem M., Zhou Y., Shabsigh M., Wang Q., Xu X., “A brief review of non-invasive monitoring of respiratory condition for extubated patients with or at risk for obstructive sleep apnea after surgery,” Front. in Med. 4, (2017). [Online]. Available: https://www.frontiersin.org/articles/10.3389/fmed.2017.00026/full [DOI] [PMC free article] [PubMed] [Google Scholar]
- 9.Kermit M., Eide Å, Lindblad T., Waldemark K., “Treatment of obstructive sleep apnea syndrome by monitoring patients airflow signals,” Pattern Recognit. Lett. 21(3), 277–281 (2000). 10.1016/S0167-8655(99)00157-9 [DOI] [Google Scholar]
- 10.Leonard P., “Standard pulse oximeters can be used to monitor respiratory rate,” Emerg. Med. J. 20(6), 524–525 (2003). 10.1136/emj.20.6.524 [DOI] [PMC free article] [PubMed] [Google Scholar]
- 11.Sayadi O., Weiss E., Merchant F., Puppala D., Armoundas A., “An optimized method for estimating the tidal volume from intracardiac or body surface electrocardiographic signals: implications for estimating minute ventilation,” Am. J. Physiol.-Heart Circul. Physiol. 307(3), H426–H436 (2014). 10.1152/ajpheart.00038.2014 [DOI] [PMC free article] [PubMed] [Google Scholar]
- 12.Lafortuna C., Passerini L., “A new instrument for the measurement of rib cage and abdomen circumference variation in respiration at rest and during exercise,” Eur. J. Appl. Physiol. Occup. Physiol. 71(2-3), 259–265 (1995). 10.1007/BF00854988 [DOI] [PubMed] [Google Scholar]
- 13.Aoki H., Nakamura H., “Non-contact respiration measurement during exercise tolerance test by using kinect sensor,” Sports 6(1), 23 (2018). 10.3390/sports6010023 [DOI] [PMC free article] [PubMed] [Google Scholar]
- 14.Transue S., Nguyen P., Vu T., Choi M., “Real-time tidal volume estimation using iso-surface reconstruction,” in Proceedings of IEEE First International Conference on Connected Health: Applications, Systems and Engineering Technologies (IEEE, 2016). [Google Scholar]
- 15.Reyes B., Reljin N., Kong Y., Nam Y., Chon K., “Tidal volume and instantaneous respiration rate estimation using a volumetric surrogate signal acquired via a smartphone camera,” IEEE J. Biomed. Health Inform. 21(3), 764–777 (2017). 10.1109/JBHI.2016.2532876 [DOI] [PubMed] [Google Scholar]
- 16.Dziuda L., “Fiber-optic sensors for monitoring patient physiological parameters: a review of applicable technologies and relevance to use during magnetic resonance imaging procedures,” J. Biomed. Opt. 20(1), 010901 (2015). 10.1117/1.JBO.20.1.010901 [DOI] [PubMed] [Google Scholar]
- 17.Fernandes M., Correia J., Mendes P., “Photonic sensing of electrophysiological activity for wearable applications,” IEEE J. Sel. Top. Quantum Electron. 20(2), 112–120 (2014). 10.1109/JSTQE.2013.2294455 [DOI] [Google Scholar]
- 18.Roriz P., Frazão O., Lobo-Ribeiro A., Santos J., Simões J., “Review of fiber-optic pressure sensors for biomedical and biomechanical applications,” J. Biomed. Opt. 18(5), 050903 (2013). 10.1117/1.JBO.18.5.050903 [DOI] [PubMed] [Google Scholar]
- 19.Wo J., Wang H., Sun Q., Shum P., Liu D., “Noninvasive respiration movement sensor based on distributed Bragg reflector fiber laser with beat frequency interrogation,” J. Biomed. Opt. 19(1), 017003 (2014). 10.1117/1.JBO.19.1.017003 [DOI] [PubMed] [Google Scholar]
- 20.Elsarnagawy T., “A simultaneous and validated wearable FBG heartbeat and respiration rate monitoring system,” Sens. Lett. 13(1), 48–51 (2015). 10.1166/sl.2015.3407 [DOI] [Google Scholar]
- 21.Yang X., Chen Z., Elvin C. S. M., Janice L. H. Y., Ng S. H., Teo J. T., Wu R., “Textile fiber optic microbend sensor used for heartbeat and respiration monitoring,” IEEE Sens. J. 15(2), 757–761 (2015). 10.1109/JSEN.2014.2353640 [DOI] [Google Scholar]
- 22.Hu H., Sun S., Lv R., Zhao Y., “Design and experiment of an optical fiber micro bend sensor for respiration monitoring,” Sens. Actuators, A 251, 126–133 (2016). 10.1016/j.sna.2016.10.013 [DOI] [Google Scholar]
- 23.Di H., Sun S., Che Y., “Respiration measurement using fibre-optic deformation sensor,” J. Mod. Opt. 64(6), 639–645 (2017). 10.1080/09500340.2016.1255367 [DOI] [Google Scholar]
- 24.Petrović M. D., Petrovic J., Daničić A., Vukčević M., Bojović B., Hadžievski L. J., Allsop T., Lloyd G., Webb D. J., “Non-invasive respiratory monitoring using long-period fiber grating sensors,” Biomed. Opt. Express 5(4), 1136–1144 (2014). 10.1364/BOE.5.001136 [DOI] [PMC free article] [PubMed] [Google Scholar]
- 25.Chen S., Tan F., Huang Z., Yang T., Tu J., Yu C., “Non-invasive smart monitoring system based on multi-core fiber optic interferometers,” in Proceedings of Asia Communications and Photonics Conference (IEEE, 2018), pp. 1–3. [Google Scholar]
- 26.Wang B., Zhang W., Bai Z., Zhang L., Yan T., Chen L., Zhou Q., “Mach–Zehnder interferometer based on interference of selective high-order core modes,” IEEE Photonics Technol. Lett. 28(1), 71–74 (2016). 10.1109/LPT.2015.2483518 [DOI] [Google Scholar]
- 27.Wang Y., Richardson D., Brambilla G., Feng X., Petrovich M., Ding M., Song Z., “Intensity measurement bend sensors based on periodically tapered soft glass fibers,” Opt. Lett. 36(4), 558–560 (2011). 10.1364/OL.36.000558 [DOI] [PubMed] [Google Scholar]
- 28.Kaneko H., Horie J., “Breathing Movements of the Chest and Abdominal Wall in Healthy Subjects,” Respir. Care 57(9), 1442–1451 (2012). 10.4187/respcare.01655 [DOI] [PubMed] [Google Scholar]
- 29.Konno K., Mead J., “Measurement of the separate volume changes of rib cage and abdomen during breathing,” J. Appl. Physiol. 22(3), 407–422 (1967). 10.1152/jappl.1967.22.3.407 [DOI] [PubMed] [Google Scholar]


