Abstract
In this work the terahertz spectra of benzene, toluene, p-xylene and styrene–four volatile organic compounds (VOCs) of interest in environmental pollution studies–have been measured in their liquid phase at room temperature using terahertz time-domain spectroscopy (THz-TDS). Their frequency-dependent refractive index and absorption coefficient have been extracted and analyzed in the spectral range from 0.2 to 2.5 THz. The optical properties of bi-component VOCs mixtures have also been investigated and described in terms of a linear combination of pure VOCs optical components.
1. Introduction
VOCs belong to a broad family of organic compounds characterized by different functional groups, including various aromatic chloro hydrocarbons and perfluorocarbons, such as organic solvent thinners, degreasers, cleaners, lubricants, inflammable liquids [1–4]. VOCs, both in liquid and gas phases, are emitted from a variety materials during technological processes as, chemical and petrochemical activities and from building products and furnishing materials [5]. Thus, VOCs deserve special considerations as a potential source of risk for humans and environment [6–9]. As VOCs are increasingly recognized as pollutants [2,3,9], a fast, non-destructive, and useful tool for their detection and chemical identification is highly desirable, with a focus on low-cost, low-power consumption and low-time consuming devices. New and advanced technologies, such as Terahertz (THz) spectroscopies, may provide complementary methods to conventional analytical approaches [10–17]. In particular, THz spectroscopy offers many advantages: the low photon energy of THz radiation (i.e., 4 meV at 1 THz) allows its propagation through inflammable liquids without causing combustion [18], at the same time, THz light is non-ionizing and sensitive to polar molecules. The photon energy of THz wave coincides with energy levels corresponding to low-frequency motions, such as the vibration, rotation and translation modes of molecules in their condensed phases, and intermolecular vibrations such as hydrogen bonds. With these properties, THz-TDS spectroscopy is a promising technique for the characterization of different solid and liquid materials in a wide range of research fields [19–23]. THz-TDS spectroscopy has the advantages over traditional Fourier transform infrared spectroscopy (FTIR): it is insensitive to the thermal background, showing a higher SNR and does not require the using of cooling detectors. More importantly, THz-TDS relies on the synchronous and coherent detection, in which both the amplitude and the phase of a THz pulse are measured [24]. For this reason, the technique is capable of evaluating the optical properties, the refractive index in addition to absorption coefficient, without using the Kramers-Kronig relations [24].
Some VOCs, especially those belonging to the hydrocarbon species such as benzene, have been widely studied both in the microwave frequencies [25] and in the far-infrared region [15–17]. Liquid benzene has been preliminary characterized by Barnes et al. [15] in the frequency range from 2.1-7.5 THz, and Mrozek et al. [17] studing its transmittance vs. pressure in the 1.5-19.5 THz spectral range. Rønne et al. have reported a comparison between the THz absorption spectra of liquid toluene and benzene [26]. Moreover, Zheng et al. [27] experimentally characterized three benzene isomers in solid-phase, investigating the temperature dependence of their intermolecular dynamics. These data are integrated by solid-state DFT to theoretically simulate and assign the observed THz isomers spectra, obtaining a good agreement between experimental and calculated spectra. Regarding applied researches, Ikeda et al. [18] studied inflammable liquids (gasoline, kerosene and toluene) stored in standard beverage plastic bottles by THz-TDS. They showed that the differences in the transmittance and refractive index in the THz region (0.3-1.8 THz) allow the distinction among those compounds suggesting the use of THz-TDS as screening and discrimination tool for these substances in the liquid phase.
In this manuscript, we address the application of THz-TDS spectroscopy by investigating four different VOCs: benzene, styrene, toluene, and p-xylene, in their liquid phase. The chemical structures of VOCs here investigated are characterized by the same benzene ring, modified by different C-Hx functional groups, which are expected to induce changes in their optical properties. These modifications, which have been identified in this study, can be potentially used as identification markers for their recognition in bi- and multi-component mixtures. With this aim, we report below the experimental setup, a description of the collected THz data and their analysis with relative discussions.
2. Materials and methods
2.1. Experimental setup and methods
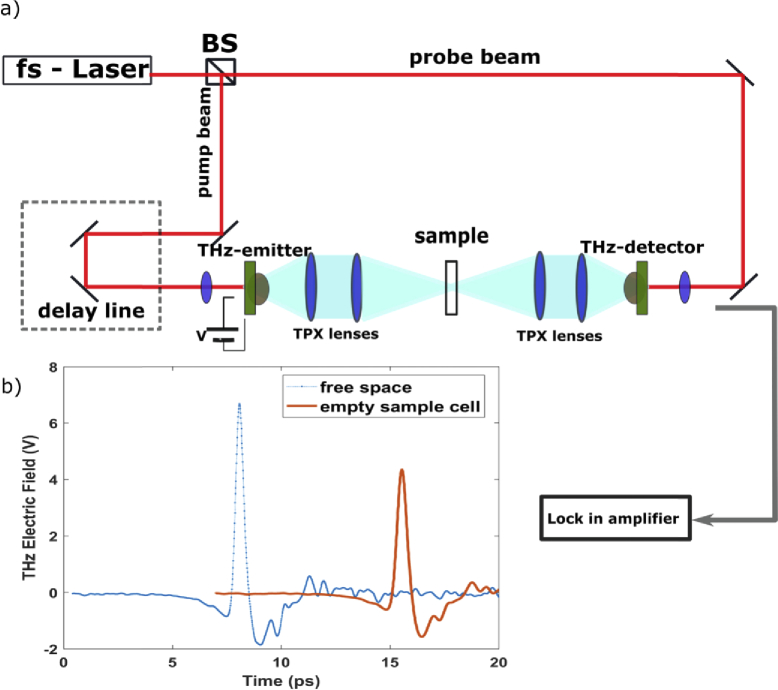
The THz-TDS technique, described in detail in [14,18,19,23,24], was used to investigate the THz optical properties of liquid VOCs. Our homemade THz-TDS setup is depicted in Fig. 1(a). We use a femtosecond pulse laser (FemtoFiber NIRpro, Toptica), to illuminate twin G10620-11 Hamamatsu photoconductive antennas (PCAs) emitting, and collecting THz radiation. The temporal width of the laser is 100 fs and its central wavelength is 780 nm. Its repetition rate is 80 MHz, with an average power of 150 mW. TPX lenses are used to collimate and focalize THz radiation in the interval 0.2-2.5 THz.
Fig. 1.
a) Schematic optical layout of the experimental THz-TDS setup. b) Profiles of free space (blue dotted line) and empty sample cell (red solid line) THz signals are reported.
The sample cell is aligned in the focus of the THz beam with a manual micrometric stage, with the cell windows perpendicular to the propagating THz radiation. After transmission through the sample, THz pulses are collimated and refocused on the THz-detector PCA by TPX lenses. Simultaneously, the probe beam is used to gate the THz-detector PCA, and the THz electric field as a function of time is measured with a delay line [14,20]. The output signal from the THz-detector, extracted by a Stanford lock-in amplifier, is transferred to a National Instrument acquisition card allowing the data collection. Our optical system provides a spectral bandwidth ranging from 0.2 to 2.5 THz, the signal-to-noise ratio (SNR) and dynamic range (DR) are 780 and 970 in the frequency domain, respectively [28] with a spectral resolution of 50 GHz.
2.2. Sample preparation
The investigated VOC samples are reagent grade benzene (C6H6 - Sigma Aldrich - Purity (GC) >99.0%), styrene (C8H8 - Sigma Aldrich - Purity (GC) >99.0%), toluene (C7H8 - Sigma Aldrich - Purity (GC) >99.75%) and p-xylene (C8H10 - Sigma Aldrich - Purity (GC) >99.0%). The liquids were sealed in quartz Suprasil cells transparent for visible light and exhibiting a high-frequency THz cut-off at 2.5 THz. The sample thickness was fixed at 5 mm; the tolerance of the optical path as given by the manufacturer is ± 0.01 mm.
3. Results and discussion
The THz properties of the four VOC samples in their liquid phase at room temperature can be described in terms of their frequency-dependent refractive index n(ν) and absorption coefficient α(ν). These optical parameters can be extracted through the following equations [24]:
| (1) |
| (2) |
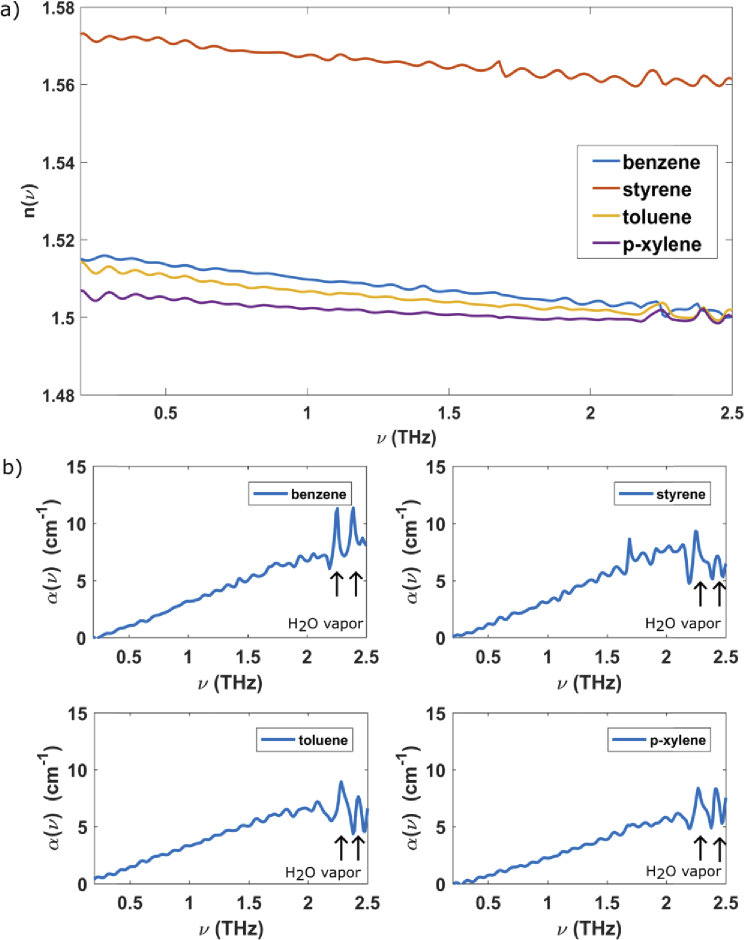
where d is the thickness of the sample, and are the transmitted THz electric fields from sample, and reference in the frequency domain, and represent their respective phases, and c is the speed of light. In Fig. 1(b), two examples of THz electric fields are reported. The dotted line represents the THz electric field produced by the PCAs and propagating in free space, and the solid line concerns the THz electric field transmitted by the empty sample cell (reference). and are reported in Fig. 2(a), and 2b for all VOCs measured in this experiment. The refractive indexes (Fig. 2(a)), measured by THz-TDS, vary between 1.501 to 1.564 at 1.5 THz, with accuracy of ± 0.001. Styrene has the highest refractive index (1.564) while benzene, toluene and p-xylene show similar refractive index equal to 1.507, 1.504 and 1.501, respectively. The refractive index variation along the four VOCs is in agreement with the refractive index-mass density relationship [29,30]. A denser material, in this case styrene, tends to a have a larger refractive index because the applied field induces a greater number of electric dipoles [29,30]. Figure 2(b) displays the absorption coefficients of the studied VOCs as a function of frequency. Here the peaks at high frequency are instrumental and due to not well-compensated water absorption. The VOCs absorption coefficients are different each other above 0.5 THz, due to the difference of their molecular dipole moments. The absorption coefficients vary between 3.87 to 5.44 cm−1 and accuracy of ± 0.01 cm−1 at 1.5 THz: styrene has the highest absorption coefficient (5.44 cm−1), instead benzene, toluene and p-xylene show absorption coefficients equal to 4.98, 5.05 and 3.87 cm−1, respectively. Although our VOC samples have similar molecular structures, THz-TDS successfully discriminates them in terms of their refractive and absorption parameters.
Fig. 2.
a) The refractive indexes and b) absorption coefficients of benzene, styrene, toluene and p-xylene vs. frequency. Arrows indicate not compensated water absorptions.
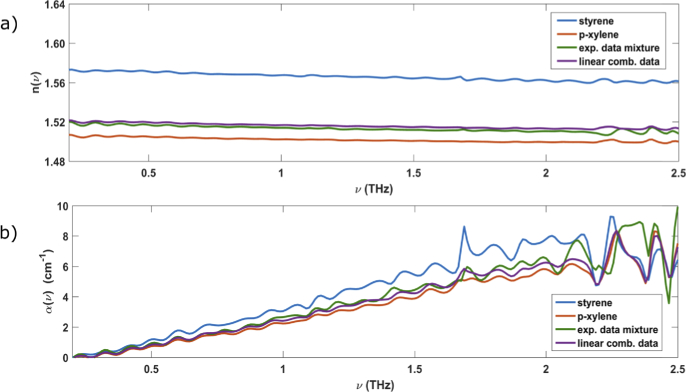
Successively, we have measured the optical properties of bi-components mixture. For instance, Fig. 3(a) and 3(b) display the refractive index and the absorption coefficient of a styrene/p-xylene mixture in comparison to those of pure compounds. More specifically, we have prepared 1800 µl of solution mixing, in volume fractions, 0.22 ± 0.06 and 0.78 ± 0.05 of styrene and p-xylene, respectively. The refractive index of this mixture (green line, in Fig. 3(a)) lies between those of the pure compounds (blue and red lines in Fig. 3(a) for styrene and p-xylene, respectively). Similar results have been obtained for other mixtures.
Fig. 3.
a) The refractive indexes and b) absorption coefficients of pure styrene (blue) and p-xylene (red) in their liquid phase at room temperature. The experimental data (green lines) of mixture can be well represented through a linear combination (purple lines) of optical data of pure styrene and p-xylene with volume fractions corresponding to their nominal values (see text).
Both the absorption coefficient α(ν)mix and the refractive index n(ν)mix of the mixture can be described through a linear combination [29–31] of the absorption coefficients and refractive index of the pure VOCs:
| (3) |
| (4) |
where xS and xP are the volume fractions of styrene and p-xylene, respectively with . The purple line represents, through Eq. (3), the refractive index of the mixture, showing a good agreement with the measured value. A similar agreement can be achieved by comparing the experimental absorption coefficient of the mixture (green line, Fig. 3(b)), with that calculated through Eq. (4) (purple line, Fig. 3(b)). This result (which is independent of the mixed components and their volume fractions), suggests that the interaction energy is very low in this mixture [32] and this is probably determined by the low polar nature of VOCs molecules. Analogous results (not shown) have been observed for other mixtures.
4. Conclusion
The optical THz properties of benzene, styrene, toluene and p-xylene VOCs in their liquid phase have been investigated by THz-TDS technique. Although the samples have similar molecular structures, the measurements of the refractive index and the absorption coefficient in the THz region (0.2-2.5 THz) revealed that specific VOCs can be efficiently discriminated, demonstrating the sensitivity of the THz spectroscopy method for the detection of aromatic hydrocarbons in their liquid phase. A significant change in the refractive index obtained for the mixture of styrene and p-xylene with respect to the pure solvents proves that THz-TDS can be employed also as a quantitative technique for the detection of different VOCs and the identification of mixtures of them. Moreover, our results suggest the possibility to use THz-TDS as alternative detection tool for pollutant liquids, and could also be applied to gaseous phase recognition possibly increasing its sensitivity through plasmonic devices [33] and allowing detection of those chemicals in a more realistic situation.
Acknowledgments
We like to acknowledge A. Macagnano of the Institute of Atmospheric Pollution Research (IIA) of the National Research Council (CNR) for providing us the VOC samples used in this research.
Disclosures
The authors declare that there are no conflicts of interest related to this article.
References
- 1.Khan F. I., Kr. Ghoshal A., “Removal of Volatile Organic Compounds from polluted air,” J. Loss Prev. Process Ind. 13(6), 527–545 (2000). 10.1016/S0950-4230(00)00007-3 [DOI] [Google Scholar]
- 2.Lee S. C., Chiu M. Y., Ho K. F., Zou S. C., Wang X., “Volatile organic compounds (VOCs) in urban atmosphere of Hong Kong,” Chemosphere 48(3), 375–382 (2002). 10.1016/S0045-6535(02)00040-1 [DOI] [PubMed] [Google Scholar]
- 3.Liu Y., Shao M., Fu L., Lu S., Zeng L., Tang D., “Source profiles of volatile organic compounds (VOCs) measured in China: Part I,” Atmos. Environ. 42(25), 6247–6260 (2008). 10.1016/j.atmosenv.2008.01.070 [DOI] [Google Scholar]
- 4.Al-Douseri F. M., Chen Y., Zhang X. C., “THz wave sensing for petroleum industrial applications,” Int. J. Infrared Millimeter Waves 27(4), 481–503 (2007). 10.1007/s10762-006-9102-y [DOI] [Google Scholar]
- 5.Yu C., Crump D., “A Review of the Emission of VOCs from Polymeric Materials used in Buildings,” Build. Environ. 33(6), 357–374 (1998). 10.1016/S0360-1323(97)00055-3 [DOI] [Google Scholar]
- 6.Jones A. P., “Indoor air quality and health,” Atmos. Environ. 33(28), 4535–4564 (1999). 10.1016/S1352-2310(99)00272-1 [DOI] [Google Scholar]
- 7.Bari M. A., Kindzierski W. B., “Concentrations, sources and human health risk of inhalation exposure to air toxics in Edmonton, Canada,” Chemosphere 173, 160–171 (2017). 10.1016/j.chemosphere.2016.12.157 [DOI] [PubMed] [Google Scholar]
- 8.Bari M. A., Kindzierski W. B., “Ambient volatile organic compounds (VOCs) in communities of the Athabasca oil sands region: Sources and screening health risk assessment,” Environ. Pollut. (Oxford, U. K.) 235, 602–614 (2018). 10.1016/j.envpol.2017.12.065 [DOI] [PubMed] [Google Scholar]
- 9.Gozzi F., Della Ventura G., Marcelli A., Lucci F., “Current Status of Particulate Matter Pollution in Europe and Future Perspectives: a Review,” J. Mater. Environ. Sci. 8, 1901–1909 (2017). [Google Scholar]
- 10.Baxter J. B., Guglietta G. W., “Terahertz Spectroscopy,” Anal. Chem. 83(12), 4342–4368 (2011). 10.1021/ac200907z [DOI] [PubMed] [Google Scholar]
- 11.Ferguson B., Zhang X.-C., “Materials for terahertz science and technology,” Nat. Mater. 1(1), 26–33 (2002). 10.1038/nmat708 [DOI] [PubMed] [Google Scholar]
- 12.El Haddad J., Bousquet B., Canioni L., Mounaix P., “Review in terahertz spectral analysis,” Trends Anal. Chem. 44, 98–105 (2013). 10.1016/j.trac.2012.11.009 [DOI] [Google Scholar]
- 13.Smith R. M., Arnold M., “Terahertz time-domain spectroscopy of solid samples: principles, applications, and challenges,” Appl. Spectrosc. Rev. 46(8), 636–679 (2011). 10.1080/05704928.2011.614305 [DOI] [Google Scholar]
- 14.Castro-Camus E., Alfaro M., “Photoconductive devices for terahertz pulsed spectroscopy: a review,” Photonics Res. 4(3), A36 (2016). 10.1364/PRJ.4.000A36 [DOI] [Google Scholar]
- 15.Bowling Barnes R., Benedict W. S., Lewis C. M., “The Far Infrared Absorption of Benzene,” Phys. Rev. 47(2), 129–130 (1935). 10.1103/PhysRev.47.129 [DOI] [Google Scholar]
- 16.Mrozek R. C. F., Sherman W. F., Wilkinson G. R., “Far infrared spectra of liquid and solid benzene,” Microchim. Acta 95(1-6), 349–352 (1988). 10.1007/BF01349785 [DOI] [Google Scholar]
- 17.Wyss H. R., Werder R. D., Günthard Hs. H., “Far infrared spectra of twelve organic liquids,” Spectrochim. Acta 20(4), 573–579 (1964). 10.1016/0371-1951(64)80054-0 [DOI] [Google Scholar]
- 18.Ikeda T., Matsushita A., Tatsuno M., Minami Y., Yamaguchi M., Yamamaoto K., Tani M., Hangyo M., “Investigation of inflammable liquids by terahertz spectroscopy,” Appl. Phys. Lett. 87(3), 034105 (2005). 10.1063/1.1999847 [DOI] [Google Scholar]
- 19.Plusquellic D. F., Siegrist K., Heilweil E. J., Esenturk O., “Applications of Terahertz Spectroscopy in Biosystems,” ChemPhysChem 8, 2412–2431 (2007). 10.1002/cphc.200700332 [DOI] [PubMed] [Google Scholar]
- 20.Xie L., Yao Y., Ying Y., “The Application of Terahertz Spectroscopy to Protein Detection: A Review,” Appl. Spectrosc. Rev. 49(6), 448–461 (2014). 10.1080/05704928.2013.847845 [DOI] [Google Scholar]
- 21.Qin J., Ying Y., Xie L., “The Detection of Agricultural Products and Food Using Terahertz Spectroscopy: A Review,” Appl. Spectrosc. Rev. 48(6), 439–457 (2013). 10.1080/05704928.2012.745418 [DOI] [Google Scholar]
- 22.Lupi S., “Terahertz Spectroscopy of Novel Superconductors,” Adv. Condens. Matter Phys. 2011, 1–9 (2011). 10.1155/2011/816906 [DOI] [Google Scholar]
- 23.Ferguson B., Zhang X. C., “Materials for terahertz science and technology,” Nat. Mater. 1(1), 26–33 (2002). 10.1038/nmat708 [DOI] [PubMed] [Google Scholar]
- 24.Zhang X. C., Xu J., Introduction to THz Wave Photonics (Springer, 2010). [Google Scholar]
- 25.Nielsen O. F., “Chapter 3. Low-frequency spectroscopic studies and intermolecular vibrational energy transfer in liquids,” Annu. Rep. Prog. Chem., Sect. C: Phys. Chem. 93, 57 (1996). 10.1039/pc9969300057 [DOI] [Google Scholar]
- 26.Rønne C., Jensby K., Loughnane B. J., Fourkas J., Nielsen O. F., Keiding S. R., “Temperature dependence of the dielectric function of C6H6(l) and C6H5CH3(l) measured with THz spectroscopy,” J. Chem. Phys. 113(9), 3749–3756 (2000). 10.1063/1.1287737 [DOI] [Google Scholar]
- 27.Zheng Z. P., Fan W. H., Yan H., “Terahertz absorption spectra of benzene-1,2-diol, benzene-1,3-diol and benzene-1,4-diol,” Chem. Phys. Lett. 525-526, 140–143 (2012). 10.1016/j.cplett.2011.12.062 [DOI] [Google Scholar]
- 28.Naftaly M., Dudley R. A., “Methodologies for determining the dynamic ranges and signal-to-noise ratios of terahertz time-domain spectrometers,” Opt. Lett. 34(8), 1213–1215 (2009). 10.1364/OL.34.001213 [DOI] [PubMed] [Google Scholar]
- 29.Liu Y., Daum P. H., “Relationship of refractive index to mass density and self-consistency of mixing rules for multicomponent mixtures like ambient aerosols,” J. Aerosol Sci. 39(11), 974–986 (2008). 10.1016/j.jaerosci.2008.06.006 [DOI] [Google Scholar]
- 30.Reis J. C. R., Lampreia I. M. S., Santos A. F. S., Moita M. L. C. J., Douhéret G., “Refractive index of liquid mixture: Theory and Experiment,” ChemPhysChem 11(17), 3722–3733 (2010). 10.1002/cphc.201000566 [DOI] [PubMed] [Google Scholar]
- 31.Jin Y.-S., Kim G.-J., Shon C.-H., Jeon S.-G., Kim J.-I., “Analysis of Petroleum Products and Their Mixtures by Using Terahertz Time Domain Spectroscopy,” J. Korean Phys. Soc. 53(4), 1879–1885 (2008). 10.3938/jkps.53.1879 [DOI] [Google Scholar]
- 32.Buep A. H., Baron M., “Dielectric Properties of Binary Systems.7. Carbon Tetrachloride with Benzene, with Toluene, and with p-Xylene at 298.15 and 308.15 K,” J. Phys. Chem. 92(3), 840–843 (1988). 10.1021/j100314a049 [DOI] [Google Scholar]
- 33.D’Apuzzo F., Candeloro P., Domenici F., Autore M., Di Pietro P., Perucchi A., Roy P., Sennato S., Bordi F., Di Fabrizio E. M., Lupi S., “Resonating terahertz response of periodic arrays of subwavelength apertures,” Plasmonics 10(1), 45–50 (2015). 10.1007/s11468-014-9775-3 [DOI] [Google Scholar]


