Abstract
Objective:
The expression of human leukocyte antigen (HLA)-ABC and HLA-DR is linked to the development of breast cancer. This study was aimed to determine the effect of bacillus bacterial extracts on the expression of the major histocompatibility complexes (MHC) Class I and Class II receptors on breast cancer cells.
Methods:
The expression of HLA-ABC and HLA-DR was assessed by flow cytometry and confocal microscope on the human breast tumor cell lines MDA-MB-231, which used a readily accessible model system. It is postulated that the HLA-ABC and HLA-DR receptors might be regulated by bacillus bacterial extracts designated (RA10, RA4, RA7, and RA16).
Results:
It was observed that the treatment of cell line MDA-MB-231 with the RA10 resulted in an upregulation of the cell surface expression of the HLA-A, B, C receptors. It was observed that RA10 has the capacity to reduce the expression of HLA-A, B, C, it also shows a detectable degree of cytotoxicity when used at high concentrations. The data show that the cell surface expression of HLA-ABC is higher than HLA-DR. No significant changes of HLA-DR expression were observed on MDA-MB-231 cell lines.
Conclusions:
Improved understanding of the connection between HLA-ABC, HLA-DR, and bacterial extracts such as RA10 may lead to the development of drug design and therapies related to breast cancer condition in which these receptors are involved.
Keywords: Bacillus bacterial extracts, breast cancer cells, major histocompatibility complexes Class I receptor, major histocompatibility complexes Class II receptor
Introduction
Breast cancer is the most common malignant tumor in the world and has a high mortality rate.[1] The migration of metastatic breast cells to nearby or distant organs can be done through the bloodstream. Since these cells originated in the breast, this is categorized under metastatic breast cancer.[2] The major histocompatibility complexes (MHC) exhibit extreme levels of gene density and polymorphism. This genetic diversity is intricate in its nature, function, and coinheritance; and this complex genomic region has been revealed as the epitome for human genomics.[3] The MHC antigens are alloantigens and on chromosome 6p21.3, the situated human MHC is typically divided into regions designated as Class I and Class II. These MHC classes initiate an immune response against a specific antigen.[4] The genes of human leukocyte antigen (HLA) Classes I and II encode for glycoprotein molecules that present antigenic peptides to their respective cells, CD8+ and CD4+ T cells which are expressed on cell surfaces.[4] These classes exhibit remarkable genetic polymorphism, ensuring the specificity and diversity of documented antigens and enabling immune reactivity against virulent pathogens. There is an inevitable interaction of HLA molecules with antigenic epitopes; a notion conferred by Bjorkman, who explained in detail the structure of HLA proteins such as HLA-A2, and the Class II molecules.[5] The role of these HLA molecules is not restricted to their functionality in antigen presentation to lymphocytes; they are also accountable for various immune and non-immune processes, such as olfaction.[6] The influence of MHC on bacterial composition has also been reported in different disease system.[7] The objective of this study is to assess the toxicity of the following microbial compounds: RA4, RA7, RA10, and RA16 on breast cancer cells. Based on dose- and time-dependent actions of microbial compounds, the most effective once was chosen for the detection of the morphology of cells, including the expression of MHC Classes I and II. Breast cells MDA-MB-231 are the cells of choice under this experiment. Some of the basic techniques used include tissue culture, flow cytometry, confocal microscopy, and BX41 microscopy. Tissue culture is performed to grow pure cells before further processing; cytometry indicates the expression of genes; and microscopy is used to examine the morphological changes in cells and the expression of the receptors of interest.
Methods
Cell lines, cultures, and treatment with bacillus bacterial extracts
Three cell lines were utilized in this study. MDA-MB-231 cells are epithelial cells derived from breast cancer. THP-1 cells are human monocyte cells, derived from patients with acute lymphocytic leukemia. Raji cell lines, from patients with Negroid Burkitt’s lymphoma, were utilized as a control in the quantification experiments. MDA-MB-231 was cultured with or without bacillus bacterial extracts in Dulbecco’s modified Eagle’s medium (DMEM), while THP-1 cells were cultured in RPMI 1640. Four different bacterial strains were used Citrobacter freundii (RA4), Proteus vulgaris (RA7), Pseudomonas aeruginosa (RA10), and Serratia marcescens (RA16). All cells were cultured using the DMEM medium with 5% CO2, as described previously.[8-10]
Cell viability and toxicity using 3-(4, 5-dimethylthiazolyl-2)-2, 5-diphenyltetrazolium bromide (MTT) assay
Cell viability and toxicity was assessed by means of an MTT assay. A 96 well plate was prepared and cultured with 5000 cells in each well with 100 µl of DMEM media. The plate was incubated for 24 h at 37°C in 5% CO2. Four different concentrations (500 µg, 1000 µg, 1500 µg, and 2000 µg) were prepared in DMEM media for each of the compounds RA4, RA7, RA10, and RA16. The media were sucked from the wells carefully, and 100 µl of the media containing compounds were added in triplicates for each concentration. The plate was then incubated at 37°C in 5% CO2 for another 24 h. Next, the media were discarded, and 100 µl of MTT solution was added, followed by incubation for 2 h. Carefully, the MTT solution was discarded and 100 µl DMSO was added. The plate was gently shaken and read in a spectrophotometer at a wavelength of 490 nm. The toxicity results obtained were recorded and expressed as a percentage of cell viability against the control cells tested under the same conditions, but in media without any compounds. Based on the obtained results, the experiment was repeated under the same conditions but with five new compound concentrations (25 µg, 50 µg, 100 µg, 150 µg, and 200 µg).[11,12]
Flow cytometry
Flow cytometry was used to analyze and quantitate the cell surface of antigens as after growing cultured cells or treated samples (1 × 10⁶ cells/sample), the cells were washed in phosphate-buffered saline (PBS). The cells were fixed with a fixation buffer 4% (paraformaldehyde [PFA]) for 20 min in ice to ensure free access of the antibody to its antigen. This was followed by washing in PBS. The cells were then blocked with blocking buffer (0.1% bovine serum albumin [BSA] in PBS) to block non-specific antibody binding sites and again washed in PBS. Cells were used with either only secondary antibody or neither primary nor secondary antibody as negative controls. The remaining samples, primary antibody diluted in PBS (5 µl:100 µl) for HLA- A, B, C (W6/32 clone), and diluted in PBS (1 µl:100 µl) for HLA-DR (L243 clone), were added to the appropriate samples, followed by incubation for 1 h at room temperature and washing with PBS. Next, the secondary antibody conjugated with fluorescence isothiocyanate (FITC) was applied to each sample, except the samples that contain cells only were used as blank. All samples were incubated at room temperature for 45 min followed by washing with PBS 3 times. In total, 10,000 cells for each sample were analyzed using BD FACS Aria flow cytometry. The histograms obtained displayed the total number of events (counted cells) on the Y-axis as a function of mean fluorescence intensity (on the X-axis). Fluorescence intensity was expressed as a statistical figure of geometric mean, which represented the average fluorescence intensity for each event.[13]
BX41 microscopy
BX41 microscopy was used in this study to detect the changes in the morphology of cells that had been treated with microbial compounds. The cells were cultured in a six-well plate covered with a cover slip, followed by incubation for 48 h at 37°C in 5% CO2 atmosphere to allow the cells to attach to the cover slip. The cells were treated with microbial extract RA10 and incubated again for 24 h. The media were then removed gently, and the wells were washed twice with 2 ml PBS. The cells were fixed with 4.8% formalin for 5 min at room temperature, followed by washing twice with 2 ml PBS. Then, the cells were permeabilized with 100% methanol for 20 min, followed by washing twice with 2 ml PBS. The cells were stained with 2 ml Giemsa stain from Sigma-Aldrich for 15 min and then washed twice with 2 ml PBS. The slides were mounted with anti-fade mounting medium (vector shield) and covered with a cover slip. The edges of the cover slip were sealed with fixogum. The slides were then examined under a BX41 microscope.
Confocal microscopy
The confocal microscopy on the studied cells was performed using the confocal microscope, as described previously.[13] MDA-MB-231 cell lines were cultured in Lab-Tek eight-well Chambers at a density of 8 × 10³ cells for each well, for 2 days following seeding. The cells were fixed with 4% PFA for 20 min on ice. Cells were blocked with 2% (w/v) BSA prepared in 1x PBS for 1 h at room temperature. For single staining of each antigen, cells were incubated with (anti-HLA-A, B, C) and 156-3C11 (anti-HLA-DR) specific monoclonal antibodies. A secondary antibody, anti-mouse IgG conjugated with Alexa Fluor 488 or Alexa Fluor 555, was used at a dilution of 0.25µg/100µl for 1 h. For double staining, cells were blocked again with 2% BSA, and the staining process was repeated for every desired pair. Counterstain DAPI was used at a 1:250 dilution. Cells were then carefully washed, and the chambers were taken out of the slide, mounted with an anti-fade mounting medium (Vector shield) and covered with a cover slip. The sides of the cover slip were sealed with Fixogum. The slides were then examined under a Nikon Confocal Microscope, with a ×60 objective and FITC filter for Alexa 488 and PE filter for Alexa 555. The images were enhanced and amazed using image J software.
Results
Determination of the growth curve rate of MDA-MB-231 cell lines
Figure 1 shows the growth curve for MDA-MB-231 cells. Cell numbers were counted at 24 h intervals up to 168 h post-seeding. Figure 1 shows that the number of cells started to increase slightly within the first 24 h after introducing the cells to the new medium. After 24 h, the cells started to grow steadily, and then grew exponentially for 96 h. The maximum density of MDA-MB-231 cells was 50,000 cells/ml. At 144 h, the number of cells decreased, and the cells entered the death program at 168 h unless a fresh medium was added. This procedure was followed for all MDA-MB-231 cell lines.
Figure 1.
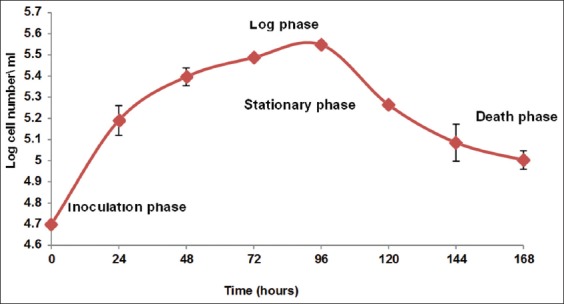
Growth curve of MDA-MB-231 cell line. Cells were seeded at a density of 5 × 10³ cell\ml in a 35 mm Petri dish in Dulbecco’s modified Eagle’s medium high glucose supplemented with 10% fetal calf serum and incubated at 37°C with 5% CO2. These data represent the averages of three different experiments
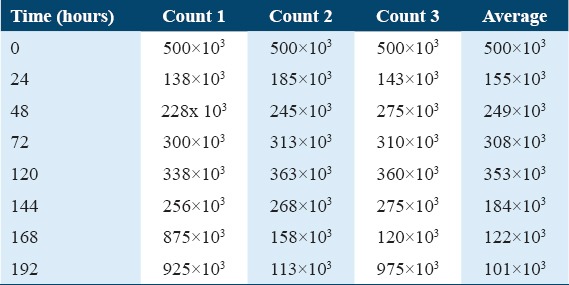
As shown in Table 1, the numbers of cells in the three dishes were read every day using a hemocytometer, and the mean number of cells in the squares was obtained. The same number multiplied by the amount of media in the dish gave the total number of cells. This procedure was followed for all MDA-MB-231 cell lines.
Table 1.
Cell growth counts with time
Determination of the toxicity of the RA4, RA7, RA10, and RA16 extracts on MDA-MB-231 cell viability
To study the effect of RA4, RA7, RA10, and RA16 on MDA-MB-231 cell viability, cells were treated with different concentrations of these extracts. The toxic effect of different extract concentrations (500 µg, 1000 µg, 1500 µg, and 2000 µg) on the MDA-MB-231 cells was determined, and the data are shown in Figure 2. No great difference in cell viability was observed between cells treated with RA4 (blue line), RA7 (red line), or RA16 (purple line), with concentrations of 500 µg, 1000 µg, 1500 µg, and 2000 µg. This result indicates that for MDA-MB-231 cells, these concentrations of these extracts are not toxic. However, RA10 was extremely toxic for MDA-MB-231 cells at all concentrations (500 µg, 1000 µg, 1500 µg, and 2000 µg).
Figure 2.
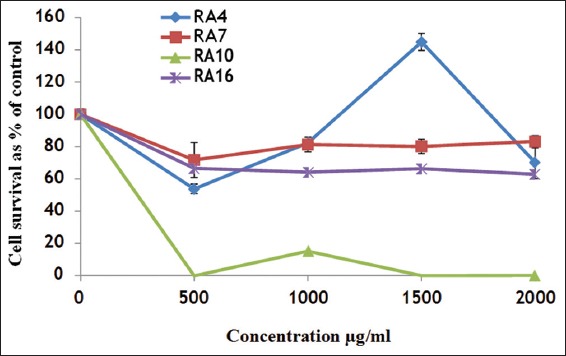
The effect of RA4, RA7, RA10, and RA16 on MDA-MB-231 cell viability. Cells were treated with RA4, RA7, RA10, and RA16 for 24 h, then treated with 3-(4, 5- dimethylthiazolyl-2)-2, 5-diphenyltetrazolium bromide
The cytotoxicity of RA4, RA7, RA10, and RA16 on MDA-MDA-231 cells
This experiment was conducted to detect the toxic effect of RA4, RA7, RA10, and RA16 on the cell viability of MDA-MB-231. MDA-MB-231 cells were cultured in the presence of RA4, RA7, RA10, and RA16, each at concentrations of 25, 50, 100, 150, and 200 µg/ml for 24 h. Data were collected by flow cytometry. As shown in Figure 3, no significant toxicity was detected for any concentration of RA4, RA7, RA10, or RA16 on MDA-MB-231 cells. This result indicates that low concentrations up to 200 µg/ml of RA10, RA7, RA4, and RA16 are not toxic on MDA-MB-231 cells.
Figure 3.
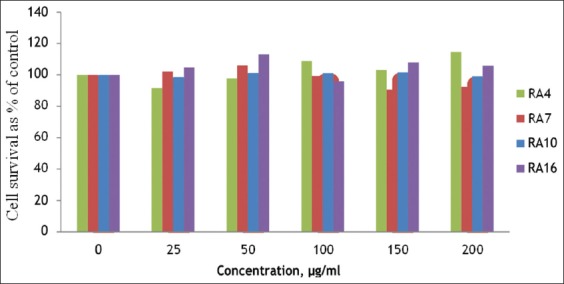
The cytotoxicity effect of RA4, RA7, RA10, and RA16-treated MDA-MB-231 cells. MDA-MB-231 cells were cultured in the presence of RA4, RA7, RA10, and RA16 for 24 h, as indicated by 3-(4, 5- dimethylthiazolyl-2)-2, 5-diphenyltetrazolium bromide assay
The effect of RA10 treatment on the expression of HLA-A, B, C and HLA-DR receptors in MDA-MB-231 cell lines
This experiment was carried out to detect the cell surface expression of HLA-A, B, C, and HLA-DR on treatment with the microbial extract RA10 in MDA-MB-231 cells. MDA-MB-231 cells were cultured in the presence of the indicated concentrations of RA10 (25, 50, 100, 150, and 200 µg/ml) for 24 h, and data were acquired by flow cytometry using W6/32 (anti-HLA-A, B, C) and L243 (anti-HLA-DR). Figure 4 shows that RA10 treatment of MDA- MB-231 cells at the indicated concentrations resulted in a rapid increase of expression of HLA-A, B, C in comparison to both HLA-DR and the control cells. This increase reached a peak level after treating with RA10 50 µg/ml. However, at this concentration, cell expression of HLA-DR was lower in comparison to HLA-A, B, C. Consequently, no significant differences in HLA-DR-treated cells with variable concentrations of RA10 were detected when compared to untreated cells or an isotype. This result indicates that RA10 has no regulation effect on cell expression of HLA-DR in MDA-MB-231 cells. However, treatment with different concentrations of RA10 extract did result in higher expression of cells with HLA-A, B, C. The receptor’s expression of HLA-A, B, C was 2–3-fold higher than for untreated cells, with RA10 concentrations of 25 and 50 µg/ml, respectively. It was observed that higher concentrations (100–200 µg/ml) of RA10 stimulated HLA-A, B, C expression at lower levels than the former ones. In contrast, at the same concentrations of RA10, cells showed the insignificant changes in the expression of HLA-DR after treatment. Thus, RA10 induces cell surface expression of HLA-A, B, C, but has no effect on HLA-RD expression.
Figure 4.
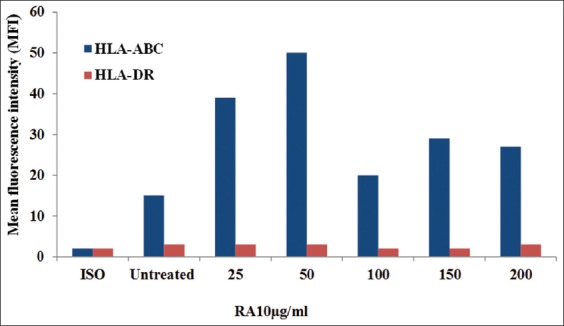
Cell surface expression of human leukocyte antigen (HLA)-A, B, C and HLA-DR on RA10-treated MDA-MB-231 cells. MDA-MB-231 cells were cultured in the presence of RA10 for 24 h. Data were acquired by flow cytometry using W6/32 (anti-HLA-A, B, C) and L243 (anti-HLA-DR)
The expression of HLA-A, B, C and HLA-DR in MDA-MB-231 cells on interferon (IFN)-treatment
This experiment was conducted to detect the cell surface expression of HLA-A, B, C and HLA-DR after IFN- treatment in MDA-MB-231 cells. MDA-MB-231 cells were cultured in the presence of the indicated concentrations of IFN-(100, 500, and 1000 IU/ml) for 24 h, and data were acquired by flow cytometry using W6/32 (anti-HLA-A, B, C) and L243 (anti-HLA-DR). As shown in Figure 5, IFN-treatment of MDA-MB-231 cells resulted in a gradual increase of expression of HLA-A, B, C and HLA-DR in comparison to the control cells. This increase of HLA-A, B, C expression reached a peak level after treatment with 1000 IU/ml IFN. However, the expression of HLA-DR showed less expression in comparison with HLA-A, B, C. Conversely, a positive correlation was found between the expression of HLA-A, B, C in MDA-MB-231 cells and IFN-concentrations, reaching a peak at 1000 IU/ml. A much lower expression of HLA-DR was observed at the same concentration of IFN-γ.
Figure 5.
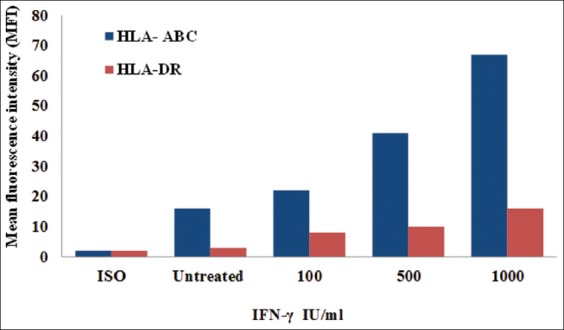
Cell surface expression of human leukocyte antigen (HLA)-A, B, C and HLA-DR on interferon-γ (IFN-γ) -treated MDA-MB-231 cells. MDA-MB-231 cells were cultured in the presence of IFN-for 72 h. Data were acquired by flow cytometry using W6/32 (anti-HLA-A, B, C) and L243 (anti-HLA-DR)
The effect of RA4, RA7, and RA16 on Class I MDA-MB-231 cell expression
This experiment was carried out to detect the expression effect of the microbial extracts RA4, RA7, and RA16 on MHC Class I in MDA-MB-231 cells. MDA-MB-231 cells were cultured in the presence of RA4, RA7, and RA16 at concentrations of 25, 50, 100, 150, and 200 µg/ml for 24 h. Data were acquired by flow cytometry. Figure 6 shows that expression increased with 200 µg/ml RA4 and reached a peak after treating with 200µg/ml, as compared with cells treated with RA7 or RA16. However, the cells treated with different concentrations of RA7 and 25, 50, 100, and 150 µg/ml of RA4 showed only a small increase compared with untreated cells. Moreover, the different concentrations of RA16 showed less expression in comparison with the untreated cells and isotype. This result suggests that only RA4 at 200µg/ml increases the expression of Class I MDA-MB-231 cells.
Figure 6.
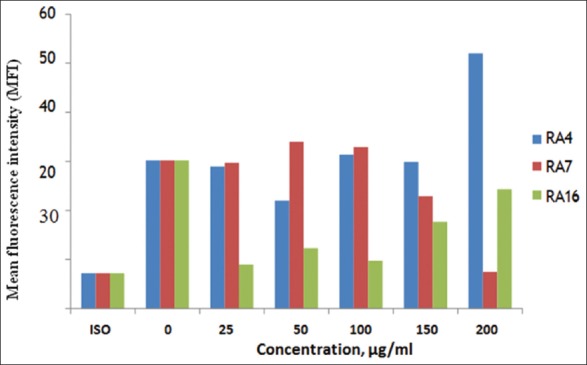
The effect of RA4, RA7, and RA16 on MHC Class I MDA-MB-231 cells. MDA-MB-231 cells were cultured in the presence of RA4, RA7, and RA16 for 24 h, and evaluated by flow cytometry
The effect of RA4, RA7, and RA16 on Class II MDA-MB-231 cell expression
An experiment to detect the effect of RA4, RA7, and RA16 on Class II MDA-MB-231 cell expression was conducted using the same protocol for detection in Class I. Figure 7 shows no significant change in the expression of cells treated with different concentrations of RA4 compared with cells treated with RA7 and untreated cells. Cells treated with RA16 had a lower expression compared with RA4, RA7, untreated cells, and isotype. Expression increased at 200µg/ml for RA4, at which concentration both RA7 and RA16 showed a much lower cell expression. Overall, this result demonstrates that RA4, RA7, and RA16 are not toxic on Class II MDA-MB-231 cells.
Figure 7.
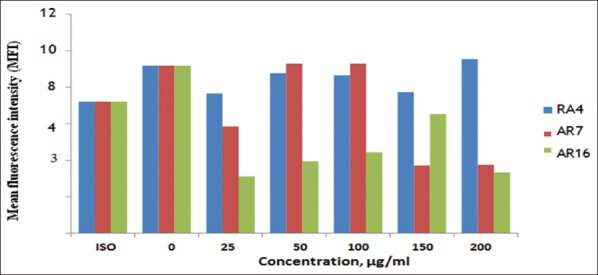
Cell expression of RA4, RA7, and RA16 treated Class II MDA-MB-231 cells. MDA-MB-231 cells were cultured in the presence of RA4, RA7, and RA16 for 24 h. Data were acquired by flow cytometry
Cell surface expression of HLA-A, B, C and HLA-DR receptors after IFN-treatment of MDA-MB-231 cells
This experiment was conducted to detect the MDA-MB-231 cell expression of HLA-A, B, C and HLA-DR with different concentrations of IFN-(100, 500, and 1000 µg/ml). In Figure 8, histogram (A) shows that the surface expression of HLA-A, B, C steadily increased. The white area in the histogram represents the THP-1 cell line surface expression in comparison with the black filled area, which represents the negative control. Comparing histograms (A) and (B), (B) shows the lower expression of HLA-DR in comparison to HLA-A, B, C. As shown in Figure 10, the expression of both receptors increased with IFN-concentration, with this trend being more pronounced for HLR-ABC than for HLR-DR.
Figure 8.
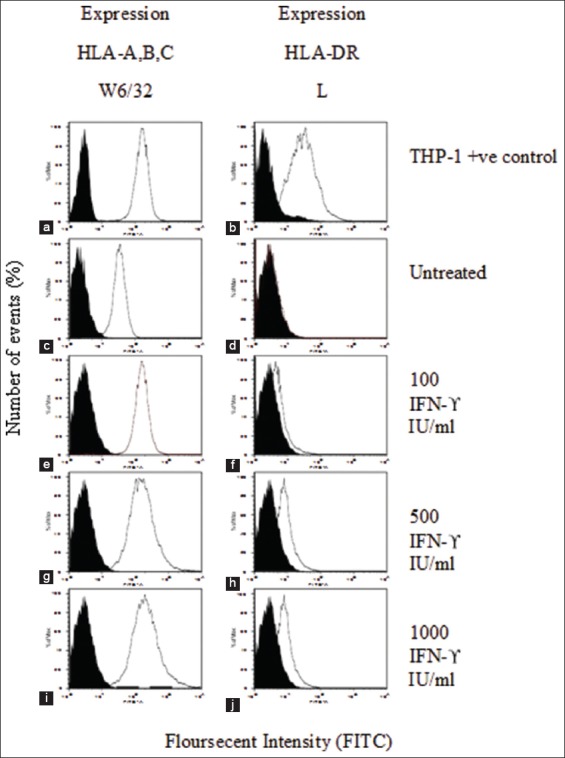
Cell surface expression of human leukocyte antigen (HLA)-A, B, C and HLA-DR on interferon (IFN)-treated MDA-MB-231 cells. Histograms (a) and (b) show the surface expression of HLA-A, B, C and HLA-DR, respectively, in THP-1 cells as a positive control. Surface expression of HLA-A, B, C and HLA-DR on untreated MDA-MB-231 cells is shown in (c) and (d-i), and (j) represent the surface expression of HLA-A, B, C and HLA-DR on IFN-treated MDA-MB-231 cells, with the concentrations indicated
Figure 10.
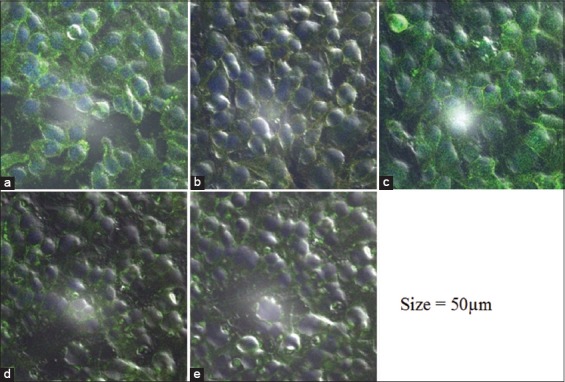
The effect of different concentrations of RA10 on human leukocyte antigen (HLA)-A, B, C and HLA-RD expression of MDA-MB-231 cells. (a) 25µg RA10; (b) 50µg; (c) 100 µg; (d) 150 µg; and (e) 200 µg. Cells were washed and incubated with primary and secondary antibody-labeled fluorescence isothiocyanate. Slides were examined under confocal microscope
Detection of HLA-A, B, C and HLA-DR receptors on MDA-MB-231 cells using confocal microscopy
In Figure 9a-c, respectively, represent the isotype, the MDA-MB-231 cell HLA-A, B, C control and the MDA-MB-231 cell HLA-DR control. All were treated only with primary and secondary antibody and show low levels of fluorescence in images A, B, and C. The primary antibody for HLA-A, B, C is conjugated with Alexa Fluor 488 (green), while the primary antibody for HLA-DR is conjugated with Alexa Fluor 555 (red).
Figure 9.
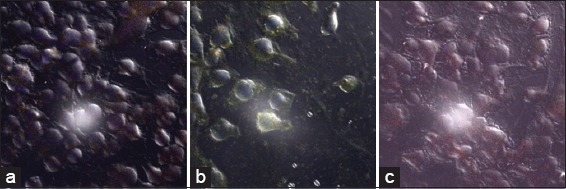
Images of MDA-MB-231 cells with major histocompatibility complexes (MHC) Class I and MHC Class II receptors. Cells were washed and incubated with primary and secondary antibody-labeled fluorescence isothiocyanate. Slides were examined under confocal microscope (a) Isotype (b) MDA-MB-231/human leukocyte antigen (HLA)-A, B, C (c) MDA-MB-231/HLA-RD
MDA-MB-231 cells treated with different concentrations of RA10
This experiment was carried out to detect the MDA-MB-231 cell expression of HLA-A, B, C, and HLA-DR receptors with different concentrations of RA10. The microscopic images D and E in Figure 10, respectively, represent MDA-MB-231 cells treated with 25 and 50 µg/ml of RA10 and incubated with primary and secondary antibody. The images show an enhanced fluorescence of Alexa Fluor 488 (green) on the surface of the cells, which refers to HLA-A, B, C primary antibody. Increasing the concentration of RA10 to 100, 150, and 200 µg had a negative effect on the receptors’ expression of HLR-ABC, as indicated by the fluorescence reductions in images F–H. This could be attributed to the changes in the cellular morphology of MDA-MB-231 and the damage to the cellular organelles, which was more pronounced in images G and H. Fluorescence intensity was counted as average for each section.
Microscopic study of the bacterial extract’s effect on MDA-MB-231 cell morphology
This experiment was carried out to determine the effect of different concentrations of RA10 on MDA-MB 231 cell morphology. Slides were examined for each sample under a BX41 microscope. In Figure 11, image (A) shows untreated MDA-MB-231 cells with healthy morphology. Images (B) and (C) show MDA-MB-231 cells treated with 25 µg and 50 µg of RA10, respectively, the cells still look healthy, with no change in morphology. Image (D) shows MDA-MB-231 cells treated with 100 µg RA10; cells have begun to show some damage to the cell membrane and aggregation of cellular compartments (inside the red circles). Image (E) shows MDA-MB-231 cells treated with 150 µg of RA10. Clear damage of cellular organelles can be observed (inside the red circles). Image (F) shows MDA-MB-231 cells treated with 200 µg RA10. At this level, there is obvious degradation (white spots increased) of the cells (inside the red circles).
Figure 11.
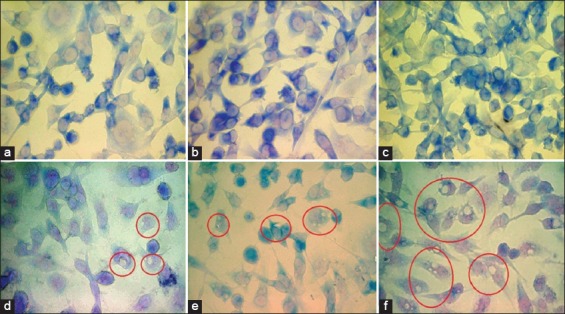
The effect of different concentrations of RA10 on MDA-MB-231 cell morphology. (a) Untreated cells as control; (b) Cells treated with 25 µg RA10; (c) 50 µg; (d) 100 µg; (e) 150 µg; and (f) 200 µg
Discussion
This study has attempted to assess the toxicity of the following microbial compounds: RA4, RA7, RA10, and RA16 in breast cancer cells. The MHC Class I glycoproteins are categorized into three major classes (A, B, and C), among which Classes A and B show widespread polymorphism.[14,15] Furthermore, HLA I, E, F, and G have been added to the category of MHC Class I genes. The Class I molecules comprise heavy chain molecules (α chain of 44 to 74 kDa) non-covalently bound to a non-MHC region, known as β2-microglobulin (β2m) of 12 kDa subunits.[14,15] In contrast, MHC Class II is glycoproteins encoded by a highly polymorphic gene. This is composed of two transmembrane polypeptides: N-terminal in the lumen and C-terminal in the cytosol, forming heterodimers are non-covalently linked.[16] To study the effect of RA4, RA7, RA10, and RA16 on MDA-MB-231 cell viability, cells were treated with different concentrations of these compounds. First, the toxic effect of different high concentrations (500 µg, 1000 µg, 1500 µg, and 2000 µg) on MDA-MB-231 cells was determined. No great difference in cell viability was found for RA4, RA7, or RA16 at any concentration. Thus, at concentrations of 500 µg, 1000 µg, 1500 µg, and 2000 µg, these compounds were not toxic. However, RA10 was found to be extremely toxic at concentrations of 500 µg, 1000 µg, 1500 µg, and 2000 µg. The effect of RA4, RA7, RA10, and RA16 increased with concentration until viability reached 20% and 10% after addition. Thus, 500 µg and 1000 µg had a great toxic effect on MDA-MB-231 cell viability. Subsequently, these concentrations can be used without affecting the growth rate and viability of the MDA-MB-231 cells. The cell surface expression of HLA-A, B, C and HLA-DR on RA10-treated MDA-MB-231 cells was investigated. MDA-MB-231 cells were cultured in the presence of different concentrations of RA10 (25, 50, 100, 150, and 200 µg/ml) for 24 h, and data were acquired by flow cytometry using W6/32 (anti-HLA-A, B, C) and L243 (anti-HLA-DR). RA10 treatment of MDA-MB-231 cells at 100, 150, and 200 µg/ml resulted in a rapid increase of expression of HLA-A, B, C in comparison to HLA-DR and control cells. This increase reached a peak level after treatment with RA10 50 µg/ml. However, cell surface expression of HLA-DR showed less expression in comparison with HLA-A, B, C. Thus, there was no significant difference in HLA-DR treated cells in comparison to untreated cells and isotype. This indicates that the cell surface expression of HLA-A, B, C and HLA-DR in MDA-MB-231 cells when challenged with RA10 resulted in lower RA10 concentrations with HLA-A, B, C. The flow cytometry results obtained show a different surface expression level for each MHC Class I subtype. For example, the cell line MDA-MB expresses a high level of HLA-A, B, C. MDA-MB-231 cells were cultured in the presence of IFN-γ, at the concentrations of 100, 500, and 1000 IU/ml, for 24 h, and data were acquired by flow cytometry using W6/32 (anti-HLA-A, B, C) and L243 (anti-HLA-DR). IFN-γ treatment of MDA-MB-231 cells resulted in a gradual increase of expression of HLA-A, B, C and HLA-DR in comparison to control cells. This increase of HLA-A, B, C expression reached a peak after treatment with 1000 IU/ml IFN-γ. However, the expression of HLA-DR was lower than for HLA-A, B, C. Conversely, there was a positive correlation between the expression of HLA-A, B, C in MDA-MB-231 cells and IFN-concentration, reaching a peak at 1000 IU/ml. At the same IFN-γ concentration, there was a much lower expression of HLA-DR. This difference in surface expression between HLA-A, B, C and HLA-DR directed IFN-γ. These results show a high level of expression of HLA-A, B, C, with a higher level shown with IFN-γ. However, these results reflect a low to moderate expression for HLA-A, B, C and HLA-D. These results are consistent with the previous studies, mentioning the HLA Class II antigen presentation in cancer cells.[17] The data obtained in this study from flow cytometry show that the MDA-MB-231 cell line expresses low levels of HL-DR on the cell surface and that intracellular expression shows a very weak expression of HLA-DR. This is supported by the previous studies on the breast cancer cell lines explaining the T cell-based immunotherapy.[18] MDA-MB-231 cells were cultured in the presence of RA10 at concentrations of 25, 50, 100, 150, and 200 µg/ml for 24 h. Data were acquired by flow cytometry. RA10 treatment of MDA-MB-231 cells at all concentrations resulted in a rapid increase of expression of HLA-A, B, C in comparison to HLA-DR and control cells. This increase reached a peak after treatment with RA10 50µg/ml. However, the cell expression of HLA-DR showed less expression in comparison with HLA-A, B, C. Consequently, there was no significant difference in HLA-DR treated cells with variable concentrations of RA10 in comparison to untreated cells or isotype. This result indicates that RA10 has no regulation effect on the expression of HLA-DR in MDA-MB-231 cells. However, treatment with different concentrations of RA10 extract did result in higher expression of HLA-A, B, C. The receptor’s expression of HLA-A, B, C was around 2–3-fold higher than for untreated cells, at RA10 concentrations of 25 and 50 µg/ml, respectively. It was also observed that higher concentrations (100–200 µg/ml) of RA10 stimulated HLA-A, B, C expression in lower levels than the former ones, probably due to RA10’s effects on the morphology of the cell. In contrast, cells showed insignificant changes in the expression of HLA-DR after treatment with the same concentrations of RA10. Thus, RA10 induces cell surface expression of HLA-A, B, C, but has no effect on HLA-RD expression. To detect the expression effect of the microbial extracts RA4, RA7, and RA16 on Class I MDA-MB-231 cells, these cells were cultured in the presence of the extracts at concentrations of 25, 50, 100, 150, and 200 µg/ml for 24 h. Data were acquired by flow cytometry. The results showed that expression increased with 200 µg/ml RA4. This increase of expression reached a peak after treatment with 200 µg/ml, compared to cells treated with RA7 or RA16. Cells treated with different concentrations of RA7 and with 25, 50, 100, and 150 µg/ml of RA4 showed only a small increase compared with untreated cells. Moreover, the different concentrations of RA16 showed less expression in comparison with untreated cells and isotype. This result suggests that RA4 at 200 µg/ml can increase the expression of Class I MDA-MB-231 cells. The same protocol for detection in MHC Class I was used for MHC Class II. The data showed no significant change in the expression of cells treated with different concentrations of RA4 compared with cells treated with RA7 or untreated cells. Cells treated with RA16 had a low expression compared with RA4, RA7, untreated cells, and isotope. Expression increased at 200µg/ml for RA4, but RA16 showed less cell expression at this concentration. This result reveals that RA4, RA7, and RA16 are not toxic for Class II MDA-MB-231 cells. The ability of tumor cells to escape immune response is thought to be attributable to downregulation or loss of expression of HLA Class I molecules; whereas NK cells are capable at low levels to eliminate these abnormal antigens from the body.[19] Since high expression of these irregular HLA Class I antigens, ranging from single HLA Class I alleles or both alleles, has been observed in various kinds of tumors,[20] it remains difficult to determine the role of these antigens in tumorigenesis and the widespread expansion of cancer cells in breast cancer patients. The presence of Class II HLA s can make tumors more immunogenic and progressive due to the role of these antigens in peptide presentation to T lymphocytes. However, HLA-DR is thought to provide defense against the cytotoxicity caused by NK cells.[21] The MDA-MB-231 cell expression of HLA-A, B, C and HLA-DR receptors with different concentrations of RA10 was investigated using confocal microscope. The MDA-MB-231 cells treated with RA10 and incubated with primary and secondary antibody, as well as the 25µg and 50 µg/ml RA10 treatments, showed high Alexa Fluor 488 fluorescence (which refers to the HLA-A, B, C primary antibody). Increasing the concentrations of RA10–150 µg and 200 µg had a negative effect on the receptors’ expressions for both HLR-ABC and HLR-DR, as indicated by a reduction in fluorescence. The images also showed slight changes in the cellular morphology of the MDA-MB-231 cells at higher concentrations. The results indicated different patterns of staining, with strong surface staining, which is consistent with flow cytometry results. The pattern of extracellular fluorescence is distributed unevenly within the cells with most concentration. This experiment indicated the appropriate concentration which increases the expression of HLA-A, B, C to the peak without toxicity effect on the cells, and this concentration is 50 µg. For the microscopy study of RA10’s effect on MDA-MB 231 cell morphology, slides were examined for each sample under a BX41 microscope. The untreated MDA-MB-231 cells showed healthy morphology. MDA-MB-231 cells treated with 25 µg or 50 µg of RA10 also looked healthy, with no changes in morphology. At 100 µg RA10, MDA-MB-231 cells started to show some damage to the cell membrane and aggregation of cellular compartments. At 150 µg RA10, there was extensive damage to cellular organelles. Finally, at 200 µg RA10, degradation of the cells was obvious. Accordingly, the changes in the cells as a result of treatment with high concentration (100, 150, and 200) may explain why HLA-A, B, C expression of was decreased after treatment with the same concentrations. Various authors have explained that foreign antigens are degraded and cleaved by cytosolic and nuclear proteases so that they can be processed by MHC Class I. Translocation of degraded portions of peptides is achieved by transporter associated with antigen processing to the endoplasmic reticulum (ER) lumen. MHC Class I are highly polymorphic heterodimers formed from heavy and light chains; β2m, in the ER.
Conclusions
This study contributes to the knowledge of the function of microbial extracts on breast cancer cells. The activation of cancer cells with different bacillus bacterial extracts is recognized as a common pathway of tissue damage in conditions associated with MHC Class I and MHC Class II expressions in breast cancer cells. Moreover, the results of this study also improve the understanding of the connection between HLA-A, B, C and HLA-DR, and bacterial extracts; this may lead to the development of drug design and therapies related to the breast cancer treatment.
Conflicts of Interest
None.
References
- 1.Tray N, Taff J, Adams S. Therapeutic landscape of metaplastic breast cancer. Cancer Treat Rev. 2019;79:101888. doi: 10.1016/j.ctrv.2019.08.004. [DOI] [PubMed] [Google Scholar]
- 2.Sambi M, Qorri B, Harless W, Szewczuk MR. Therapeutic options for metastatic breast cancer. Adv Exp Med Biol. 2019;1152:131–72. doi: 10.1007/978-3-030-20301-6_8. [DOI] [PubMed] [Google Scholar]
- 3.Allcock RJ. The major histocompatibility complex:A paradigm for studies of the human genome. Methods Mol Biol. 2012;882:1–7. doi: 10.1007/978-1-61779-842-9_1. [DOI] [PubMed] [Google Scholar]
- 4.Benacerraf B. Role of MHC gene products in immune regulation. Science. 1981;212:1229–38. doi: 10.1126/science.6165083. [DOI] [PubMed] [Google Scholar]
- 5.Bjorkman PJ, Saper MA, Samraoui B, Bennett WS, Strominger JL, Wiley DC. Structure of the human class I histocompatibility antigen, HLA-A2. Nature. 1987;329:506–12. doi: 10.1038/329506a0. [DOI] [PubMed] [Google Scholar]
- 6.Vandiedonck C, Knight JC. The human major histocompatibility complex as a paradigm in genomics research. Brief Funct Genomic Proteomic. 2009;8:379–94. doi: 10.1093/bfgp/elp010. [DOI] [PMC free article] [PubMed] [Google Scholar]
- 7.Toivanen P, Vaahtovuo J, Eerola E. Influence of major histocompatibility complex on bacterial composition of fecal flora. Infect Immun. 2001;69:2372–7. doi: 10.1128/IAI.69.4.2372-2377.2001. [DOI] [PMC free article] [PubMed] [Google Scholar]
- 8.Rasheed Z, Rasheed N, Abdulmonem WA, Khan MI. MicroRNA-125b-5p regulates IL-1βinduced inflammatory genes via targeting TRAF6-mediated MAPKs and NF-κB signaling in human osteoarthritic chondrocytes. Sci Rep. 2019;9:6882. doi: 10.1038/s41598-019-42601-3. [DOI] [PMC free article] [PubMed] [Google Scholar]
- 9.Rasheed Z, Rasheed N, Al-Shaya O. Epigallocatechin-3-O-gallate modulates global microRNA expression in interleukin-1β-stimulated human osteoarthritis chondrocytes:Potential role of EGCG on negative co-regulation of microRNA-140-3p and ADAMTS5. Eur J Nutr. 2018;57:917–28. doi: 10.1007/s00394-016-1375-x. [DOI] [PubMed] [Google Scholar]
- 10.Rasheed N, Alghasham A, Rasheed Z. Lactoferrin from Camelus dromedarius inhibits nuclear transcription factor-kappa B activation, cyclooxygenase-2 expression and prostaglandin E2 production in stimulated human chondrocytes. Pharmacognosy Res. 2016;8:135–41. doi: 10.4103/0974-8490.175612. [DOI] [PMC free article] [PubMed] [Google Scholar]
- 11.Rasheed Z, Akhtar N, Khan A, Khan KA, Haqqi TM. Butrin, isobutrin, and butein from medicinal plant Butea monosperma selectively inhibit nuclear factor-kappaB in activated human mast cells:Suppression of tumor necrosis factor-alpha, interleukin (IL)-6, and IL-8. J Pharmacol Exp Ther. 2010;333:354–63. doi: 10.1124/jpet.109.165209. [DOI] [PMC free article] [PubMed] [Google Scholar]
- 12.Shukla M, Gupta K, Rasheed Z, Khan KA, Haqqi TM. Bioavailable constituents/metabolites of pomegranate (Punica granatum L) preferentially inhibit COX2 activity ex vivo and IL-1beta-induced PGE2 production in human chondrocytes in vitro. J Inflamm (Lond) 2008;5:9. doi: 10.1186/1476-9255-5-9. [DOI] [PMC free article] [PubMed] [Google Scholar]
- 13.Alabdulmonem W, Alhomaidan HT, Rasheed Z, Madar IH, Alasmael N, Alkhatib S, et al. CD74 a potential therapeutic target for breast cancer therapy:Interferon gamma up-regulates its expression in CAMA-1 and MDA-MB-231 cancer cells. Int J Cancer Res. 2018;14:58–69. [Google Scholar]
- 14.Greenbaum J, Sidney J, Chung J, Brander C, Peters B, Sette A. Functional classification of class II human leukocyte antigen (HLA) molecules reveals seven different supertypes and a surprising degree of repertoire sharing across supertypes. Immunogenetics. 2011;63:325–35. doi: 10.1007/s00251-011-0513-0. [DOI] [PMC free article] [PubMed] [Google Scholar]
- 15.Sidney J, Peters B, Frahm N, Brander C, Sette A. HLA class I supertypes:A revised and updated classification. BMC Immunol. 2008;9:1. doi: 10.1186/1471-2172-9-1. [DOI] [PMC free article] [PubMed] [Google Scholar]
- 16.Landsverk OJ, Bakke O, Gregers TF. MHC II and the endocytic pathway:Regulation by invariant chain. Scand J Immunol. 2009;70:184–93. doi: 10.1111/j.1365-3083.2009.02301.x. [DOI] [PubMed] [Google Scholar]
- 17.Doonan BP, Haque A. HLA class II antigen presentation in prostate cancer cells:A novel approach to prostate tumor immunotherapy. Open Cancer Immunol J. 2010;3:1–7. doi: 10.2174/1876401001003010001. [DOI] [PMC free article] [PubMed] [Google Scholar]
- 18.Carlsson B, Forsberg O, Bengtsson M, Tötterman TH, Essand M. Characterization of human prostate and breast cancer cell lines for experimental T cell-based immunotherapy. Prostate. 2007;67:389–95. doi: 10.1002/pros.20498. [DOI] [PubMed] [Google Scholar]
- 19.Kärre K, Ljunggren HG, Piontek G, Kiessling R. Selective rejection of H-2-deficient lymphoma variants suggests alternative immune defence strategy 1986. J Immunol. 2005;174:6566–9. [PubMed] [Google Scholar]
- 20.Garrido F, Ruiz-Cabello F, Cabrera T, Pérez-Villar JJ, López-Botet M, Duggan-Keen M, et al. Implications for immunosurveillance of altered HLA class I phenotypes in human tumours. Immunol Today. 1997;18:89–95. doi: 10.1016/s0167-5699(96)10075-x. [DOI] [PubMed] [Google Scholar]
- 21.Redondo M, García J, Villar E, Rodrigo I, Perea-Milla E, Serrano A, et al. Major histocompatibility complex status in breast carcinogenesis and relationship to apoptosis. Hum Pathol. 2003;34:1283–9. doi: 10.1016/j.humpath.2003.06.001. [DOI] [PubMed] [Google Scholar]


