Abstract
Biochar (BC) is gaining attention day by day due to its potential benefits for the improvement in degraded soil health. During its production by pyrolysis, carbon sequestration is an important aspect that makes it environment-friendly amendment. However, 100% anaerobic combustion of waste at such a high temperature decreases its adaptability to produce BC at commercial scale. On the other hand, the alkaline nature of BC also causes adverse effects on soil health when used in alkaline soils. Keeping in mind the problem of BC production and its high pH, current experiment was conducted to introduce chemical production of acidified activated carbon (AAC) and its effects on soil nutrients status comparative to high temperature pyrolyzed BC. As compared to thermal pyrolysis, sulphuric acid produce acidified activated carbon in minimum time and large in quantity. Sulphuric acid produces acidified activated carbon, fix higher carbon as compared to thermal pyrolyzed BC. Results also showed that application of 2% AAC was far better for decreasing alkaline soil pHs (3.52 and 4.71%) and ECe (45.2 and 71.4%) as compared to control in clay and sandy clay loam. A significant maximum increase in available P (117.5 and 25.9%), extractable Zn (42.0 and 52.2%), B (111.4 and 46.2%) and Fe (59.5 and 34.4%) in clay and sandy clay texture soils also validated the efficacious functioning of AAC over BC and control. It is concluded that sulphuric acid use is an easier and adaptable method to produce activated carbon at commercial scale. As compared to thermal pyrolyzed BC, application of AAC could be more effective in the improvement of soil health and fertility status.
Subject terms: Plant sciences, Environmental impact
Introduction
Role of agriculture in food production is immense1 to fulfil the hunger of human’s2. Today modern agriculture is feeding more than 6000 millions of people, compared to old age hunter-gatherer lifestyle (that provide food to 4 million people)3. Owing to modern production technologies e.g. use of inorganic fertilizers, pesticides, organic amendments, biofertilizers and genetically modified high yield varieties, the production of crops has become double in the last 40 years1,4,5. This change in food demand and supply6 has shifted the conventional agriculture towards the intensive cultivation of crops7. However, intensive cultivation of crops not only depleted the concentration of the nutrients but also has degraded the soil health. Owing to high soil pH, low organic matter and poor microbial population, now crops are suffering from hidden hunger of macro and micronutrients5,7,8. To describe such a low concentration of macro and micronutrients bioavailability, poor soil fertility is a general term which is commonly used9. Since the early years of the 21st century, the demand and application of inorganic fertilizers were increased tremendously to solve the problem of poor soil fertility10. It is documented fact that the application of inorganic fertilizers is the necessity of time to get the maximum yield of crops. However, these fertilizers are also costing a lot in terms of negative effects as well i.e., development of salinity problem11 in soil due to their enrich application12. Overuse of nitrogen and phosphorus fertilizers where increased crops productivity, they also have destroyed natural soil ecosystem13,14. Out of total applied nitrogen fertilizers, plants only consumed 50% while remaining 2–20% is lost due to its volatile nature as NH4, 15–25% chemically reacted with organic fractions and clay soil particle and 2–10% become part of water15. However, among micronutrients, the deficiency of Zn is another critical problem in alkaline calcareous soils which resulted in a significant reduction of yield16–20. An elevated level of P concentration in soil is also considered an important factor for the immobilization of Zn compared to high pH21. Enrichment of lakes with phosphorus due to its high rate of application is also causing eutrophication22. It has been observed that the deficiency of Fe also resulted in the chlorosis especially in citrus, deciduous fruits and leguminous crops23,24. The deficiency of boron has also played an imperative role in the deterioration of food quality25–27. Similarly, industries that are involved in the production of inorganic fertilizers are significantly contributing to heavy metals (Hg, As, Cd, Pb, Ni, and Cu) accumulation and contamination28. So far, many scientists have made attempts to resolve the problems of high soil pH and low organic matter by using organic amendments i.e., farmyard manure, compost and green manuring29. But their susceptibility towards decomposition is a major drawback. On the other hand, scientists also remained successful to tackle the problem of organic residues quick decomposition by introducing biochar (BC). Biochar is nutrients enrich environment-friendly organic amendment that is resistant against decomposition, decrease the emission of greenhouse gases (GHG’s) and sequester stable carbon30. Application of BC can significantly decrease the loss of nutrients by increasing soil CEC31. However, high pH of BC is again a major hurdle in the way to optimize the nutrients use efficiency, especially in high pH soils32. On the basis of BC pH, the buffering capacity of the soil is also increased towards change in soil pH33. The necessity of time is to make acidified BC. Although it is a very difficult task when produced at a commercial scale due to its high buffering ability. Keeping in mind the problems of low soil nutrients availability despite the presence of high immobile pool and high pH of biochar current experiment was conducted to introduce a chemical method for production acidified activated carbon (AAC). The aim of the current study was to introduce chemically carbon sequestration method for bulk production of AAC without using such a higher temperature. It is hypothesized that the use of the chemical method for production of AAC could be easier to adopt commercially, time-saving and less economic technique as compared to thermal pyrolysis.
Results
Soil pHs
Both main and interactive effects of various soil texture (ST) and treatments (T) were significant on the pHs of soil. No significant change was noted in soil pHs where 1% and 2% BC were applied as compared to control in clay. Addition of 1% BC was statistically alike in clay soil but 2% BC differed significantly in sandy clay loam for soil pHs as compared to control. It was observed that 1% and 2% AAC significantly decreased soil pHs over control in clay and sandy clay loam. Application of 2% AAC significantly decreased the soil pHs as compared to 1% AAC in clay soil (Fig. 1). However, 1% and 2% ACC remained statistically alike to each other in sandy clay loam soil. The maximum reduction of 3.52 and 4.71% in soil pHs was noted in 2% AAC over control in clay and sandy clay loam respectively.
Figure 1.
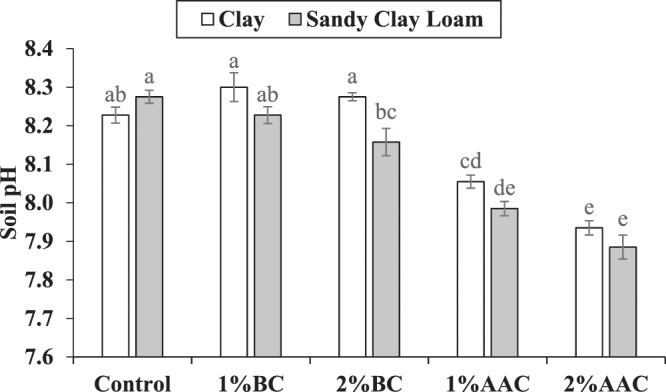
Effect of various levels of thermo pyrolyzed BC and chemically acidified activated carbon on clay and sandy clay loam textured soil pHs. Error bars represents standard error calculated through 3 replicates of each treatment.
Soil ECe
Both main and interactive effects of various soil texture (ST) and treatments (T) were significant on ECe of soil. For soil ECe, the addition of 1% and 2% BC and AAC remained statically alike to each other but differed significantly as compared to control. Application of 1% and 2% BC significantly enhanced soil ECe over control in clay soil. However, 1% and 2% AAC significantly decreased soil ECe over control in clay soil. In sandy clay loam, no significant change in ECe was observed among control and 1% BC. However, 2% BC significantly increased ECe of sandy clay loam soil as compared to control. In addition, 1% and 2% AAC also remained statistically alike to each other and with control for soil ECe (Fig. 2). The maximum increase of 45.2 and 71.4% in soil ECe was noted where 2% BC was applied as compared to control in clay and sandy clay loam respectively. However, the application of 2% AAC gave the maximum reduction of 36.7% in soil ECe over control in clay soil.
Figure 2.
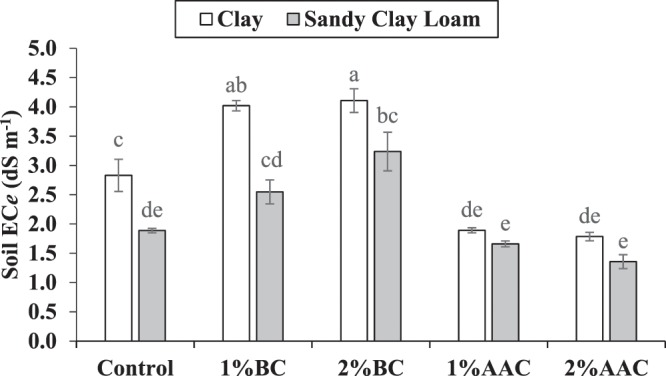
Effect of various levels of thermo pyrolyzed BC and chemically acidified activated carbon on clay and sandy clay loam textured soil ECe. Error bars represents standard error calculated through 3 replicates of each treatment.
Soil phosphorus
Both main and interactive effects of various soil texture (ST) and treatments (T) were significant on soil phosphorus (P). Application of 1% and 2% BC and AAC significantly improved the soil available P as compared to control in clay soil. For improvement in soil available P, 2% BC and AAC remained significantly better as compared to 1% BC and AAC in clay soil. No significant change in soil available P in clay soil was noted where 1% BC and 1% ACC were applied. Similarly, 2% BC and 2% AAC also remained statistically similar to each other for available soil P in clay soil. In case of sandy clay loam, 2% BC was significantly better as compared to control for available soil P. No significant change was noted among 1% BC and control for soil available P in sandy clay loam. However, 1% BC and 2% BC remained statistically alike to each other for available soil P in sandy clay loam (Fig. 3). It was observed that application of both 1% and 2% AAC performed significantly better as compared to control for available soil P. Application of 1% and 2% BC and AAC remained statistically alike to each other for available soil P in sandy clay loam. The maximum increase of 117.5 and 25.9% in soil available P was observed in clay and sandy clay loam respectively.
Figure 3.
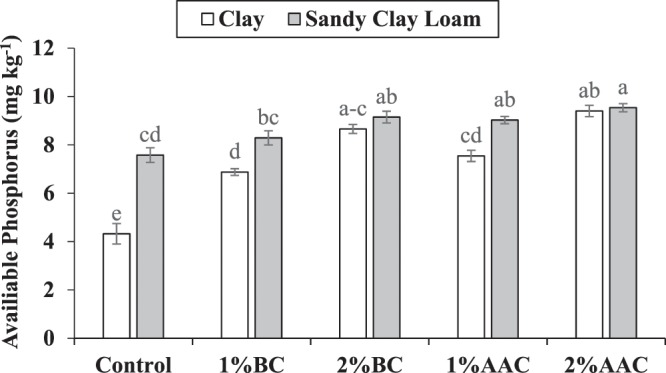
Effect of various levels of thermo pyrolyzed BC and chemically acidified activated carbon on clay and sandy clay loam textured soil available phosphorus. Error bars represents standard error calculated through 3 replicates of each treatment.
Soil potassium
Both main and interactive effects of various soil texture (ST) and treatments (T) were significant on soil extractable potassium (K). No significant change was observed among 2% BC, 2% AAC, 1% BC, 1% AAC and control for extractable K in clay. In the case of sandy clay loam, application of 2% BC and 2% AAC remained significantly better over control for extractable K. Both 1% BC and 1% AAC were statistically alike to each other and with control for extractable K in sandy clay loam (Fig. 4). Similarly, 2% BC and 2% AAC also remained statistically alike to each other for extractable K in sandy clay loam. The maximum increase of 60.6% in extractable K was noted over control where 2% AAC was applied in sandy clay loam.
Figure 4.
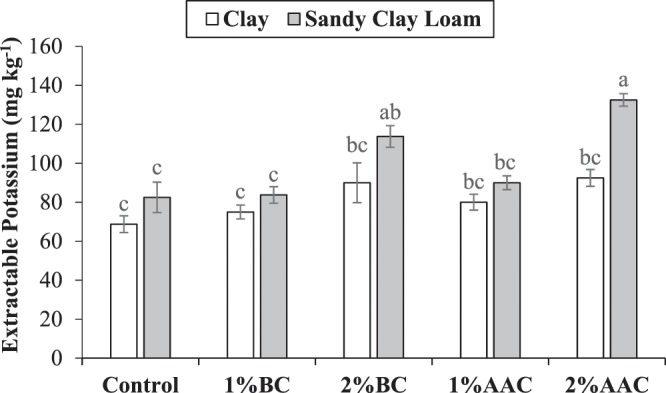
Effect of various levels of thermo pyrolyzed BC and chemically acidified activated carbon on clay and sandy clay loam textured soil extractable potassium. Error bars represents standard error calculated through 3 replicates of each treatment.
Soil zinc
Both main and interactive effects of various soil texture (ST) and treatments (T) were significant on soil extractable zinc (Zn). Application of 2% AAC remained significantly better as compared to control for soil extractable Zn in clay. It was noted that 1% AAC, 1% BC and 2% BC were statistically alike to each other but only 1% AAC and 2% BC remained significantly better as compared to control for soil extractable Zn in clay. Application of 1% BC was statistically similar to control for soil extractable Zn in clay. In case o0f sandy clay loam, 2% BC and 2% AAC performed significantly better as compared to control for soil extractable Zn. No significant change was observed among 1% AAC and 1% BC for soil extractable Zn in sandy clay loam. It was observed that 2% BC was statistically alike but 2% AAC differed significantly as compared to 1% AAC for soil extractable Zn in sandy clay loam (Fig. 5). However, 1% AAC and 1% BC remained significantly better over control for soil extractable Zn in sandy clay loam. The maximum increase of 42.0 and 52.2% in soil extractable Zn in sandy clay loam was observed as compared to control where 2% AAC was applied in clay and sandy clay loam respectively.
Figure 5.
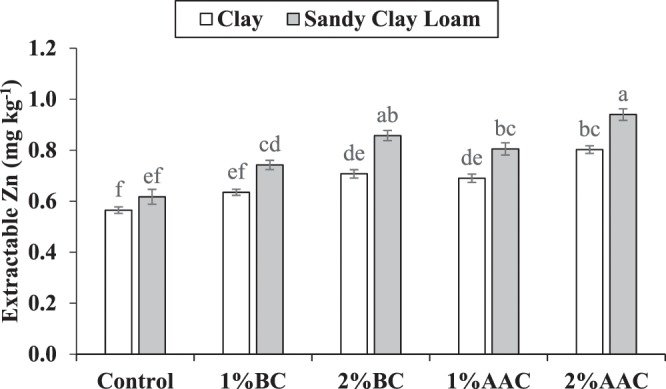
Effect of various levels of thermo pyrolyzed BC and chemically acidified activated carbon on clay and sandy clay loam textured soil extractable zinc. Error bars represents standard error calculated through 3 replicates of each treatment.
Soil boron
Both main and interactive effects of various soil texture (ST) and treatments (T) were significant on soil extractable B. Application of 2% BC, 1% AAC and 2% AAC were statistically alike to each other but differed significantly as compared to control for soil extractable B in clay. No significant change was noted among 1% BC, 2% BC and 1% AAC for soil extractable B in clay. However, 2% BC remained significantly better as compared to 1% BC for soil extractable B in clay. In addition, 1% BC also differed significantly for soil extractable B over control in clay soil. In the case of sandy clay loam, application of 1% BC, 2% BC, 1% AAC and 2% AAC were statistically similar to each other from control for soil extractable B (Fig. 6). However, 2% BC, 1% AAC and 2% AAC differed significantly from control for soil extractable B in sandy clay loam. No significant change was noted in soil extractable B over control in 1% BC. The maximum increase of 111.4 and 46.2% in soil extractable B was noted in 2% AAC over control in clay and sandy clay loam respectively.
Figure 6.
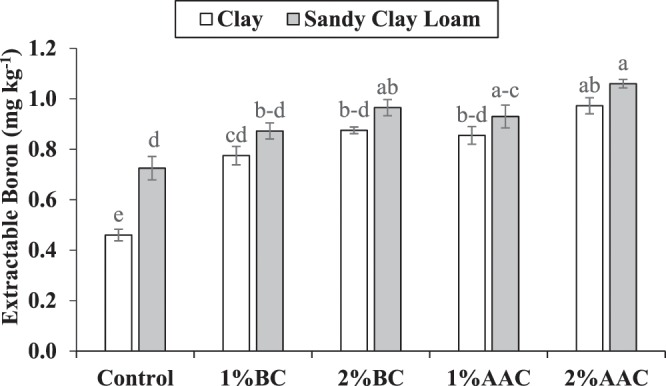
Effect of various levels of thermo pyrolyzed BC and chemically acidified activated carbon on clay and sandy clay loam textured soil extractable boron. Error bars represents standard error calculated through 3 replicates of each treatment.
Soil iron
Both main and interactive effects of various soil texture (ST) and treatments (T) were significant on soil extractable iron (Fe). Application of 2% BC, 1% AAC and 2% AAC were statistically alike to each other but differed significantly as compared to control for soil extractable Fe in clay. No significant change was noted among 2% BC and 1% BC for soil extractable Fe in clay soil. It was noted that 1% BC also remained significantly different as compared to control in clay for soil extractable Fe. For sandy clay loam, 1% and 2% AAC were statistically similar to each other but differed significantly as compared to control for extractable Fe (Fig. 7). Similarly, no significant change was noted among 1% BC and 2% BC but only 2% BC remained significantly better from control for extractable Fe in sandy clay loam. The maximum increase of 59.5 and 34.4% in extractable soil Fe was noted over control where 2% AAC was applied as a treatment in clay and sandy clay loam respectively.
Figure 7.
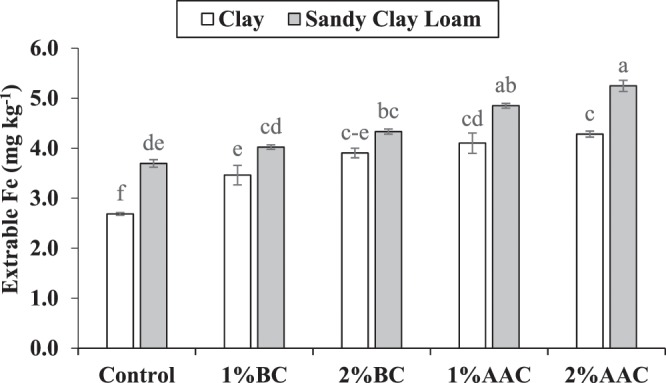
Effect of various levels of thermo pyrolyzed BC and chemically acidified activated carbon on clay and sandy clay loam textured soil extractable iron. Error bars represents standard error calculated through 3 replicates of each treatment.
Discussion
In the current study, the application of BC significantly increased the pHs of soil. This increase in soil pHs was due to high pH of BC. Presence of alkaline mineral elements was the possible reason for the high pH of BC (Table 1). Biochar addition in soil significantly enhanced the soil ECe possibility due to the release of mineral nutrients (soluble base cations K+ and Ca++ and Na+) in soil solution and exchange with soil exchange sites. Pre-experimental analysis of P, K and Ca in BC (Table 1) validated our argument regarding a significant increase in soil EC. A significant amount of presence of mineral nutrients in BC structure is well documented by many scientists5,34,35. Abid et al.34 also reported similar kind of significant increase in soil pH when they applied BC in soil under various sources of irrigation. During pyrolysis oxygen-containing functional groups and alkaline ash, contents are increased on the surface of BC that played an imperative role in the enhancement of soil pH36. According to Yuan et al. ash content of BC may have 48–330 cmol kg−1 soluble base cations (K+, Ca++, Mg++, and Na+). On the other hand, the presence of Ca++, Mg++ and K+ in large amount easily replace the H+ ions in soil solution, thus, resulted in an increase of soil pH37. However, AAC significantly decreased the soil pHs might be due to the presence of H2SO4 in the pore spaces. The molecules of H2SO4 possibility become the part of soil solution when the soil was irrigated. Enrichment of H+ ions by H2SO4 decreased the soil pH significantly. Furthermore, higher amount of Ca in calcareous soil might react with SO4 which make CaSO4 that is well documented regarding aaleviation of adverse effects of Na. In addition, AAC would be the major cause of an increase in the buffering ability of soil to sustain low pH for a long time (60 days). Reduction in soil EC by AAC might also be due to sorption of minerals by empty exchange sites, possibly produced due to the release of H2SO4 in soil. Low pH of soil played an imperative role in the solubilization of immobile soil P. According to Hopkins and Ellsworth38 reduction in soil pH (6.5) increase the mobility of fixed soil P. Under low soil pH, the activity of H+ dissociates the linkage of calcium and phosphorus in calcareous parent material soils. The breakage of the bond between calcium and P resulted in dissolution and availability of immobile P in soil solution39. In addition, P is also the part of BC structure as well40. Reduction in pH of biochar also increases the release of P from biochar into soil solution41 as observed in AAC of the current study. Indirectly BC application also facilitates the soil microbes to secrete phosphomonoesterase that enhances the soil P mineralization42. In the current study, improvement in micronutrients, Zn, B and Fe might also be associated with the reduction in soil pH and improvement in cation exchange sites of soil. According to Laird43 application of BC can increase 20% cation exchange capacity (CEC) of soil. This CEC is an indirect measure which enhanced water and nutrients retention by decreasing its leaching loss. Higher surface area and the carboxyl group of BC play an imperative role in increasing the CEC of soil and nutrients availability44.
Table 1.
Characteristics of thermo pyrolyzed biochar (BC) and acidified activated carbon (AAC).
| BC | Unit | Value | AAC | Unit | Value |
|---|---|---|---|---|---|
| pH | — | 4.11 | pH | — | 8.03 |
| ECe | dS m−1 | 1.83 | ECe | dS m−1 | 2.11 |
| Volatile Matter | % | 10.90 | Volatile Matter | % | 12.29 |
| Ash Content | % | 13.10 | Ash Content | % | 40.26 |
| Fixed Carbon | % | 76.00 | Fixed Carbon | % | 47.45 |
| Total N | % | 0.95 | Total N | % | 0.16 |
| Total P | % | 0.66 | Total P | % | 0.43 |
| Total K | % | 2.09 | Total K | % | 1.66 |
| Total Ca | % | 4.21 | Total Ca | % | 3.96 |
| Total Na | % | 0.61 | Total Na | % | 0.59 |
| Total Zn | mg kg−1 | 0.10 | Total Zn | mg kg−1 | 0.13 |
| Total B | mg kg−1 | 0.17 | Total B | mg kg−1 | 0.22 |
| Total Fe | mg kg−1 | 1.12 | Total Fe | mg kg−1 | 1.01 |
Conclusion
In conclusion, sulphuric acid use is an easier and adaptable method to produce activated carbon at commercial scale. Thermal pyrolyzed BC due to high pH is less efficacious than AAC for improvement in soil health and fertility status. More investigations are needed to introduce AAC as an effective replacement of BC optimum utilization of micro and macronutrients in soil.
Materials and Methods
An incubation experiment was conducted in Soil and Water Testing Laboratory for Research Multan. The treatments were control (no BC and no AC), 1% biochar (1% BC), 2% biochar (2% BC), 1% acidic activated carbon (1% AAC), 2% acidic activated carbon (2% AAC) applied in two different texture of soil (clay and sandy clay loam).
For the production of thermo pyrolyzed biochar (BC), sugarcane waste syrup was collected from the sugar mill. After oven drying at 65 °C, clods like the structure of syrup was collected and pyrolyzed in partially aerobic pyrolyzer at 550 °C for 75 min5. Finally, prepared BC was grinded and passed through sieve 2 mm sieve and stored in airtight plastic jars for further experimentation.

For the very first chemically acidified activated carbon (AAC) was prepared by using sugarcane waste syrup of sugar mill. Syrup waste was taken in a specially designed reactor. After that concentrated (98%) sulphuric acid (H2SO4) was added in the reactor (2:1, v/v). A vigorous reaction takes place in which water was evaporated from the waste syrup of sugar mill leaving behind acidic activated carbon (AAC).
Biochar pH and EC were determined in BC and AAC by making water ratio of 1:20 w/v32. Digestion of BC and AAC was done by using di-acid mixture HNO3:HClO4 in 2:1 ratio45. The yellow colour method was followed for total phosphorus (P) analysis in BC and AAC on a spectrophotometer46. Potassium concentration in BC and AAC was measured on flamephotometer47. For analysis of nitrogen on Kjeldahl’s distillation apparatus48, H2SO4 digestion46 was followed. Ash content (AC) and volatile matter (VM) in BC and AAC were determined by heating the sample in a muffle furnace at 550 °C and 450 °C respectively49. The fixed carbon in BC and AAC was calculated using the equation Noor et al.50:
The characteristics of BC and AAC are given in Table 1.
For incubation of soil, small clay pots were used. In each pot, 1 kg of soil was added along with BC and AAC as per treatment plan. The moisture of soil was maintained 65% on w/w basis throughout the incubation of 60 days. After 60 days all the soil samples were initially air dried and then passed through 2 mm nylon sieve for their analysis.
For determination of pHs and ECe of soil Schofield and Taylor51 and US Salinity Laboratory Staff 52 were followed respectively. Extractable soil phosphorus was analyzed by Olsen and Sommers53 methodology. Nadeem et al.47 method was followed for determination of extractable soil K. Boron in soil samples were analyzed according to Bingham54 on a spectrophotometer using Azomethine-H. Micronutrients zinc (Zn) and iron (Fe) were analyzed on atomic absorption spectrophotometer according to the methodology of Lindsay and Norvell55.
Statistical analysis was done according to the standard statistical procedure of Steel et al.56. Descriptive statistical analysis and analysis of variance (ANOVA) was applied on data to find significance. Means were compared by Tukey’s test and correlation was find at the p ≤ 0.05 level47.
Author contributions
S.D. performed research, prepared biochar, collected data and write manuscript; N.A. designed the experiment and completed the manuscript writing; H.S. helped in manuscript improvement and revision; M.M. helped in characterization of biochar and acidified activated carbon.
Data availability
No datasets were generated or analyzed during the current study. All the analyzed data can be accessed after publication by requesting to the corresponding author.
Competing interests
The authors declare no competing interests.
Footnotes
Publisher’s note Springer Nature remains neutral with regard to jurisdictional claims in published maps and institutional affiliations.
References
- 1.Tilman D, Cassman KG, Matson PA, Naylor R, Polasky S. Agricultural sustainability and intensive production practices. Nature. 2002;418:671–677. doi: 10.1038/nature01014. [DOI] [PubMed] [Google Scholar]
- 2.Alexandratos N. World food and agriculture: Outlook for the medium and longer term. Proc. Natl. Acad. Sci. 1999;96:5908–5914. doi: 10.1073/pnas.96.11.5908. [DOI] [PMC free article] [PubMed] [Google Scholar]
- 3.Cohen, J. E. How Many People Can the Earth Support? WW Norton & Company (1995).
- 4.Farrell M, Macdonald LM, Butler G, Chirino-Valle I, Condron LM. Biochar and fertiliser applications influence phosphorus fractionation and wheat yield. Biol. Fertil. Soils. 2014;50:169–178. doi: 10.1007/s00374-013-0845-z. [DOI] [Google Scholar]
- 5.Tahir FA, Ahamad N, Rasheed MK, Danish S. Effect of various application rate of zinc fertilizer with and without fruit waste biochar on the growth and Zn uptake in maize. Intl. J. Biosci. 2018;13:159–166. doi: 10.12692/ijb/13.1.159-166. [DOI] [Google Scholar]
- 6.FAO. Food and Agriculture Organization of the United Nations (FAO). (2001). [PubMed]
- 7.Sarma PK, et al. Effect of Foliar Application of Potassium on Yield, Drought Tolerance and Rain Water Use Efficiency of Toria under Rainfed Upland Situation of Assam. Indian. J. Dryl. Agric. Res. Dev. 2015;30:55–59. doi: 10.5958/2231-6701.2015.00008.1. [DOI] [Google Scholar]
- 8.Cordell D, White S. Tracking phosphorus security: indicators of phosphorus vulnerability in the global food system. Food Security. 2015;7:337–350. doi: 10.1007/s12571-015-0442-0. [DOI] [Google Scholar]
- 9.Jianping Z. Soil erosion in Guizhou province of China: A case study in Bijie prefecture. Soil. Use Manag. 1999;15:68–70. doi: 10.1111/j.1475-2743.1999.tb00067.x. [DOI] [Google Scholar]
- 10.Hasina G, Said A, Saeed B, Mohammad F, Ahmad I. Effect of foliar application of nitrogen, potassium and zinc on wheat growth. ARPN J. Agric. Biol. Sci. 2011;6:56–58. [Google Scholar]
- 11.Wu, F. Z., Zhao, F. Y. & Liu, Y. Y. Analysis of the problems in continues cropping system of protective vegetable and the controlling ways. In Fertilizing for Sustainable Production of High Quality Vegetables. (eds. Li, X. L., Zhang, F. S. & Mi, G. H.) 157–163 (China Agricultural University Publisher, 2000).
- 12.Bockman, O. C., Kaarstad, O., Lie, O. H. & Richards, I. Agriculture and Fertilizers. (Agricultural Group, Norsk Hydro A.S, 1990).
- 13.Vitousek, P. M., Mooney, H. A., Lubchenco, J. & Melillo, J. M. Human domination of Earth’s ecosystems. In Urban Ecology: An International Perspective on the Interaction Between Humans and Nature 3–13 (2008). 10.1007/978-0-387-73412-5_1
- 14.Carpenter SR, et al. Nonpoint Pollution of Surface Waters with Phosphorus and Nitrogen. Issues Ecol. 1998;8:559–568. [Google Scholar]
- 15.Sönmez İ, Kaplan M, Sönmez S. Kimyasal gübrelerin çevre kirliliği üzerine etkileri ve çözüm önerileri’. Batı Akdeniz Tarımsal Araştırma Enstitüsü Derim Derg. 2008;25:24–34. [Google Scholar]
- 16.Tandon, H. L. S. Micronutrients in Soils, Crops, and Fertilizers. In Fertilizer Development and Consultation Organization (1995).
- 17.Cakmak I, et al. Zinc deficiency as a critical problem in wheat production in Central Anatolia. Plant. Soil. 1996;180:165–172. doi: 10.1007/BF00015299. [DOI] [Google Scholar]
- 18.Rashid A, Kausar MA, Hussain F, Tahir M. Alleviating Zinc Deficiency in Transplanted Flooded Rice Grown in Alkaline Soils of Pakistan. Int. Rice Res. Notes. 1999;24:32–33. [Google Scholar]
- 19.Kumar Singh A, et al. Effect of Sulphur and Zinc on Rice Performance and Nutrient Dynamics in Plants and Soil of Indo Gangetic Plains. J. Agric. Sci. 2012;4:162–170. [Google Scholar]
- 20.Quijano-Guerta C, Kirk GJD, Portugal AM, Bartolome VI, McLaren GC. Tolerance of rice germplasm to zinc deficiency. F. Crop. Res. 2002;76:123–130. doi: 10.1016/S0378-4290(02)00034-5. [DOI] [Google Scholar]
- 21.Mortvedt, J. J., Cox, F. R., Shuman, L. M. & Welch, R. M. Micronutrients in Agriculture. (Soil Sci. Soc. Amer., 1991).
- 22.Bennett EM, Carpenter SR, Caraco NF. Human Impact on Erodable Phosphorus and Eutrophication: A Global Perspective Increasing accumulation of phosphorus in soil threatens rivers, lakes, and coastal oceans with. Source Biosci. 2001;51:227–234. doi: 10.1641/0006-3568(2001)051[0227:HIOEPA]2.0.CO;2. [DOI] [Google Scholar]
- 23.Rashid A, Rafique E, Din J, Malik SN, Arain MY. Micronutrient deficiencies in rainfed calcareous soils of Pakistan. I. Iron chlorosis in peanut. Commun. Soil. Sci. Plant. Anal. 1997;28:135–148. doi: 10.1080/00103629709369778. [DOI] [Google Scholar]
- 24.Saxena MC, Malhotra RS, Singh KB. Iron deficiency in chickpea in the Mediterranean region and its control through resistant genotypes and nutrient application. Plant. Soil. 1990;23:251–254. doi: 10.1007/BF00011277. [DOI] [Google Scholar]
- 25.Rashid A, Rafique E, Bughio N. Micronutrient deficiencies in rainfed calcareous soils of pakistan. III. Boron nutrition of sorghum. Commun. Soil. Sci. Plant. Anal. 1997;28:441–454. doi: 10.1080/00103629709369802. [DOI] [Google Scholar]
- 26.Niaz A, Hannan A, Waqas M. Boron Status of Soils as Affected by Different Soil Characteristics–pH, CaCO3, Organic Matter and Clay Contents. Pak. J. Agri. Sci. 2007;44:428–435. [Google Scholar]
- 27.Moheyuddin K, Salahuddin J, Mari aH, Panhwar RN. Effect of Zinc and Boron Fertilizers Application on Some Physicochemical Attributes of Five Rice Varieties Grown in Agro-Ecosystem of Sindh, Pakistan. Am. J. Agric. Environ. Sci. 2013;13:433–439. [Google Scholar]
- 28.Sönmez İ, Kaplan M, Sönmez S. An investigation of seasonal changes in nitrate contents of soils and irrigation waters in greenhouses located in antalya-demre region. Asian J. Chem. 2007;19:5639–5646. [Google Scholar]
- 29.Khan N, et al. Physical and chemical properties of biochars co-composted with biowastes and incubated with a chicken litter compost. Chemosphere. 2016;142:14–23. doi: 10.1016/j.chemosphere.2015.05.065. [DOI] [PubMed] [Google Scholar]
- 30.Woolf D, Lehmann J, Lee DR. Optimal bioenergy power generation for climate change mitigation with or without carbon sequestration. Nat. Commun. 2016;7:13160. doi: 10.1038/ncomms13160. [DOI] [PMC free article] [PubMed] [Google Scholar]
- 31.Liang B, et al. Black carbon increases cation exchange capacity in soils. Soil. Sci. Soc. Am. J. 2006;70:1719. doi: 10.2136/sssaj2005.0383. [DOI] [Google Scholar]
- 32.ASTM Standard. Standard test method for chemical analysis of wood charcoal. American Society for Testing and Materials, Conshohocken, PA (2009).
- 33.Shi RY, et al. Mechanisms for increasing the pH buffering capacity of an acidic ultisol by crop residue-derived biochars. J. Agric. Food Chem. 2017;65:8111–8119. doi: 10.1021/acs.jafc.7b02266. [DOI] [PubMed] [Google Scholar]
- 34.Abid M, et al. Biochar increased photosynthetic and accessory pigments in tomato (Solanum lycopersicum L.) plants by reducing cadmium concentration under various irrigation waters. Environ. Sci. Pollut. Res. 2017;24:22111–22118. doi: 10.1007/s11356-017-9866-8. [DOI] [PubMed] [Google Scholar]
- 35.Younis U, et al. Growth, survival, and heavy metal (Cd and Ni) uptake of spinach (Spinacia oleracea) and fenugreek (Trigonella corniculata) in a biochar-amended sewage-irrigated contaminated soil. J. Plant. Nutr. Soil. Sci. 2015;178:209–217. doi: 10.1002/jpln.201400325. [DOI] [Google Scholar]
- 36.Yuan JH, Xu RK, Zhang H. The forms of alkalis in the biochar produced from crop residues at different temperatures. Bioresour. Technol. 2011;102:3488–3497. doi: 10.1016/j.biortech.2010.11.018. [DOI] [PubMed] [Google Scholar]
- 37.Rizwan M, et al. Mechanisms of biochar-mediated alleviation of toxicity oftrace elements in plants: a critical review. Environ. Sci. Pollut. Res. 2016;23:2230–2248. doi: 10.1007/s11356-015-5697-7. [DOI] [PubMed] [Google Scholar]
- 38.Hopkins, B. & Ellsworth, J. Phosphorus availability with alkaline/calcareous soil. In Western Nutrient Management Conference 88–93 (2005).
- 39.Dorozhkin SV. Dissolution mechanism of calcium apatites in acids: A review of literature. World J. Methodol. 2012;2:1–17. doi: 10.5662/wjm.v2.i1.1. [DOI] [PMC free article] [PubMed] [Google Scholar]
- 40.Danish S, et al. Phosphorus solubilizing bacteria and rice straw biochar consequence on maize pigments synthesis. Int. J. Biosci. 2015;5:31–39. [Google Scholar]
- 41.Silber A, Levkovitch I, Graber ER. PH-dependent mineral release and surface properties of cornstrawdbiochar: agronomic implications. Environ. Sci. Technol. 2010;44:9318–9323. doi: 10.1021/es101283d. [DOI] [PubMed] [Google Scholar]
- 42.Paz-Ferreiro J, Gascó G, Gutiérrez B, Méndez A. Soil biochemical activities and the geometric mean of enzyme activities after application of sewage sludge and sewage sludge biochar to soil. Biol. Fertil. Soils. 2012;48:511–517. doi: 10.1007/s00374-011-0644-3. [DOI] [Google Scholar]
- 43.Laird DA, et al. Impact of biochar amendments on the quality of a typical Midwestern agricultural soil. Geoderma. 2010;158:443–449. doi: 10.1016/j.geoderma.2010.05.013. [DOI] [Google Scholar]
- 44.Ding Y, et al. Biochar to improve soil fertility. A review. Agron. Sustain. Dev. 2016;36:36. doi: 10.1007/s13593-016-0372-z. [DOI] [Google Scholar]
- 45.Chapman, H. D. & Pratt, P. F. Methods of analysis for soils, plants and water. (1961).
- 46.Jones, J. B., WolfH, B. & Mills, H. A. Plant Analysis Handbook: A Practical Sampling, Preparation, Analysis, and Interpretation Guide. (Micro-Macro Publishing Inc., 1991).
- 47.Nadeem F, et al. Qualitative and Chemical Analysis of Rice Kernel to Time of Application of Phosphorus In Combination With Zinc Under Anaerobic Conditions. Asian J. Agric. Biol. 2013;1:67–75. [Google Scholar]
- 48.Van Schouwenberg, J. C. & Walinge, I. Methods of Analysis for Plant Material. (Agricultural University Wageningen, 1973).
- 49.Danish. S, et al. Effect of foliar application of Fe and banana peel waste biochar on growth, chlorophyll content and accessory pigments synthesis in spinach under chromium (IV) toxicity. Open. Agri. 2019;4:381–390. doi: 10.1515/opag-2019-0034. [DOI] [Google Scholar]
- 50.Noor NM, Shariff A, Abdullah N. Slow Pyrolysis of Cassava Wastes for Biochar Production and Characterization. Iran. J. Energy Env. 2012;3:60–65. [Google Scholar]
- 51.Schofield RK, Taylor AW. The measurement of soil pH. Soil. Sci. Soc. Am. Proc. 1995;19:164–167. doi: 10.2136/sssaj1955.03615995001900020013x. [DOI] [Google Scholar]
- 52.US Salinity Laboratory Staff. In Diagnosis and Improvement of Saline and Alkali Soils (Agric. Handbk. 60.US Government Printing Office, 1954).
- 53.Olsen, S. R. & Sommers, L. E. Phosphorus. In Method of soil analysis, Agron. No. 9, part 2: Chemical and microbiological properties (ed. Page, A. L.) 403–430 (American Society of Agronomy, 1982).
- 54.Bingham, F. T. Boron. In Methods of Soil Analysis, Part 2 437–447 (Agron. Monogr. No. 9. ASA and SSSA, 1982).
- 55.Lindsay WL, Norvell WAa. DTPA soil test for zinc, iron, manganese and copper. Soil. Sci. Soc. Am. 1978;42:421–428. doi: 10.2136/sssaj1978.03615995004200030009x. [DOI] [Google Scholar]
- 56.Steel, R. G., Torrie, J. H. & Dickey, D. A. Principles and Procedures of Statistics: A Biometrical Approach. (McGraw Hill Book International Co., 1997).
Associated Data
This section collects any data citations, data availability statements, or supplementary materials included in this article.
Data Availability Statement
No datasets were generated or analyzed during the current study. All the analyzed data can be accessed after publication by requesting to the corresponding author.


