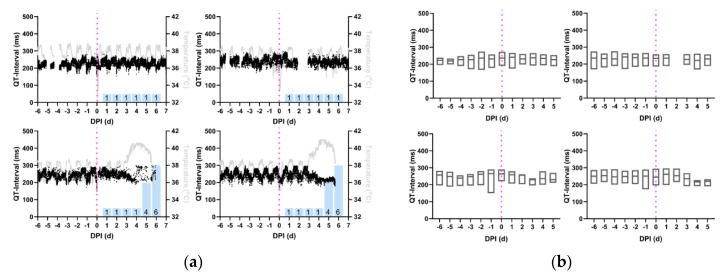
Figure 3.
Reduction in QT-interval during the febrile period in macaques infected with severe EEEV. Shown are the profiles (a) of QT-interval derived from 1-min average measurements for four individual macaques infected with EEEV. Black: QT-interval (ms), Gray: temperature (°C), and Magenta: aerosol challenge. Blue Bars: Neurological score on corresponding day. (b) Average daily QT-interval measurements, from repeated measures ANOVA, depicted in with boxes delimited by interquartile range and center line signifying median value. For (a) and (b), Top Left: M160-16, Bottom Left: M161-16, Top Right: M162-16, Bottom Right: M163-16.

