

ABSTRACT
Background:
Debate still exists regarding physical and cognitive factors associated with Body Mass Index (BMI) in the elderly population. This study aimed to determine the association between BMI and comorbidity, Quality of Life (QOL), and cognitive function in the elderly population
Methods:
This cross-sectional study was conducted from October 2017 to January 2018. The participants included 246 old people who referred to Imam Reza elderly clinic, Shiraz, Iran. The data were collected using Leipad Quality of Life Questionnaire and Mini-Mental State Examination (MMSE). Indeed, weight and height were measured to assess the BMI. The data were entered into SPSS, version 21, and analyzed using ANOVA, Chi-square test, Pearson correlation coefficient, and multiple regression analysis
Results:
This study showed that 104 (47%) of the participants were overweight and obese. The mean±SD score of QOL was 46.14±12.01. Additionally, 93 (37.8%) of the participants had cognitive impairment. The results showed a significant difference among normal weight, overweight, and obese groups regarding the mean scores of QOL (P<0.001) and cognitive function (P<0.001). Moreover, 29% of the changes in BMI was explained by QOL, cognitive function, and having hypertension and cancer. Among these variables, the associations between BMI and QOL (r=–0.52, P<0.001) and cognitive function (r=–0.28, P<0.001) were significant
Conclusion:
The results showed that half of the old people suffered from overweight and obesity. Moreover, roughly one-third had cognitive impairment. In addition, BMI was associated with QOL and cognitive function in the elderly. Therefore, healthcare workers might use these findings to design prevention and treatment programs targeting the elderly population
KEYWORDS: Aged, Body mass index, Cognition, Quality of life
INTRODUCTION
Aging is a major risk factor for multi-morbidity, 1 such as heart failure, 2 hypertension, 3 and osteoarthritis. 4 These comorbidities might affect the elderly people’s Quality Of Life (QOL). Depression and physical frailty as a dimension of QOL increased the risk of cognitive impairment. 5 In addition, aging leads to changes in cognition and decrease in performance of cognitive tasks. 6 Moreover, half of the elderly people suffer from obesity. 7 Obesity, as a chronic disease, has become common around the world. 8
Researchers believed that increase in Body Mass Index (BMI) in the elderly people might reduce life expectancy 9 and increase the risk of mortality, 7 cardiovascular diseases, 10 and metabolic syndrome. 11 In fact, obesity has a crucial role in atherosclerosis and coronary heart diseases. 12 On the other hand, Some study reported that overweight reduced all-cause mortality risk. 13
The physical component of QOL was also lower in underweight, overweight, and obese elderly adults compared to those with normal BMI. 14 In addition, obesity might impair cognition and motor performance 15 and lead to poor cognitive performance, cognitive decline, and dementia. 16 In a study, obese people dealt with faster decline in their memory, executive function, and processing speed. 17 However, debate still exists regarding the association between obesity, and QOL and cognitive ability in the elderly population. No relationships were reported between higher BMI and lower QOL in Korean elderly population. 18 However, another study indicated a protective association between obesity and cognitive function. 19 Another study also indicated that obese people obtained higher scores in attention and visuospatial ability tests. 20 Other researchers showed that overweight was associated with a reduction in the risk of cognitive impairment in the elderly people. 21
Up to now, there has been some controversy about the outcomes of overweight and obesity in elder people. Thus, more studies are needed to confirm this evidence. Moreover, a limited number of studies have evaluated the association between BMI and comorbidities such as having heart diseases, 22 hyperlipidemia, hypertension, diabetes, 23 orthopedic problems, urinary incontinency and cancer in the elderly population. Therefore, the present study aims to determine the association between BMI and comorbidity, QOL, and cognitive function in the elderly population.
MATERIAL AND METHODS
This is a cross-sectional study conducted in the elderly clinic of Imam Reza Clinic affiliated to Shiraz University of Medical Sciences (SUMS), Shiraz, Iran from October 2017 to January 2018. This clinic is an innovative care setting for the elderly patients with complex heath care needs. The reason for selection of this clinic was that the elderly referred to this was likely to our society. The elderly people over 60 years of age included in this study. The exclusion criteria were suffering from mental disorders (major depression, anxiety, bipolar, dementia, and schizophrenia) and neurocognitive impairments, such as Alzheimer’s disease.
Based on the study by Giuli et al. 24 considering α=0.05, β=90%, and expected correlation coefficient between BMI and physical component summery score of QOL=0.22, and following formula, a 213-subject sample size was estimated for the study. Then, the sample size was raised to 250 subjects.
The participants were selected using convenience sampling. The data were collected using a demographic information form, Leipad Quality of Life Questionnaire, and Mini-Mental State Examination (MMSE). The demographic form included information about the participants’ gender, previous occupation, age, education level, marital status, weight, and height. Some chronic diseases were also assessed by this form. Information about these chronic diseases was gathered from the participants’ medical records.
The participants’ BMI was calculated by dividing their weight in kg by their height in meters squared. In so doing, a calibrated Seca digital medical scale (GmBH and Co. KG, Germany) was used. This scale benefitted from high sensitivity and accuracy, calculating the subjects’ weight to the nearest 0.1 kg. In order to measure their height, we asked the subjects to wear light clothing and stand in upright position without shoes. The participants’ height was measured to the nearest 0.5 cm. Weight and height were recorded by a researcher’s assistant who had BSc in nursing. Then, based on BMI, the elderly people were divided into three groups, namely obese (BMI≥30 kg/m2), overweight (25 kg/m2 ≥BMI≤29.9 kg/m2), and normal weight (18.5 kg/m2 ≥ BMI≤24.9 kg/m2). 25
Leipad Quality of Life Questionnaire was developed by De Leo et al. at European office of the World Organization. The 31 items of this questionnaire were scored from 0 to 3 based on a Likert scale. Thus, the total score of the questionnaire ranged from zero to 93, with higher scores indicating better QOL. The construct validity of the questionnaire was approved by Leo et al. 26 Moreover, exploratory factor analysis was done on the questionnaire and its construct validity was approved by France researchers. 27 The concurrent validity of the questionnaire with Rotterdam Questionnaire was approved. 26 The questionnaire internal consistency was approved by test-retest reliability. 27 The questionnaire was translated from English into Persian by Hesamzadeh et al. In addition, the content validity of this questionnaire was approved by 10 expert faculty members in Iranian Medical Sciences Universities. 28 Moreover, the reliability of Persian version of Leipad Quality of Life Questionnaire was approved by alpha Cronbach as 0.83, 29 and 0.831. 30 In this study, the reliability of the Persian version of the questionnaire was 0.86.
Another data collecting instrument was MMSE developed by Folstein and Folstein. This 11-item examination is the most common cognitive screening test. The use of this instrument takes approximately 7-10 minutes to screen cognitive impairment. 31 The total score of the instrument ranges from 0 to 30, with scores below 23 representing cognitive impairment. In a previous study, the cutoff score of <24 showed a sensitivity of 58% and a specificity of 98%. 32 Besides, the face validity of the Persian version of the examination was approved by Seyedian et al. The discriminate validity of the questionnaire on two healthy and dementia subjects was approved. The reliability of this questionnaire was approved by alpha Cronbach as 0.81. 33
This study was approved by the Ethics Committee of SUMS (Code: IR.SUMS.REC.1396.15118). The elderly subjects were required to sign written consent forms including information about the study objectives as well as benefits and risks that might occur as a result of participation in the study. Moreover, they were aware that participation in the study was voluntary and their information would be published anonymously. It should be noted that one of researchers answered the subjects’ questions through E-mail and cellphone.
After all, the data were analyzed using SPSS Chicago, IL. USA, version 21. Descriptive statistics and Pearson and Spearman correlation coefficients were used. In addition, ANOVA and Chi-square test were used to compare the normal weight, overweight, and obese individuals with respect to the study variables. In order to determine the association between BMI and QOL, and cognitive function, we used Pearson correlation coefficient. Moreover, multiple regression analysis was applied to determine the factors associated with BMI. P<0.05 was considered statistically significant.
RESULTS
This study was conducted on 246 subjects. As shown in Figure 1, nearly half of the elderly participants had normal weight (n=130, 53%). According to Table 1, most of the participants were female, married, and illiterate. The mean±SD of the age of the whole population and normal weight, overweight, and obese participants was 67.96±7.17, 67.10±6.75, 69.32±7.71, and 68.25±7.28 years, respectively. Approximately one-third of the participants in the three groups lived on their own. The results showed no significant differences among the study groups regarding age, gender, marital status, education level, and living arrangement (Table 1).
Figure1.
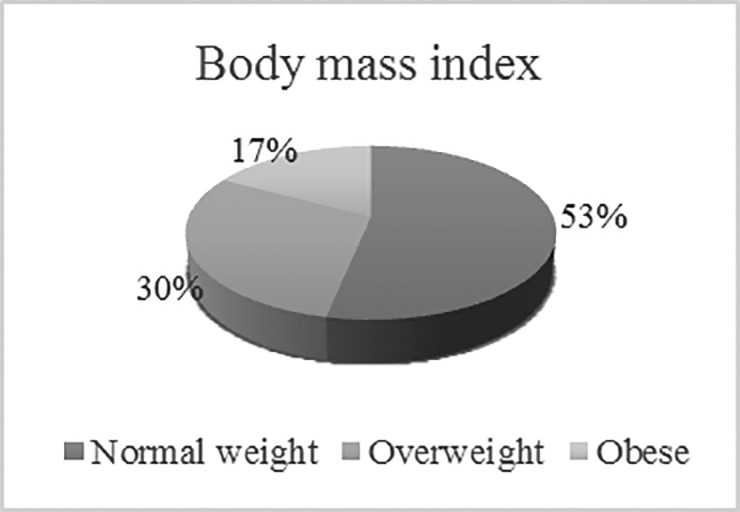
Body mass index assessment in the elderly population
Table1.
The characteristics of the elderly participants based on their body mass index
| Variables | Total subjects (N=246 )(Mean±SD) | Normal weight (N=130) (Mean±SD) | Overweight (N=73 )(Mean±SD) | Obese (N=43) (Mean±SD) | P value |
|---|---|---|---|---|---|
| Age | 67.96 (7.17) | 67.10 (6.75) | 69.32 (7.71) | 68.25 (7.28) | P=0.12* |
| N (%) | N (%) | N (%) | N (%) | ||
| Gender | P=0.98** | ||||
| Male | 91 (37.0) | 46 (37.4) | 24 (36.9) | 21 (36.2) | |
| Female | 155 (63.0) | 77 (62.6) | 41 (63.1) | 37 (63.8) | |
| Marital Status | P=0.96** | ||||
| Single | 11 (4.5) | 5 (4.1) | 3 (4.6) | 3 (5.2) | |
| Married | 157 (63.8) | 80 (65.0) | 43 (66.2) | 34 (58.7) | |
| Divorced | 24 (9.8) | 13 (10.6) | 5 (7.7) | 6 (10.3) | |
| Widowed | 54 (22.0) | 25 (20.3) | 14 (25.9) | 15 (25.9) | |
| Education level | P=0.93** | ||||
| Illiterate | 125 (50.5) | 62 (50.4) | 34 (52.3) | 29 (50.0) | |
| Elementary school | 40 (16.3) | 18 (14.6) | 10 (15.4) | 12 (20.7) | |
| Secondary school | 58 (23.6) | 32 (26.0) | 14 (21.5) | 12 (20.7) | |
| High school and diploma | 23 (9.3) | 11 (8.9) | 7 (10.8) | 5(8.6) | |
| Living arrangement | P=0.36** | ||||
| Living with one’s children | 26 (10.6) | 12 (9.8) | 6 (9.2) | 8 (13.8) | |
| Living with one’s sister or brother | 53 (21.5) | 26 (21.1) | 11 (16.9) | 16 (27.6) | |
| Living with one’s wife/husband | 64 (26.0) | 38 (30.9) | 16 (24.6) | 10 (17.2) | |
| Living on one’s own | 103 (41.9) | 47 (38.2) | 32 (49.2) | 24 (41.4) | |
| Having diabetes | P=0.36** | ||||
| Yes | 46 (18.7) | 13 (10.6) | 4 (6.2) | 8 (13.8) | |
| No | 200 (81.3) | 110 (89.4) | 61 (93.8) | 50 (86.2) | |
| Having hyperlipidemia | P=0.09** | ||||
| Yes | 47 (19.1) | 29 (23.6) | 11 (16.9) | 6 (10.3) | |
| No | 199 (80.9) | 94 (76.4) | 54 (83.1) | 52 (89.7) | |
| Having hypertension | P=0.01** | ||||
| Yes | 53 (21.5) | 19 (15.4) | 22 (33.8) | 12 (20.7) | |
| No | 193 (81.3) | 104 (84.6) | 43 (66.2) | 46 (79.3) | |
| Having heart diseases | P=0.20** | ||||
| Yes | 90 (36.6) | 50 (40.7) | 18 (27.7) | 22 (37.9) | |
| No | 156 (63.4) | 73 (59.3) | 47 (72.3) | 36 (62.1) | |
| Having orthopedic problems | P=0.29** | ||||
| Yes | 8 (3.3) | 3 (2.4) | 4 (6.2) | 1 (1.7) | |
| No | 238 (96.7) | 120 (97.6) | 61 (93.8) | 57 (98.3) | |
| Having urinary incontinency | P=0.63** | ||||
| Yes | 20 (8.1) | 8 (6.5) | 6 (9.2) | 6 (10.3) | |
| No | 226 (91.9) | 115 (93.5) | 59 (90.8) | 52 (89.7) | |
| Having cancer | P=0.04** | ||||
| Yes | 4 (1.6) | 1 (0.8) | 0 (0.0) | 3 (5.2) | |
| No | 242 (98.4) | 122 (99.2) | 65 (100.0) | 55 (94.8) | |
ANOVA
Chi square
As Table 1 shows, less than 10% of the elderly participants reported comorbidities, such as orthopedic problems, urinary incontinency, and cancer. Diabetes and hyperlipidemia were reported in 18.7% and 19.1% of the participants, respectively. Moreover, 21.5% and 36.6% suffered from hypertension and heart diseases, respectively. The results revealed no significant differences among the three groups with respect to having different kinds of comorbidities (P>0.05) except for in hypertension and cancer. The number of participants who had hypertension and cancer were more in overweight and obese participants compared to normal weight subjects, specially hypertension (Table 1).
The participants’ mean±SD score of QOL was 46.14±12.01. The mean±SD of QOL and its dimensions are presented in Table 2. As seen in this Table, the mean±SD of QOL and its seven dimensions were significantly different among the three groups (P<0.05), and normal weight elderly population had a higher mean score of QOL and its seven dimensions compared to the overweight and obese participants.
Table2.
The quality of life and its dimensions, and Mini-Mental State Examination in the elderly participants based on their body mass index
| Variables | Total | Normal weight | Overweight | Obese | P value* |
|---|---|---|---|---|---|
| Mean±SD | Mean±SD | Mean±SD | Mean±SD | ||
| Total quality of life | 46.14±12.01 | 52.34±10.81 | 42.43±9.03 | 37.17±9.87 | <0.001 |
| Dimensions of quality of life | |||||
| Physical function scale | 8.03±3.10 | 9.01±3.07 | 7.24±2.71 | 6.84±2.94 | <0.001 |
| Self-care scale | 9.75±3.19 | 10.78±3.20 | 9.06±2.46 | 8.36±3.18 | <0.001 |
| Depression and anxiety scale | 5.34±2.52 | 6.39±2.56 | 4.15±2.29 | 4.48±1.59 | <0.001 |
| Cognitive function scale | 8.30±3.70 | 9.71±3.15 | 7.56±3.79 | 6.15±3.43 | <0.001 |
| Social functioning scale | 3.65±1.82 | 3.93±1.96 | 3.61±1.34 | 3.08±1.87 | 0.01 |
| Sexual functioning scale | 2.60±1.82 | 3.09±2.11 | 2.61±1.42 | 1.56±0.90 | <0.001 |
| Life satisfaction scale | 8.43±3.30 | 9.40±3.53 | 8.16±2.66 | 6.67±2.61 | <0.001 |
| Mini-Mental State Examination | 23.97±3.61 | 25.03±3.24 | 23.63±2.73 | 22.13±4.36 | <0.001 |
ANOVA
Indeed, the association between BMI and QOL was negatively significant (r=–0.52, P<0.001). The three groups’ mean scores of QOL and MMSE are presented in Table 2. According to Table 2, the three groups were significantly different concerning the mean score of QOL (P<0.001). The post-hoc multiple comparisons by LSD test showed a significant difference between the normal weight and overweight participants regarding the mean difference of QOL (P<0.001). A significant difference was also observed between the normal weight and obese participants regarding the mean difference of QOL (P<0.001) (Table 3).
Table3.
The association between the normal weight and overweight, and obese regarding the mean difference of QOL and cognitive function by the post-hoc multiple comparisons
| BMI | QOL | Cognitive function | |
|---|---|---|---|
| P value* | P value* | ||
| Normal weight | Overweigh | <0.001 | 0.008 |
| Obese | <0.001 | <0.001 | |
LSD test
The participants’ mean±SD score of MMSE was 23.97±3.61. The three groups’ mean scores of MMSE are presented in Table 2. In addition, 93 participants (37.8%) had cognitive impairment, while 153 of them (62.2%) had normal cognitive functions. In addition, the three groups were significantly different with regard to the mean score of cognitive function (P<0.001). Moreover, the association between cognitive function and BMI was negatively significant (r=–0.28, P<0.001). Furthermore, the post-hoc multiple comparisons by LSD test showed a significant difference between the normal weight and overweight participants regarding the mean difference of cognitive function (P=0.008). A significant difference was also observed between the normal weight and obese participants concerning the mean difference of cognitive function (P<0.001) (Table 3).
The results of stepwise regression analysis showed 29% of the changes in BMI were explained by QOL, cognitive function, and having hypertension, and cancer. Based on the results of regression analysis presented in Table 4, BMI was associated with QOL (t=-8.57, P<0.001), and cognitive function (t=-3.47, P=0.001). On the other hand, other variables including having hypertension, and cancer were not associated with BMI (P>0.05). So, 71% of the changes were explained by other variables that were not measured in the study.
Table4.
The association between BMI and QOL, cognitive function and having comorbidity such as hypertension, and cancer in the elderly population
| Model | Beta | t | P value | R | R2 |
|---|---|---|---|---|---|
| QOL | -0.19 | -8.57 | <0.001 | 0.54 | 0.29 |
| Cognitive function | -0.26 | -3.47 | 0.001 | ||
| Having hypertension | 0.09 | 1.78 | 0.07 | ||
| Having cancer | 0.04 | 0.82 | 0.41 |
DISCUSSION
This study evaluated the association between BMI and comorbidity, QOL, and cognitive function in elderly population. To the best of our knowledge, in this study the association between BMI and comorbidity, QOL, and cognitive function were assessed for the first time in one single study. Of course, the association of BMI and each of these variables was assessed in one study. 34
This study showed an association between BMI and QOL, cognitive function and some comorbidities such as having hypertension, and cancer. Moreover, the elderly population’s mean score of QOL was approximately half of the expected score, and roughly one third of the participants had cognitive impairment.
The present study results showed that overweight and obese participants had lower QOL compared to normal weight subjects. In addition, overweight and obese participants had lower physical function, self-care, depression and anxiety, cognitive function, social functioning, sexual functioning and life satisfaction scales of QOL compared to normal weight subjects. Additionally, BMI was negatively associated with QOL in the elderly population. Although researchers indicated that higher BMI was not associated to a lower quality of life in Korean elderly population, 18 researchers in Italy reported that older adults’ BMI had a negative impact on the physical subscales of QOL. 24 Another study also revealed that obesity was associated with QOL, especially in people aged over 64 years. 35 In fact, greater adiposity was associated with and predicted lower QOL in the elderly aged 70-90 years old. 36 Obesity might decrease the functional status and mobility 37 and, consequently, decline the elderly people’s QOL.
The results of the present study also demonstrated that overweight and obese elderly subjects had lower mean scores of cognitive function compared to the normal weight group. Moreover, BMI was negatively associated with cognitive function in the elderly population. Similarly, obese women had lower performance in attention test and were more impulsive compared to those with normal weight. 38 On the other hand, a study on the elderly population reported that overweight was associated with a reduced risk of cognitive impairment; however, abdominal obesity increased the risk of cognitive impairment. 21 It was maintained that more body fat was associated with more impairment in pattern recognition memory, and memory span length. Indeed, higher body fat negatively impacts a delayed response on the force choice recognition memory task, and visual pattern memory task. 34 Another study also showed that obesity/overweight status was associated with the lowest quartiles of cognitive impairment, verbal fluency, delayed free recall, immediate logical memory, and pre-morbid intelligence. 39 Increased risk of amnestic mild cognitive impairment was also showed to be associated with being overweight or obese. 40 Moreover, it was reported that obesity was one of the risk factors of adverse brain changes and cognitive impairment. 41 Obesity also led to poor performance in cognitive domains, such as global screening measures, memory, and verbal fluency. 20 Some mechanisms have been revealed to be responsible for the association between BMI and cognitive impairment. Obesity might lead to various brain pathological changes, such as cerebral circulation insufficiency, neuronal injury and dysfunction, and brain atrophy and inflammatory disorders. These changes might cause cognitive impairment. 40 , 42 Moreover, obesity might increase the thickness of the carotid intima-media, 43 , 44 and common carotid artery and hypertension. 43 These vascular problems might lead to cognitive impairment.
The results of the present study showed that BMI was associated with comorbidities such as hypertension and cancer. Researchers believed that obesity was associated with the risk factors of cardiovascular diseases such as diabetes mellitus, hypertension, dyslipidemia, cancers, sleep apnea, etc. 45 In other words, hazard related to hypertension raises at least 2-fold in obese persons. 46 Therefore, obesity increases the risk of morbidity and mortality. 47
The participants’ mean score of QOL was approximately half of the expected total score of QOL. Consistently, healthy Iranian elderly population reported low QOL. 48 In addition, 41.9% of the subjects lived by themselves, which might reduce their social interactions and communications. These issues as well as age-related psychological and behavioral features might reduce their scores of general health perceptions 48 and affect their QOL.
The current study findings indicated that roughly one third of the participants had cognitive impairment. In line with our study, in a study on the Iranian elderly population, the prevalence of cognitive weakness in different ages and education groups was reported as 30.1%. 49 Moreover, one-third of the elderly population in Shanghai, China also reported cognitive impairment. 50
Our study strength consists of the evaluation of the association between BMI and some factors including quality of life, cognitive function and comorbidities such as diabetes, hyperlipidemia, hypertension, heart diseases, orthopedic problems, urinary incontinency and cancer. Moreover, using stepwise regression analysis was another strength of this study to assess the association between BMI and some variables.
On the other hand, one of the limitations of this study was its cross-sectional design which set a limit to examining the causality effect of BMI on cognitive impairment and QOL.
As roughly half of the elderly subjects were overweight and obese, it is recommended that such people should be provided with clinical counselling focusing on diet, physical activities, and lifestyle modifications. Since BMI was associated with QOL and cognitive function in the elderly people, modification of lifestyle is suggested in order to prevent obesity or overweight. Further interventional studies focusing on innovative treatment strategies are recommended to improve QOL and cognitive function in obese or overweight elderly people.
CONCLUSION
The present study results showed that overweight and obesity affected approximately half of the elderly people. Besides, the mean score of QOL was approximately half of the expected total score of QOL. In addition, approximately one third of the elderly participants had cognitive impairment. The results also indicated that BMI was associated with QOL and cognitive function. This implies that overweight and obese older individuals had worse QOL and cognitive function in comparison to those with normal weight. Healthcare workers may use these findings to design prevention and treatment programs targeting the elderly population.
ACKNOWLEDGEMENT
This article was the result of a Master’s thesis of Ali Moradi, (Number: 1396-01-08-15118) approved by Shiraz University of Medical Sciences. This study was financially supported by Shiraz University of Medical Sciences. The researchers would like to thank Ms. A. Keivanshekouh at the Research Improvement Center of Shiraz University of Medical Sciences for improving the use of English in the manuscript. They would also like to appreciate the 246 participants for taking part in the study.
Conflict of Interest: None declared.
REFRENCES
- 1.Fabbri E, Zoli M, Gonzalez-Freire M, et al. Aging and Multimorbidity: New Tasks, Priorities, and Frontiers for Integrated Gerontological and Clinical Research. Journal of the American Medical Directors Association. 2015;16:640–7. doi: 10.1016/j.jamda.2015.03.013. [DOI] [PMC free article] [PubMed] [Google Scholar]
- 2.Strait JB, Lakatta EG. Aging-associated cardiovascular changes and their relationship to heart failure. Heart Failure Clinics. 2012;8:143–64. doi: 10.1016/j.hfc.2011.08.011. [DOI] [PMC free article] [PubMed] [Google Scholar]
- 3.Buford TW. Hypertension and aging. Ageing Research Reviews. 2016;26:96–111. doi: 10.1016/j.arr.2016.01.007. [DOI] [PMC free article] [PubMed] [Google Scholar]
- 4.Loeser RF. Age-related changes in the musculoskeletal system and the development of osteoarthritis. Clinics in Geriatric Medicine. 2010;26:371–86. doi: 10.1016/j.cger.2010.03.002. [DOI] [PMC free article] [PubMed] [Google Scholar]
- 5.Lee JK, Won MH, Son YJ. Combined Influence of Depression and Physical Frailty on Cognitive Impairment in Patients with Heart Failure. International Journal of Environmental Research and Public Health. 2018;16:E66. doi: 10.3390/ijerph16010066. [DOI] [PMC free article] [PubMed] [Google Scholar]
- 6.Murman DL. The Impact of Age on Cognition. Seminars in Hearing. 2015;36:111–21. doi: 10.1055/s-0035-1555115. [DOI] [PMC free article] [PubMed] [Google Scholar]
- 7.Silveira EAD, Vieira LL, Jardim TV, Souza JD. Obesity and its Association with Food Consumption, Diabetes Mellitus, and Acute Myocardial Infarction in the Elderly. Arquivos Brasileiros de Cardiologia. 2016;107:509–17. doi: 10.5935/abc.20160182. [DOI] [PMC free article] [PubMed] [Google Scholar]
- 8.Souza LG, Jardim TV, Rezende AC, et al. Predictors of overweight/obesity in a Brazilian cohort after 13 years of follow-up. Nutrition Journal. 2018;17:10. doi: 10.1186/s12937-018-0320-7. [DOI] [PMC free article] [PubMed] [Google Scholar]
- 9.Preston SH, Vierboom YC, Stokes A. The role of obesity in exceptionally slow US mortality improvement. Proceedings of the National Academy of Sciences of the United States of America. 2018;115:957–61. doi: 10.1073/pnas.1716802115. [DOI] [PMC free article] [PubMed] [Google Scholar]
- 10.Frasca D, Blomberg BB, Paganelli R. Aging, Obesity, and Inflammatory Age-Related Diseases. Frontiers in Immunology. 2017;8:1745. doi: 10.3389/fimmu.2017.01745. [DOI] [PMC free article] [PubMed] [Google Scholar]
- 11.Gu Z, Li D, He H, et al. Body mass index, waist circumference, and waist-to-height ratio for prediction of multiple metabolic risk factors in Chinese elderly population. Scientific Reports. 2018;8:385. doi: 10.1038/s41598-017-18854-1. [DOI] [PMC free article] [PubMed] [Google Scholar]
- 12.Csige I, Ujvarosy D, Szabo Z, et al. The Impact of Obesity on the Cardiovascular System. Journal of Diabetes Research. 2018;2018:3407306. doi: 10.1155/2018/3407306. [DOI] [PMC free article] [PubMed] [Google Scholar]
- 13.Chen Y, Yang Y, Jiang H, et al. Associations of BMI and Waist Circumference with All-Cause Mortality: A 22-Year Cohort Study. Obesity (Silver Spring) 2019;27:662–9. doi: 10.1002/oby.22423. [DOI] [PubMed] [Google Scholar]
- 14.Bottone FG Jr, Hawkins K, Musich S, et al. The relationship between body mass index and quality of life in community-living older adults living in the United States. The Journal of Nutrition, Health & Aging. 2013;17:495–501. doi: 10.1007/s12603-013-0022-y. [DOI] [PubMed] [Google Scholar]
- 15.Wang C, Chan JS, Ren L, Yan JH. Obesity Reduces Cognitive and Motor Functions across the Lifespan. Neural Plasticity. 2016;2016:2473081. doi: 10.1155/2016/2473081. [DOI] [PMC free article] [PubMed] [Google Scholar]
- 16.Nguyen JC, Killcross AS, Jenkins TA. Obesity and cognitive decline: role of inflammation and vascular changes. Frontiers in Neuroscience. 2014;8:375. doi: 10.3389/fnins.2014.00375. [DOI] [PMC free article] [PubMed] [Google Scholar]
- 17.Deckers K, Van Boxtel MPJ, Verhey FRJ, Kohler S. Obesity and Cognitive Decline in Adults: Effect of Methodological Choices and Confounding by Age in a Longitudinal Study. The Journal of Nutrition, Health & Aging. 2017;21:546–53. doi: 10.1007/s12603-016-0757-3. [DOI] [PubMed] [Google Scholar]
- 18.Lee G, Park J, Oh SW, et al. Association between Body Mass Index and Quality of Life in Elderly People over 60 Years of Age. Korean Journal of Family Medicine. 2017;38:181–91. doi: 10.4082/kjfm.2017.38.4.181. [DOI] [PMC free article] [PubMed] [Google Scholar]
- 19.Kim S, Kim Y, Park SM. Body Mass Index and Decline of Cognitive Function. PLoS One. 2016;11:e0148908. doi: 10.1371/journal.pone.0148908. [DOI] [PMC free article] [PubMed] [Google Scholar]
- 20.Gunstad J, Lhotsky A, Wendell CR, et al. Longitudinal examination of obesity and cognitive function: results from the Baltimore longitudinal study of aging. Neuroepidemiology. 2010;34:222–9. doi: 10.1159/000297742. [DOI] [PMC free article] [PubMed] [Google Scholar]
- 21.Hou Q, Guan Y, Yu W, et al. Associations between obesity and cognitive impairment in the Chinese elderly: an observational study. Clinical Interventions in Aging. 2019;14:367–73. doi: 10.2147/CIA.S192050. [DOI] [PMC free article] [PubMed] [Google Scholar]
- 22.Javed F, Aziz EF, Sabharwal MS, et al. Association of BMI and cardiovascular risk stratification in the elderly African-American females. Obesity (Silver Spring) 2011;19:1182–6. doi: 10.1038/oby.2010.307. [DOI] [PMC free article] [PubMed] [Google Scholar]
- 23.Bays HE, Chapman RH, Grandy S, SHIELD Investigators’ Group. The relationship of body mass index to diabetes mellitus, hypertension and dyslipidaemia: comparison of data from two national surveys. International Journal of Clinical Practice. 2007;61:737–47. doi: 10.1111/j.1742-1241.2007.01336.x. [DOI] [PMC free article] [PubMed] [Google Scholar]
- 24.Giuli C, Papa R, Bevilacqua R, et al. Correlates of perceived health related quality of life in obese, overweight and normal weight older adults: an observational study. BMC Public Health. 2014;14:35. doi: 10.1186/1471-2458-14-35. [DOI] [PMC free article] [PubMed] [Google Scholar]
- 25.Klatsky AL, Zhang J, Udaltsova N, Li Y, Tran HN. Body Mass Index and Mortality in a Very Large Cohort: Is It Really Healthier to Be Overweight? Perm J . 2017;21:16–142. doi: 10.7812/TPP/16-142. [DOI] [PMC free article] [PubMed] [Google Scholar]
- 26.De Leo D, Diekstra RF, Lonnqvist J, et al. LEIPAD, an internationally applicable instrument to assess quality of life in the elderly. Behavioral Medicine. 1998;24:17–27. doi: 10.1080/08964289809596377. [DOI] [PubMed] [Google Scholar]
- 27.Jalenques I, Auclair C, Roblin J, et al. Cross-cultural evaluation of the French version of the LEIPAD, a health-related quality of life instrument for use in the elderly living at home. Quality of Life Research. 2013;22:509–20. doi: 10.1007/s11136-012-0166-y. [DOI] [PubMed] [Google Scholar]
- 28.Bazrafshan MR, Hoseini MA, Rahgozar M, Madah BS. The Effect of Exercise in Elderly Women’s Quality of Life. Iranian Journal of Ageing. 2007;2:196–204. [In Persian] [Google Scholar]
- 29.Hesamzadeh A, Maddah SB, Mohammadi F, et al. Comparison of elderlys”quality of life” living at homes and in private or public nursing homes. Iranian Journal of Ageing. 2010;4:66–74. [In Persian] [Google Scholar]
- 30.Ghasemi H, Harirchi M, Masnavi A, et al. Comparing quality of life between seniors living in families and institutionalized in nursing homes in Isfahan. Social Welfare. 2011;39:177–200. [In Persian] [Google Scholar]
- 31.Folstein MF, Folstein SE, McHugh PR. “Mini-mental state». A practical method for grading the cognitive state of patients for the clinician. Journal of Psychiatric Research 1975;12:189–98. doi: 10.1016/0022-3956(75)90026-6. [DOI] [PubMed] [Google Scholar]
- 32.Folstein MF, Folstein SE, McHugh PR, Fanjiang G. Mini-Mental State Examination User’s Guide. Odessa (US) : Psychological Assessment Resources; 2001. [In Persian] [Google Scholar]
- 33.Seyedian M, Falah M, Nourouzian M, et al. Validity of the persian version of mini-mental state examination. Journal of Medical Council of IRI. 2008;25:408–14. [Google Scholar]
- 34.Farooq A, Gibson AM, J Reilly J, Gaoua N. The association between obesity and cognitive function in otherwise healthy premenopausal arab women. Journal of Obesity. 2018;2018:1741962. doi: 10.1155/2018/1741962. [DOI] [PMC free article] [PubMed] [Google Scholar]
- 35.Busutil R, Espallardo O, Torres A, et al. The impact of obesity on health-related quality of life in Spain. Health and Quality of Life Outcomes. 2017;15:197. doi: 10.1186/s12955-017-0773-y. [DOI] [PMC free article] [PubMed] [Google Scholar]
- 36.Wang L, Crawford JD, Reppermund S, et al. Body mass index and waist circumference predict health-related quality of life, but not satisfaction with life, in the elderly. Quality of Life Research. 2018;27:2653–65. doi: 10.1007/s11136-018-1904-6. [DOI] [PubMed] [Google Scholar]
- 37.Samper-Ternent R, Al Snih S. Obesity in Older Adults: Epidemiology and Implications for Disability and Disease. Reviews in Clinical Gerontology. 2012;22:10–34. doi: 10.1017/s0959259811000190. [DOI] [PMC free article] [PubMed] [Google Scholar]
- 38.Cook RL, O’Dwyer NJ, Donges CE, et al. Relationship between Obesity and Cognitive Function in Young Women: The Food, Mood and Mind Study. Journal of Obesity. 2017;2017:5923862. doi: 10.1155/2017/5923862. [DOI] [PMC free article] [PubMed] [Google Scholar]
- 39.Benito-Leon J, Mitchell AJ, Hernandez-Gallego J, Bermejo-Pareja F. Obesity and impaired cognitive functioning in the elderly: a population-based cross-sectional study (NEDICES) European Journal of Neurology. 2013;20:899–906. doi: 10.1111/ene.12083. [DOI] [PubMed] [Google Scholar]
- 40.Wang F, Zhao M, Han Z, et al. Association of body mass index with amnestic and non-amnestic mild cognitive impairment risk in elderly. BMC Psychiatry. 2017;17:334. doi: 10.1186/s12888-017-1493-x. [DOI] [PMC free article] [PubMed] [Google Scholar]
- 41.Alosco ML, Spitznagel MB, Gunstad J. Obesity as a risk factor for poor neurocognitive outcomes in older adults with heart failure. Heart Failure Reviews. 2014;19:403–11. doi: 10.1007/s10741-013-9399-2. [DOI] [PMC free article] [PubMed] [Google Scholar]
- 42.Gorelick PB, Scuteri A, Black SE, et al. Vascular contributions to cognitive impairment and dementia: a statement for healthcare professionals from the american heart association/american stroke association. Stroke. 2011;42:2672–713. doi: 10.1161/STR.0b013e3182299496. [DOI] [PMC free article] [PubMed] [Google Scholar]
- 43.Kozakova M, Palombo C, Morizzo C, et al. Obesity and carotid artery remodeling. Nutrition & Diabetes. 2015;5:e177. doi: 10.1038/nutd.2015.26. [DOI] [PMC free article] [PubMed] [Google Scholar]
- 44.Jin Y, Kim D, Cho J, et al. Association between Obesity and Carotid Intima-Media Thickness in Korean Office Workers: The Mediating Effect of Physical Activity. BioMed Research International. 2018;2018 doi: 10.1155/2018/4285038. [DOI] [PMC free article] [PubMed] [Google Scholar]
- 45.Artham SM, Lavie CJ, Milani RV, Ventura HO. Obesity and hypertension, heart failure, and coronary heart disease-risk factor, paradox, and recommendations for weight loss. The Ochsner Journal. 2009;9:124–32. [PMC free article] [PubMed] [Google Scholar]
- 46.Channanath AM, Farran B, Behbehani K, Thanaraj TA. Impact of hypertension on the association of BMI with risk and age at onset of type 2 diabetes mellitus: age- and gender-mediated modifications. PLoS One. 2014;9:e95308. doi: 10.1371/journal.pone.0095308. [DOI] [PMC free article] [PubMed] [Google Scholar]
- 47.Hruby A, Hu FB. The Epidemiology of Obesity: A Big Picture. Pharmacoeconomics. 2015;33:673–89. doi: 10.1007/s40273-014-0243-x. [DOI] [PMC free article] [PubMed] [Google Scholar]
- 48.Tourani S, Behzadifar M, Martini M, et al. Health-related quality of life among healthy elderly Iranians: a systematic review and meta-analysis of the literature. Health Qual Life Outcomes. 2018;16:18. doi: 10.1186/s12955-018-0845-7. [DOI] [PMC free article] [PubMed] [Google Scholar]
- 49.Gholamzadeh S, Heshmati B, Mani A, et al. The prevalence of alzheimer’s disease; its risk and protective factors among the elderly population in Iran. Shiraz E-Medical Journal. 2017;18:e57576. [Google Scholar]
- 50.Ren L, Zheng Y, Wu L, et al. Investigation of the prevalence of Cognitive Impairment and its risk factors within the elderly population in Shanghai, China. Scientific Reports. 2018;8:3575. doi: 10.1038/s41598-018-21983-w. [DOI] [PMC free article] [PubMed] [Google Scholar]