Abstract
Background
To explore important methylation‐driven genes (MDGs) and risk loci to construct risk model for prognosis of bladder cancer (BCa).
Methods
We utilized TCGA‐Assembler package to download 450K methylation data and corresponding transcriptome profiles. MethylMix package was used for identifying methylation‐driven genes and functional analysis was mainly performed based on ConsensusPathDB database. Then, Cox regression method was utilized to find prognostic MDGs, and we selected 17 hub genes via stepwise regression and multivariate Cox models. Kruskal‐Wallis test was implemented for comparisons between risk with other clinical variables. Moreover, we constructed the risk model and validated it in http://www.ncbi.nlm.nih.gov/geo/query/acc.cgi?acc=GSE13507. Gene set enrichment analysis was performed using the levels of risk score as the phenotype. Additionally, we further screened out the relative methylation sites associated with the 17 hub genes. Cox regression and Survival analysis were conducted to find the specifically prognostic sites.
Results
Two hundred and twenty‐eight MDGs were chosen by ConsensusPathDB database. Results revealed that most conspicuous pathways were transcriptional mis‐regulation pathways in cancer and EMT. After Cox regression analysis, 17 hub epigenetic MDGs were identified. We calculated the risk score and found satisfactory predictive efficiency by ROC curve (AUC = 0.762). In the validation group from http://www.ncbi.nlm.nih.gov/geo/query/acc.cgi?acc=GSE13507, 17 hub genes remained higher predictive value with AUC = 0.723 and patients in high‐risk group. Meanwhile, Kruskal‐Wallis test revealed that higher risk score correlated with a higher level of TNM stage, tumor grade, and advanced pathological stages. Then, identified 38 risk methylated loci that highly associated with prognosis. Last, gene set enrichment analysis revealed that high‐risk level of MDGs may correlate with several important pathways, including MAPK signaling pathway and so on.
Conclusion
Our study indicated several hub‐MDGs, calculated novel risk score and explored the prognostic value in BCa, which provided a promising approach to BCA prognosis assessment.
Keywords: bladder cancer (BCa), genome‐wide, methylation‐driven genes (MDGs), prognosis
Our study indicated 17 hub‐MDGs by genome‐wide screening from public databases, calculated novel risk score and explored the prognostic value in BCa, which provided a promising approach to BCA prognosis assessment.
1. INTRODUCTION
Bladder cancer (BCa) is the 2nd most common form of malignancy in urological system worldwide.1 In 2019, the estimated respective new cases and new death are 80 470 and 17 670 in the United States reported by the American Cancer Society.2 With incidence and mortality rates of 9.6 and 3.2 per 100 000, respectively, BCa is approximately four times common in males than in females.1 According to the extent of tumor invasion, about three‐quarters of BCa patients classified as nonmuscle‐invasive BCa (NMIBC) and the remainder had muscle‐invasive BCa (MIBC) when initial diagnosed.3 Despite the comprehensive treatments of surgical treatment, radiotherapy, chemotherapy, and immunotherapy, BCa is still a serious challenge due to high recurrence and mortality.4, 5
Apart from certain occupational chemical explosion, water pollution, and tobacco smoking, genetic material mutation is one of the main risk factors for BCa.6, 7, 8 However, the molecular regulation mechanism of BCa remains confused. Both DNA and histone methylation are an essential epigenetic regulation mechanism that has been studied intensively in recent decades.9, 10, 11, 12, 13 Tumor suppressor genes might be hypermethylated and ultimately silenced by abnormal methylation genes in CpG islands located in or near the genomic promoter region. It is noteworthy that DNA methylation shows the enormous difference between NMIBC and MIBC. For instance, in NMIBC hypomethylation in nonCpG islands is more common, while widespread promoter hypermethylation is identified more in MIBC.14, 15 This proves in some way that DNA methylation changes might lead to different clinical and pathological characteristics in BCa. However, the DNA methylation regulation effect and mechanism in BCa have not been fully elucidated.
Recently, the accelerated development of bioinformatics has been applied in malignant tumor research benefit from the improvement of high‐throughput sequencing technology, emergence of new statistical algorithms and the consummation function of public databases. The Cancer Genome Atlas (TCGA) database and Gene Expression Omnibus (GEO) database provide great convenience for systematic collection of clinical, pathological, and biological data from patients with malignancies.16, 17 In addition, Olivier Gevaert et al invented Methylmix, which is an original computational algorithm applied in correlation analysis between abnormality of DNA methylation and predict transcription.18 This provides a new technical means for researching DNA methylation in malignant tumors.
In this study, we filtrated methylation‐driven genes (MDGs) extracted from gene methylation profiling datasets and gene expression profiling datasets. Then the analyzed data of BCa patients from TCGA and GEO database were integrated in order to identify hub MDGs using biological algorithm. Finally, we combined selected MDGs with relative risk loci for predicting prognosis in BCa.
2. METHODS AND MATERIALS
2.1. Data acquisitions and integrative analysis
We obtained RNA‐seq data of transcriptome profiles of BCA from TCGA database (https://portal.gdc.cancer.gov/), including 414 tumor tissues and 10 normal tissues. We used edgeR package19 to normalize the raw data. Moreover, we utilized the tool of TCGA‐Assembler to download the DNA methylation data (419 BCA and corresponding 21 normal samples) based on the Illumina Infinium Human Methylation 450 platform, which detecting over 480 K human genome methylated sites. Limma package was applied to do the normalization.20 Level three methylation data were in form of β value, representing the ratio of the methylation probe data vs total probe intensities. Then, the average DNA methylation value for all CpG sites correlated with a gene was calculated and merged into a matrix with the function of TCGA‐Assembler. What is more, we subsequently extracted corresponding clinical features from 412 BCA patients via TCGA portal including age, gender, pathological stage, tumor grade, TNM stage, and survival data. Specific baseline characteristics of BCA patients are shown in Table 1 and Table S1.
Table 1.
Clinical characteristics of all eligible 570 BLCA patients from TCGA cohort and http://www.ncbi.nlm.nih.gov/geo/query/acc.cgi?acc=GSE13507
| Variables | Training group | validation group | Entire group |
|---|---|---|---|
| (n = 405) | (n = 165) | (n = 570) | |
| Status | |||
| Alive | 249 (61.5) | 96 (58.2) | 345 (56.7) |
| Dead | 156 (38.5) | 69 (41.8) | 225 (43.3) |
| Age | 68 ± 10.57 | 65.18 ± 11.97 | 67.19 ± 11.06 |
| Gender | |||
| Female | 106 (26.2) | 30 (18.2) | 136 (23.9) |
| Male | 299 (73.8) | 135 (81.8) | 434 (76.1) |
| Race | |||
| White | 334 (82.5) | NA | NA |
| Asian | 43 (10.6) | NA | NA |
| Black or African | 28 (6.9) | NA | NA |
| AJCC‐T | |||
| T0/Ta | 1 (0.2) | 24 (14.5) | 25 (4.4) |
| T1 | 3 (0.8) | 80 (48.5) | 83 (14.6) |
| T2 | 117 (28.9) | 31 (18.8) | 148 (25.9) |
| T3 | 193 (47.7) | 9 (5.5) | 212 (37.2) |
| T4 | 58 (14.3) | 11 (6.7) | 69 (12.1) |
| Unknown | 33 (8.1) | 0 (0.0) | 33 (5.8) |
| AJCC‐N | |||
| N0 | 235 (58.0) | 149 (90.3) | 384 (67.4) |
| N1 | 46 (11.4) | 8 (4.9) | 54 (9.5) |
| N2 | 75 (18.5) | 6 (3.6) | 81 (14.2) |
| N3 | 7 (1.7) | 1 (0.6) | 8 (1.4) |
| Unknown | 42 (10.4) | 1 (0.6) | 43 (7.5) |
| AJCC‐M | |||
| M0 | 195 (48.1) | 158 (95.8) | 353 (61.9) |
| M1 | 11 (2.7) | 7 (4.2) | 18 (3.2) |
| Mx | 199 (49.2) | NA | NA |
| Pathologic_stage | |||
| I & II | 130 (32.1) | NA | NA |
| III & IV | 273 (67.4) | NA | NA |
| Unknown | 2 (0.5) | NA | NA |
| Tumor_grade | |||
| G1/G2 | 20 (5.0) | 105 (63.6) | 125 (21.9) |
| G3/G4 | 382 ( 94.3) | 60 (36.4) | 442 (77.6) |
| Unknown | 3 (0.7) | NA | NA |
| MDGs risk score | |||
| Low | 203 (50.1) | 82 (50.0) | 285 (50.0) |
| High | 202 (49.9) | 83 (50.0) | 285 (50.0) |
MethylMix package was designed to deal with analysis of methylation data with RNA‐seq profiles, especially detecting methylation alterations that were associated with gene expression.18 We experienced three steps during the algorithm as following: firstly, methylation events that lead to alterations of gene expression were selected that only the genes passed the correlation cutoff value of correlation coefficients = −0.3 and adjust P value = .05. Second, the methylated state of one gene was defined across multiple samples using a β mixture model. Last, the comparison of methylation levels in BCA and corresponding normal samples was conducted using the Wilcoxon rank sum test (Figure 1).
Figure 1.
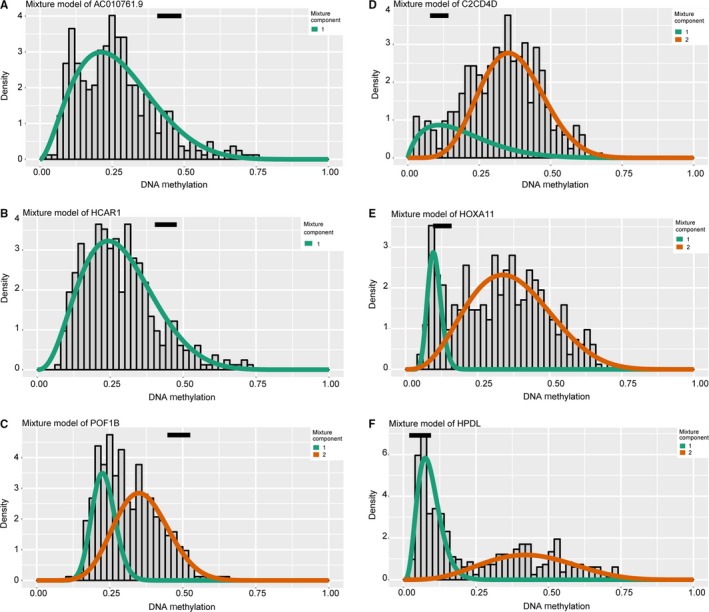
Illustration of the mixture model to screen MDGs via MethylMix package. Distribution of methylated status in tumor samples was shown by histogram, in which two lines represented the two components. The black line revealed the methylation data in normal tissues. A‐C, Top three hypermethylated signatures. D‐F, Identification of top three hypomethylated genes
2.2. Cluster analyses and enriched pathways of methylated drivers
Differentially expressed divers with methylated alterations were defined by MethylMix package and performed the cluster analysis between tumor vs normal tissues using pheatmap package. In addition, we applied the ConsensusPathDB database to further assess the potential enriched pathways using the imputed driven‐genes list. ConsensusPathDB was publicly comprehensive biological resources mainly integrating interaction networks and we selected Humancyc, Reactome, Kegg, Smpdb, Wikipathways, Signalink, and Biocarta for subsequent analysis with P value cutoff of .05.21
2.3. Construction and evaluation of epigenetic risk score based on MDGs
We conducted the univariate Cox regression analysis to select prognostic MDGs with P < .05 as the threshold. Stepwise regression analysis was performed to select 17 hub MDGs with the minimum Akaike information criterion (AIC) value. Meanwhile, we utilized the multivariate Cox method to obtain the β value of hub genes, which was the coefficient of each variable and represented the respective weight. Hazard ratio and 95% confidence interval (95% CI) were calculated and shown in forest plot by survminer package. Then, risk score based on the epigenetic MDGs could be calculated as the follows: Risk score = Ʃ (β i × Expi) (i = 17), where Exp represented the expression data of 17 hub genes. Based on this, 405 BCA patients from TCGA cohort can be divided into high‐ and low‐ risk groups using the median risk score as the cutoff. Importantly, we further used the receiver operating characteristic curve (ROC) to evaluate the predictive efficiency of MDGs with survivalROC package.22 Significant difference between high‐ and low‐ risk groups was assessed by Kaplan‐Merier analysis using survival package.
2.4. Association analyses between MDGs and clinical characteristics
Since BCA patients in high‐risk group revealed worse survival prognosis than that in low‐risk group, we invented to further investigated the potential associations between MDGs signature with traditional clinical characteristics. We downloaded and collated clinical variables from 405 patients in TCGA cohort with complete information consisted of AJCC‐TNM stage, tumor grade, as well as pathological stage, which was all independent clinical risk factors. We merged the risk score with other clinical variables with the same id numbers for subsequent analysis (Table S4). Kruskal‐Wallis (K‐W) test was utilized to assess the significant difference between level of risk score across multiple groups in respective clinical features with statistical cutoff of P < .05.
2.5. Validation of MDGs signature in an independent population
To evaluate the predictive power of 17 MDGs signatures, we obtained 165 BCA patients with corresponding expression data and clinical information in http://www.ncbi.nlm.nih.gov/geo/query/acc.cgi?acc=GSE13507 from GEO database (https://www.ncbi.nlm.nih.gov/geo/). We selected the same 17 hub genes and constructed the risk formula based on multivariate Cox model using survival package. Importantly, the cutoff was set as the same as the TCGA‐BLCA cohort and we classified the patients into low and high subgroups. The AUC of the ROC curve was calculated with survivalROC package for assessing the power of 17 MDGs signature in OS prediction and survival curve was drawn by a survival package.
2.6. Analysis of genes and methylated loci associated with OS
To further detect specific methylated sites in 17 hub MGDs, we extracted the all methylation data correlated with 17 MDGs in 440 files from TCGA using the Perl scripts. We merged the value of 207 methylated sites into one matrix and conducted univariate Cox analysis to select potential risk methylated loci (Table S3). Survival analysis was then performed to assess the difference between hypo‐ and hypermethylation state of specific sites (Figure S3). Additionally, a joint survival analysis was conducted to further evaluate key MDGs signature associated with prognosis in BCA patients, where we combined the methylation levels and expression data of one gene. The conjoint analysis was also performed by the survival package.
2.7. Gene set enrichment analysis (GSEA)
GSEA software was downloaded from the GSEA home (http://software.broadinstitute.org/gsea/index.jsp) and work based on JAVA 8 platforms (https://www.oracle.com/java/).23 We classified the 405 BCA patients into 202 high‐ and 203 low‐risk group, which was used as the phenotypes. Then, we selected the “c2.cp.kegg.v6.2.symbols.gmt gene sets” are obtained from the MSigDB (http://software.broadinstitute.org/gsea/downloads.jsp) as the reference gene sets. Furthermore, we defined the false discovery rate (FDR) < 0.25, |enriched score| >0.35, and gene size ≥35 as the cutoff criteria.
2.8. Statistical analyses
The Kruskal‐Wallis (K‐W) test was a nonparametric test and mainly conducted for three or more dataset. Besides, the Wilcoxon rank sum test was utilized to compare the methylation state in tumor vs normal tissues. Pearson correlation coefficients were calculated. The survival analysis was mainly based on the survival package. All statistical analysis was performed by R studio (version 3.5.3). A P value <.05 was considered to be of statistical significance.
3. RESULTS
3.1. Identification of methylated driven genes
Raw transcriptome data of 414 BCA with 10 normal samples were normalized via edgeR package, and we identified 8898 differentially expressed genes with cutoff of FDR <0.05. Meanwhile, we prepared and normalized the methylation profiles of 419 BCA with corresponding 21 normal samples through limma package. Then, the results from the MethylMix package revealed the correlations between methylation state with genes expression, mixture models, as well as the methylation difference between BCA and normal tissues across multiple samples. A total of 228 genes were defined as the epigenetic drivers with |logFC| > 0, |Cor| > 0.3, and P < .05 (Table S2). We showed the top hypo‐ and hypermethylation of drivers in Figure 1. We selected top 100 genes to show the difference of methylated level between tumor and normal tissues, which were illustrated in heatmap with pheatmap package in Figure 2.20
Figure 2.
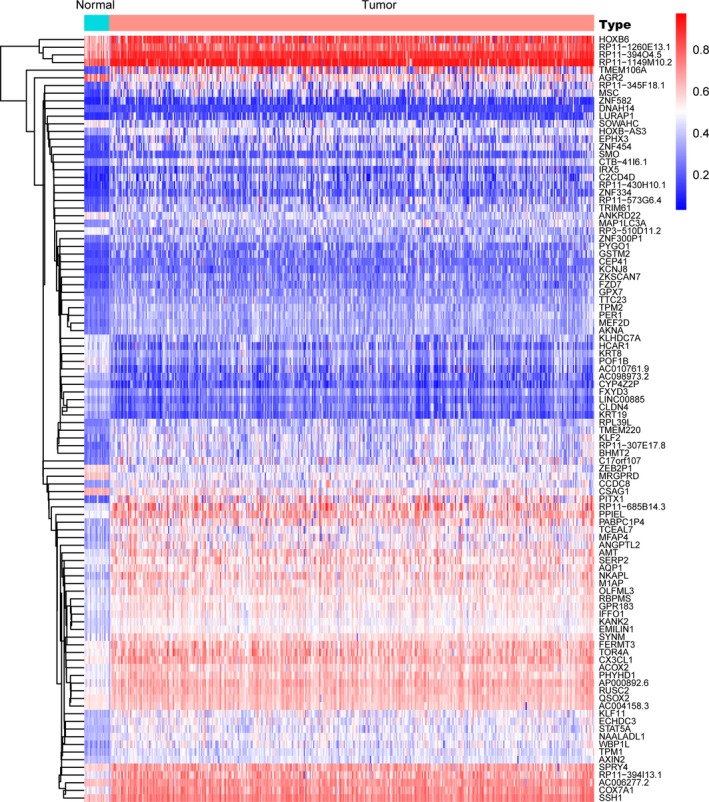
Heatmap of top 100 MDGs was drawn to reveal differential distribution of methylated state, where the colors of blue to red represented alterations from hypomethylation to hypermethhylation
3.2. Functional enriched pathways
Since we obtained 228 MDGs found to be statistically significant via MethylMix package, we intended to further explore the potential pathways that the divers might be involved in. We conducted the functional enriched analysis across multiple database in ConsensusPathDB and selected several significant biological pathways. The most conspicuous pathways were transcriptional misregulation pathways in cancer and epithelial to mesenchymal transition (EMT). In addition, there were other notable pathways including Wnt signaling crosstalk, glutathione metabolism, transcriptional cascade regulating pathway, as well as B‐cell receptor signaling pathways. We selected several vital pathways to exhibit in Figure 3, and the other top 40 pathways were shown in Table 2.
Figure 3.
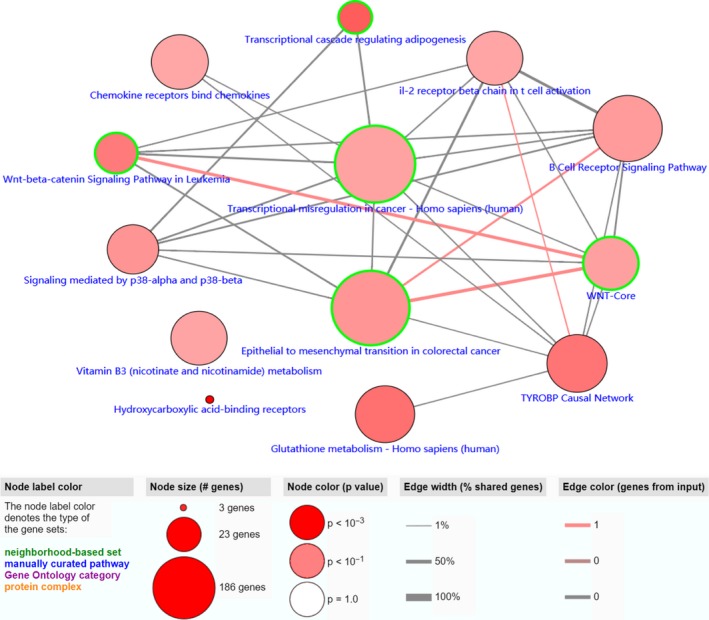
Functional pathway analysis for 228 MDGs based on ConsensusPathDB database. Transcriptional misregulation in cancer, the MAPK signaling pathway, the Wnt signaling pathway, cell cycle, as well as other cancer‐related pathways enriched significantly in our analysis
Table 2.
Functional analysis of MDGs based on ConsensusPathDB database
| Enriched pathway | P value | source |
|---|---|---|
| Signaling mediated by p38‐alpha and p38‐beta | .024851855 | PID |
| Wnt‐beta‐catenin Signaling Pathway in Leukemia | .01023165 | Wikipathways |
| WNT‐Core | .037948147 | Signalink |
| Glutathione metabolism | .00704807 | KEGG |
| Signaling events mediated by HDAC Class III | .030398536 | PID |
| B Cell Receptor Signaling Pathway | .031370148 | Wikipathways |
| Fas Ligand pathway and Stress induction of Heat Shock Proteins regulation | .036385809 | Wikipathways |
| Transcriptional cascade regulating adipogenesis | .003598992 | Wikipathways |
| Hydroxycarboxylic acid‐binding receptors | .000144888 | Reactome |
| Transcriptional misregulation in cancer | .040866181 | KEGG |
| Chemokine receptors bind chemokines | .047839785 | Reactome |
| FTO Obesity Variant Mechanism | .001321732 | Wikipathways |
| White fat cell differentiation | .001423078 | Wikipathways |
| Epithelial to mesenchymal transition in colorectal cancer | .025906124 | Wikipathways |
| TYROBP Causal Network | .008528042 | Wikipathways |
| Bopindolol Action Pathway | .008924337 | SMPDB |
| Timolol Action Pathway | .008924337 | SMPDB |
| Carteolol Action Pathway | .008924337 | SMPDB |
| Bevantolol Action Pathway | .008924337 | SMPDB |
| Practolol Action Pathway | .008924337 | SMPDB |
| Dobutamine Action Pathway | .008924337 | SMPDB |
| Isoprenaline Action Pathway | .008924337 | SMPDB |
| Arbutamine Action Pathway | .008924337 | SMPDB |
| Levobunolol Action Pathway | .008924337 | SMPDB |
| Metipranolol Action Pathway | .008924337 | SMPDB |
| Sotalol Action Pathway | .008924337 | SMPDB |
| Epinephrine Action Pathway | .008924337 | SMPDB |
| Betaxolol Action Pathway | .008924337 | SMPDB |
| Atenolol Action Pathway | .008924337 | SMPDB |
| Alprenolol Action Pathway | .008924337 | SMPDB |
| Acebutolol Action Pathway | .008924337 | SMPDB |
| Propranolol Action Pathway | .008924337 | SMPDB |
| Pindolol Action Pathway | .008924337 | SMPDB |
| Penbutolol Action Pathway | .008924337 | SMPDB |
| Oxprenolol Action Pathway | .008924337 | SMPDB |
| Metoprolol Action Pathway | .008924337 | SMPDB |
| Esmolol Action Pathway | .008924337 | SMPDB |
| Bisoprolol Action Pathway | .008924337 | SMPDB |
| Bupranolol Action Pathway | .008924337 | SMPDB |
| Nebivolol Action Pathway | .008924337 | SMPDB |
3.3. Construction and validation of risk scores based on MDGs signatures
We utilized the univariate Cox regression analysis to identify 64 genes associated with survival outcomes with P < .05 (Table S5). Then, the stepwise regression model was performed to select a robust signature that was the most frequent combinations, where 17 epigenetic divers were screened out. We showed the hazard ratio with 95% CI for each hub MDGs based on the multivariate Cox regression results in a forest plot (Figure 4). Therefore, a methylation‐based signature was established with the 17 hub MDGs. Meanwhile, the association analysis revealed that the methylation state all correlated negatively with the expression level of genes from the Pearson correlation coefficients in Figure S1. To further assess the predictive value of methylation signature in OS prediction, we calculated the risk score as following: risk score = (−0.46463)*AKNA + 0.21378*BHMT2 + 0.23461*CMTM3 + 0.17359*CPNE8 + (−0.08307)*CSAG1 + (−0.12821)*DAPP1 + (−0.10515)*EHF + (−0.09579)*KRT8 + 0.12370*MFAP4 + 0.14159*NRSN2 + (−0.07314)*PYGO1 + 0.21693*RCOR2 + 0.13725*S100A16 + 0.09522*SMO + 0.23525*TPM1 + (−0.46111)*TPM2 + (−0.32630)*ZKSCAN7. Then, we obtained the respective risk score and divided the 405 BCA into high‐risk group (n = 202) and low‐risk group (n = 203). The distribution of methylation‐based risk score and vital status of BCA patients in two groups was shown in Figure 5A,B. Moreover, the expression level of 17 genes in two groups was exhibited in heatmap (Figure 5C). The AUC of the ROC curve was 0.762 which indicating the satisfactory predictive efficiency of the risk signature (Figure 5D). The patients in high‐risk group revealed the wore prognosis in OS compared with that in low‐risk group from the Kaplan‐Merier plot with P < .0001 in Figure 5E.
Figure 4.
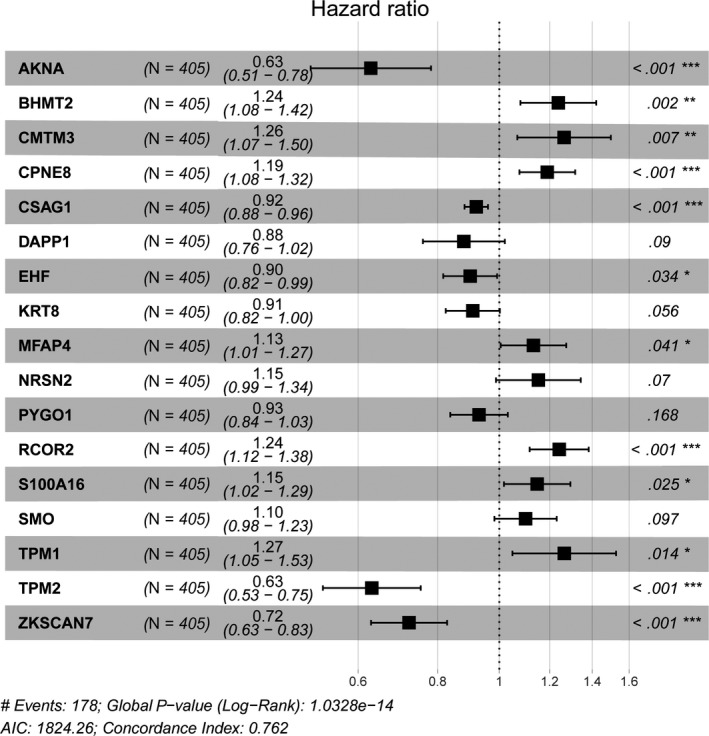
Forest plot of 17 hub MDGs in TCGA cohort. The Concordance Index and the Minimum of AIC were shown at the left bottom of the picture
Figure 5.
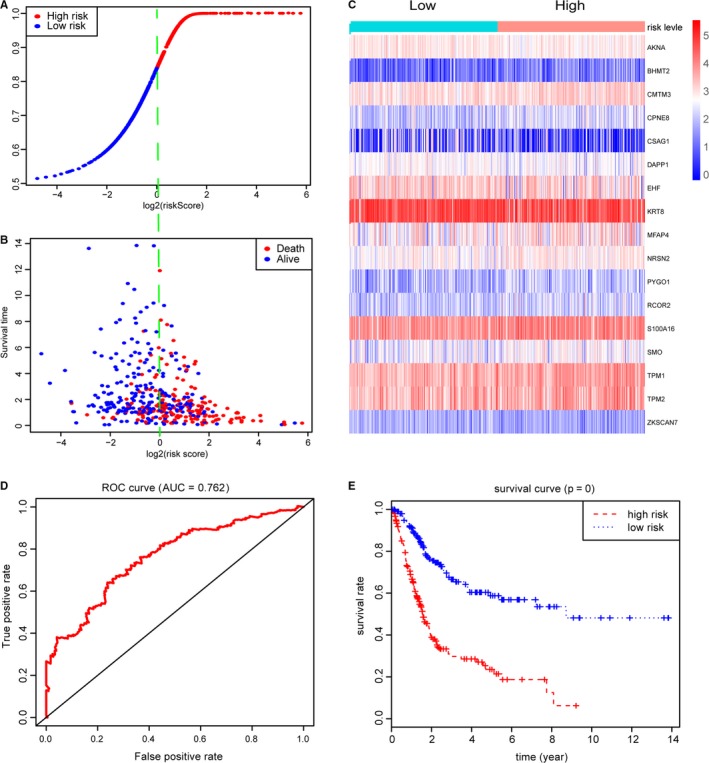
Construction of risk scores based on 17 hub MDGs. A‐B, Distribution of vital status of 405 BCA patients in high‐ and low‐risk groups. C, Heatmap of expression levels for hub MDGs in patients with high‐ and low‐risk score levels. D, ROC curve for 3‐year prediction was utilized for assessing the prognostic values of risk score with AUC = 0.762. E, Bca patients in high‐risk group revealed worse survival outcomes than that in low‐risk groups
Besides, we obtained the expression profiles with corresponding clinical information of 165 BCA patients from http://www.ncbi.nlm.nih.gov/geo/query/acc.cgi?acc=GSE13507 as an independent external validation. Using the same genes identified from the TCGA cohort, the 17‐MDGs based signature successfully stratified the 165 BCA patients into low‐ (n = 82) and high‐risk group (n = 83). Furthermore, the ROC curve was conducted and the AUC was 0.723. The log‐rank test showed the significant difference of OS in high‐ and low‐risk groups with P = 8e‐05, in accordance with the results from TCGA cohort (Figure 6A,B). We calculated and merged the risk score with other clinical variables in Table S4.
Figure 6.
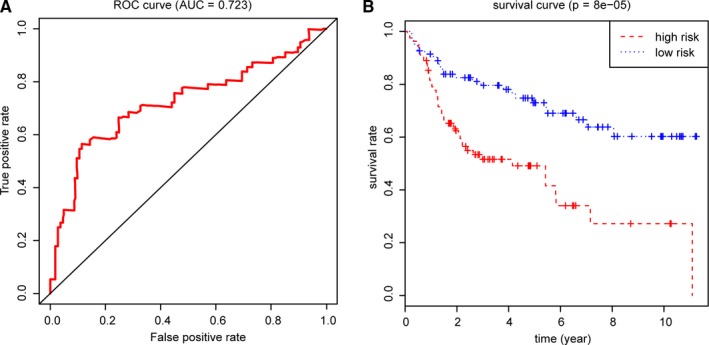
Validation of 17 hub MDGs in http://www.ncbi.nlm.nih.gov/geo/query/acc.cgi?acc=GSE13507. A, The 17‐MDGs based signature remained predictive accuracy of the ROC plot (AUC = 0.723). B, Patients in high‐risk group in http://www.ncbi.nlm.nih.gov/geo/query/acc.cgi?acc=GSE13507 stilled showed poor survival probabilities
3.4. Correlation of methylation‐based signature with clinical characteristics
With the result of risk score found to be statistically significant with the OS for BCA patients, we further invented to explore the potential relationships of risk score and other independent clinical risk features. The Kruskal‐Wallis test showed that higher risk score correlated with a higher level of TNM stage, high tumor grade, as well as advanced pathological stage (Stage III and IV). The specific statistical difference in distribution of risk score across multiple groups of clinical variables was shown in Figure S2A‐E.
3.5. Screening of risk methylation loci with survival analysis, joint survival analysis
Since we identified 17 hub MDGs associated highly with survival prognosis of BCA, we wanted to detect the significant methylation loci harboring these risk methylation genes. We extracted the β value of methylation data according to the 17 gene names from the 440 files in Table S3. A list of 207 methylation sites were screened out and the univariate Cox analysis revealed that 38 key methylation loci were associated with survival outcomes in Table 3 (P < .05). Meanwhile, we conducted the Kaplan‐Merier analysis and chose the plots of top 12 methylated sites in Figure S3. Additionally, a joint survival analysis found that combination of the methylation state and expression level of the 17 hub MDGs signature also correlated tightly with survival outcomes in 405 BCA patients (Figure 7).
Table 3.
Screening of 38 prognostic risk loci associated with hub MDGs in Bca
| Risk methtylated locus | Related genes | Hazard ratio | z | P value |
|---|---|---|---|---|
| cg18414381 | EHF | 3.9737182 | 3.347493733 | .000815458 |
| cg05503887 | EHF | 3.296494314 | 3.334039828 | .000855944 |
| cg00543460 | TPM1 | 0.313566503 | −3.040593266 | .002361126 |
| cg11065015 | NRSN2 | 0.171047292 | −3.031903254 | .002430171 |
| cg13836318 | TPM1 | 0.000319606 | −3.014958919 | .002570141 |
| cg24504361 | KRT8 | 6.742218982 | 2.907971041 | .00363782 |
| cg14506696 | DAPP1 | 3.366923308 | 2.895197969 | .003789195 |
| cg21614638 | DAPP1 | 2.982090283 | 2.81620796 | .00485942 |
| cg24097814 | KRT8 | 3.116236706 | 2.791702503 | .005243154 |
| cg08198488 | TPM1 | 0.293122612 | −2.782702312 | .005390824 |
| cg10397389 | DAPP1 | 2.804089164 | 2.770618241 | .005594998 |
| cg01902605 | BHMT2 | 0.156581583 | −2.672356579 | .007532056 |
| cg12494355 | TPM2 | 0.095012775 | −2.660337122 | .007806247 |
| cg10843343 | KRT8 | 5.522987956 | 2.648437613 | .008086477 |
| cg22235258 | EHF | 2.970907821 | 2.633435641 | .008452585 |
| cg00520135 | TPM1 | 0.199663869 | −2.632332676 | .008480078 |
| cg19460095 | EHF | 2.88706523 | 2.62182459 | .008746043 |
| cg17147440 | TPM1 | 0.38112838 | −2.608256727 | .009100467 |
| cg26357344 | KRT8 | 2.626134721 | 2.58341772 | .00978268 |
| cg13107144 | TPM1 | 0.080325594 | −2.567638984 | .010239373 |
| cg06398236 | DAPP1 | 3.783262029 | 2.507009355 | .012175749 |
| cg06997997 | MFAP4 | 0.058274726 | −2.502867154 | .012319178 |
| cg03790745 | RCOR2 | 0.002665687 | −2.480754698 | .013110456 |
| cg07814567 | DAPP1 | 2.30196051 | 2.478978727 | .013175916 |
| cg10403394 | TPM1 | 0.231823345 | −2.390524206 | .01682434 |
| cg21083175 | RCOR2 | 0.188494833 | −2.368506257 | .017860078 |
| cg03400060 | BHMT2 | 0.228984691 | −2.360536791 | .018248508 |
| cg14260530 | AKNA | 0.162252883 | −2.333684214 | .019612263 |
| cg18560551 | EHF | 2.009472208 | 2.329803583 | .019816535 |
| cg21867345 | ZKSCAN7 | 2.078224581 | 2.182145936 | .029098764 |
| cg13969788 | TPM2 | 0.400926556 | −2.158779228 | .030867299 |
| cg14022090 | EHF | 2.242798579 | 2.148000039 | .031713752 |
| cg08162426 | CPNE8 | 2.345731899 | 2.132073638 | .033000793 |
| cg22619810 | RCOR2 | 0.015622716 | −2.130825555 | .033103516 |
| cg20324165 | KRT8 | 2.762704434 | 2.109031651 | .03494185 |
| cg13999433 | AKNA | 0.137520251 | −2.017220181 | .043672541 |
| cg02619205 | AKNA | 0.36559657 | −1.976424603 | .048106707 |
| cg01835489 | KRT8 | 2.264564818 | 1.964142113 | .049513614 |
Figure 7.
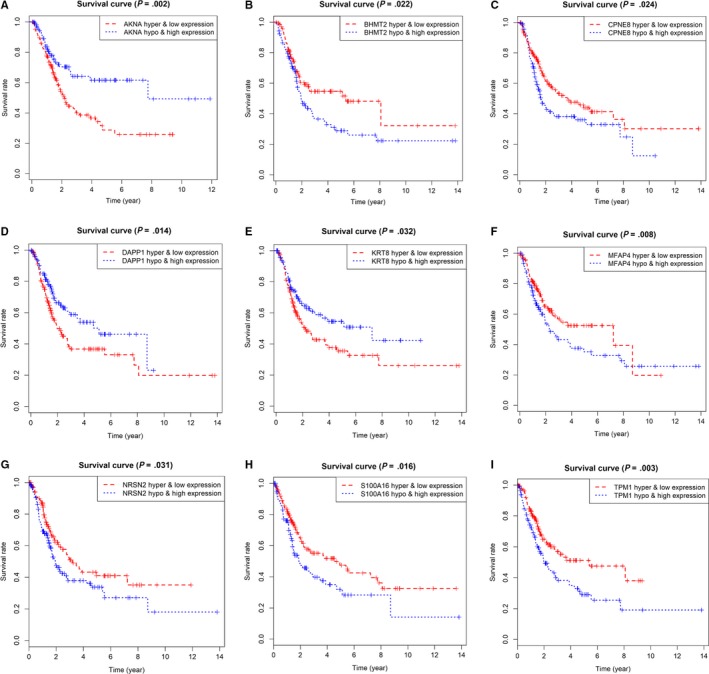
Joint survival analysis combined with methylation state and expression profiles for top 9 genes
3.6. Enrichment of cancer‐related pathways associated with MDGs signature
The GSEA was exploited to investigate potential biological pathways that the 17‐methyalted drivers might be involved in, and we found a total of 79 items were enriched significantly with FDR < 0.25. The level of MDGs signature‐based risk score was defined as the phenotypes, and the result suggested that high‐risk level of MGDs may correlated highly with several important crosstalk, consisting of MAPK signaling pathway, Wnt signaling pathway, cell cycle, as well as other cancer‐related pathways (Figure 8).
Figure 8.
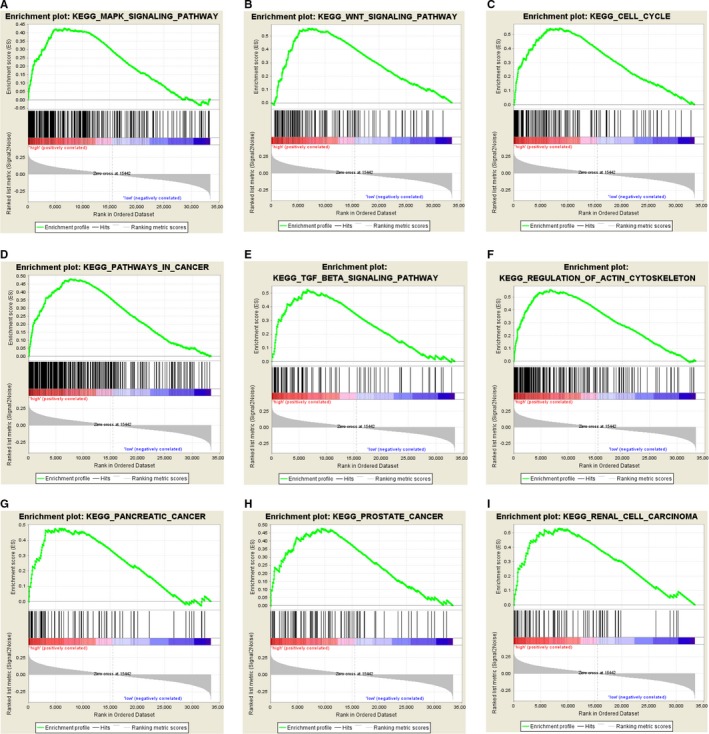
Gene set enrichment analysis for identification of the underlying pathways using risk score as the phenotype. A‐I, GSEA results revealed the top 9 MDGs‐related pathways, including MAPK signaling pathway, the Wnt signaling pathway, cell cycle, as well as other cancer‐related pathways
4. DISCUSSION
Epigenetics, which focus on the features and modification of the genome, contains cytosine modifications of DNA, post‐translational modifications of histones, nucleosome positioning and interactions of spatial conformation between genomic regions and accessible genomic loci.24, 25 As a crucial part of epigenetic regulation, DNA methylation was reported to participate in malignant progression.26, 27 In BCa, Ahlén Bergman et al reported that high methylation level at the IFNG −4229 bp locus was associated with more advanced post‐cystectomy tumor stages, which might lead to a worse prognosis.28 Methylation also participated in the regulation of tumor suppressor mechanisms. For instance, methylation status of CpG islands was observed in the regulation of miR‐1‐3p expression, causing inhibition of the BCa cell proliferation, migration, and invasion.29 Although there are increasing studies concerning the methylation in BCa, limited research has explored the prognosis value on the genome‐wide screening of MDGs.
In this study, we analyzed the raw transcriptome data and screened out 228 MDGs. Then the ConsensusPathDB database was used for the analysis of biological functions of MDGs. The results revealed that most conspicuous pathways were transcriptional mis‐regulation pathways in cancer and EMT. After univariate Cox regression analysis and the establishment of the stepwise regression model, 17 epigenetic hub‐MDGs were identified. Furthermore, we calculated the risk score and assessed the predictive value of methylation signature in OS prediction, and found the satisfactory predictive efficiency of the risk signature by ROC. To further verificate the results above, we extracted high‐throughput sequencing data from the GEO database. The Kruskal‐Wallis test showed that higher risk score correlated with a higher level of TNM stage, high tumor grade, as well as advanced pathological stage. After screening of risk methylation loci with survival analysis and joint survival analysis, we examined enrichment of cancer‐related pathways associated with MDGs signature. The results above suggested that high‐risk level of MGDs may be correlated highly with several important crosstalk, consisting of the MAPK signaling pathway, the Wnt signaling pathway, cell cycle, as well as other cancer‐related pathways.
Keratins 8 (KRT8) is a key participation factor of keratinization, which exists abnormal performance in basal cell tumors. As representative of simple columnar epithelia, KRT8 is integral to epithelial differentiation.30 It is worth noting that abnormal epithelial‐mesenchymal transition is an important part of the malignant progression.31 Study has revealed that the high expression of KRT8 in gastric cancer is related to the upregulation of EMT pathway and might promote the tumor progression and metastasis.32 However, limited evidence has presented regulation mechanism of KRT8 and EMT signaling pathway in BCa. In our study, we identified KRT8 as a hub‐MDG, which might influence the BCa progression through EMT pathway analyzed by ConsensusPathDB database.
S100A16 belongs to S100 family, which is a superfamily of calcium‐binding proteins. S100A16, combining with S100A1‐S100A14 and S100A7, encodes in two tandem clusters on chromosome 1q21, which plays a powerful role in epidermal differentiation complex (EDC).33 As a novel detected S100 family member, S100A16 was observed over‐expressed in many malignancies.34 Nariaki et al demonstrated that S100A16 might increase the expression level of Oct4 and Nanog in cancer stem‐like cells in Yumoto human cervical carcinoma cells.35 According to our findings, S100A16 is highly expressed in bladder cancer, consistent with previous studies above.
TPM1 and TPM2 are both members of tropomyosin (TPM) family, which discovered as a category of actin binding proteins acting as inhibitors of cellular transformation.36 Previous research reported that overexpression of TPM1 was related to a larger tumor size and a higher tumor grade, and TPM1 was proved as a potential biomarker of renal cell carcinoma prognosis.37 Unlike TPM1, poorly TPM2 were identified associated with malignant progression prostate tumors.38 As filtrated MDGs, whether TPM1 and TPM2 interact in the malignant progression of bladder cancer remains further study.
To further explore the regulation of MDGs in bladder cancer, functional pathway analysis was performed and indicated that the 17 MDGs signatures were mainly associated with MAPK, Wnt and cell cycle signaling pathway, which is unique to our study. Studies indicated that methylation in malignant tumors might exert further regulatory functions through the above signaling pathways. In gastric cancer, SPG20 might be suppressed by methylation and result in activation of cell proliferation by upregulated the EGFR/MAPK pathway.39 Xiang et al demonstrated that zinc‐finger protein 545 is silenced by promoter methylation and acted as an inhibiting factor in colorectal cancer through the Wnt/β‐catenin, PI3K/AKT and MAPK/ERK signaling pathways.40 In colorectal cancer, it was also found that aberrant DNA methylation of WNT pathway genes might regulate tumor progression.41 In BCa, this study initially screened the signaling pathways associated with MDGs. Nevertheless, the specific mechanisms of action and regulation of these signaling pathways and methylation need to be further studied.
Finally, the risk model calculated based on 17 MDGs signatures has certain accuracy in assessing the prognosis of BCa patients, which is unique in our study. The AUC of ROC curve revealed the satisfactory predictive efficiency of the risk signature. What's more, Kruskal‐Wallis test showed that risk score had positive correlation with TNM stage, tumor grade and pathological stage (Stage III and IV), which functioned reasonably from clinical perspective and indicated its potential practical significance for BCa diagnosis and prognosis prediction.
Risk scores were calculated based on hub genes for evaluating the prognostic value, which was an advantage of our research. The AUC of the ROC based on risk score was 0.762 in our study. In previous studies, Zeng et al42 developed a novel nomogram with readily available clinicopathological information including grade, stage, age, lymph node, location, and histology for predicting cancer‐specific survival of upper tract urothelial carcinomas. However, the AUC of ROC was 0.74. In addition, Yin et al43 developed a nomogram based on 21‐miRNA signature. The AUC of ROC was only 0.663. The above results indicated that the risk score calculated based on the hub genes identified in our study might have a well‐prognostic value.
Despite the remarkable sense, it is inevitable that limitations also existed in our research. First, no clinical samples but only screening and verification were performed to extract target data through biological algorithm approaches. Secondly, data sources of BCa patients and validation are based on TCGA database and GEO database, which might result in selection bias due to ignorance of clinical and pathological data from BCa patients in other databases or clinical centers. Finally, these 17 hub‐MDGs should be further studied and validated to expound its specific regulatory function and mechanisms in BCa.
5. CONCLUSION
Our study indicated 17 hub‐MDGs by genome‐wide screening from public databases, calculated novel risk score and explored the prognostic value in BCa, which provided a promising approach to BCA prognosis assessment.
CONFLICT OF INTEREST
The authors declare that the research was conducted in the absence of any commercial or financial relationships that could be construed as a potential conflict of interest.
AUTHOR CONTRIBUTIONS
Jun Luo and Chuanjie Zhang designed the study and analyzed the data; Kangjie Shen and Chuanjie Zhang drafted the article; Yuxiao Zheng and Feng Qi was responsible for language correction. All authors finally approved the paper.
Supporting information
ACKNOWLEDGMENTS
None.
Zhang C, Shen K, Zheng Y, Qi F, Luo J. Genome‐wide screening of abberant methylated drivers combined with relative risk loci in bladder cancer. Cancer Med. 2020;9:768–782. 10.1002/cam4.2665
Chuanjie Zhang, Kangjie Shen and Yuxiao Zheng contributed equally to this article.
Funding information
This work was supported by grants from the Training Program of Outstanding Young Talents in Clinical Medicine by Hongkou District (No. HKYQ2018‐09) and Shanghai Fourth People's Hospital Discipline Boosting Plan (No. SY‐XKZT‐2019‐1010)
REFERENCES
- 1. Bray F, Ferlay J, Soerjomataram I, Siegel RL, Torre LA, Jemal A. Global cancer statistics 2018: GLOBOCAN estimates of incidence and mortality worldwide for 36 cancers in 185 countries. CA Cancer J Clin. 2018;68(6):394‐424. [DOI] [PubMed] [Google Scholar]
- 2. Siegel RL, Miller KD, Jemal A. Cancer statistics, 2019. CA Cancer J Clin. 2019;69(1):7‐34. [DOI] [PubMed] [Google Scholar]
- 3. Burger M, Catto JW, Dalbagni G, et al. Epidemiology and risk factors of urothelial bladder cancer. Eur Urol. 2013;63(2):234‐241. [DOI] [PubMed] [Google Scholar]
- 4. Davaro F, Schaefer J, May A, Raza J, Siddiqui S, Hamilton Z. Invasive non‐urachal adenocarcinoma of the bladder: analysis of the National Cancer Database. World J Urol. 2019;37(3):497‐505. [DOI] [PubMed] [Google Scholar]
- 5. Sanli O, Dobruch J, Knowles MA, et al. Bladder cancer. Nat Rev Dis Primers. 2017;3:17022. [DOI] [PubMed] [Google Scholar]
- 6. Baris D, Waddell R, Beane Freeman LE, et al. Elevated bladder cancer in Northern New England: the role of drinking water and arsenic. J Natl Cancer Inst. 2016;108(9). [DOI] [PMC free article] [PubMed] [Google Scholar]
- 7. Jin F, Thaiparambil J, Donepudi SR, et al. Tobacco‐specific carcinogens induce hypermethylation, DNA adducts, and DNA damage in bladder cancer. Cancer Prev Res (Phila). 2017;10(10):588‐597. [DOI] [PMC free article] [PubMed] [Google Scholar] [Retracted]
- 8. Al‐Zalabani AH, Stewart KF, Wesselius A, Schols AM, Zeegers MP. Modifiable risk factors for the prevention of bladder cancer: a systematic review of meta‐analyses. Eur J Epidemiol. 2016;31(9):811‐851. [DOI] [PMC free article] [PubMed] [Google Scholar]
- 9. Koch A, Joosten SC, Feng Z, et al. Analysis of DNA methylation in cancer: location revisited. Nat Rev Clin Oncol. 2018;15(7):459‐466. [DOI] [PubMed] [Google Scholar]
- 10. Kettunen E, Hernandez‐Vargas H. Asbestos‐associated genome‐wide DNA methylation changes in lung cancer. Int J Cancer. 2017;141(10):2014‐2029. [DOI] [PubMed] [Google Scholar]
- 11. Yuan SX, Zhang J, Xu QG, Yang Y, Zhou WP. Long noncoding RNA, the methylation of genomic elements and their emerging crosstalk in hepatocellular carcinoma. Cancer Lett. 2016;379(2):239‐244. [DOI] [PubMed] [Google Scholar]
- 12. Deckers IA, van Engeland M, van den Brandt PA, et al. Promoter CpG island methylation in ion transport mechanisms and associated dietary intakes jointly influence the risk of clear‐cell renal cell cancer. Int J Epidemiol. 2017;46(2):622‐631. [DOI] [PubMed] [Google Scholar]
- 13. Schneider AC, Heukamp LC, Rogenhofer S, et al. Global histone H4K20 trimethylation predicts cancer‐specific survival in patients with muscle‐invasive bladder cancer. BJU Int. 2011;108(8 Pt 2):E290‐E296. [DOI] [PubMed] [Google Scholar]
- 14. Reinert T, Modin C, Castano FM, et al. Comprehensive genome methylation analysis in bladder cancer: identification and validation of novel methylated genes and application of these as urinary tumor markers. Clin Cancer Res. 2011;17(17):5582‐5592. [DOI] [PubMed] [Google Scholar]
- 15. Wolff EM, Chihara Y, Pan F, et al. Unique DNA methylation patterns distinguish noninvasive and invasive urothelial cancers and establish an epigenetic field defect in premalignant tissue. Can Res. 2010;70(20):8169‐8178. [DOI] [PMC free article] [PubMed] [Google Scholar]
- 16. Tomczak K, Czerwinska P, Wiznerowicz M. The cancer genome atlas (TCGA): an immeasurable source of knowledge. Contemp Oncol (Pozn). 2015;19(1A):A68‐A77. [DOI] [PMC free article] [PubMed] [Google Scholar]
- 17. Coordinators NR. Database resources of the National Center for Biotechnology Information. Nucleic Acids Res. 2016;44(D1):D7‐D19. [DOI] [PMC free article] [PubMed] [Google Scholar]
- 18. Gevaert O, Tibshirani R, Plevritis SK. Pancancer analysis of DNA methylation‐driven genes using MethylMix. Genome Biol. 2015;16:17. [DOI] [PMC free article] [PubMed] [Google Scholar]
- 19. Robinson MD, McCarthy DJ, Smyth GK. edgeR: a bioconductor package for differential expression analysis of digital gene expression data. Bioinformatics. 2010;26(1):139‐140. [DOI] [PMC free article] [PubMed] [Google Scholar]
- 20. Smyth GK. limma: linear models for microarray data. Bioinformatics & Computational Biology Solutions Using R & Bioconductor. 2011;397‐420. [Google Scholar]
- 21. Kamburov A, Stelzl U, Lehrach H, Herwig R. The ConsensusPathDB interaction database: 2013 update. Nucleic Acids Res. 2013;41(D1):D793‐D800. [DOI] [PMC free article] [PubMed] [Google Scholar]
- 22. Heagerty PJ, Lumley T, Pepe MS. Time‐dependent ROC curves for censored survival data and a diagnostic marker. Biometrics. 2000;56(2):337‐344. [DOI] [PubMed] [Google Scholar]
- 23. Tilford CA, Siemers NO. Gene set enrichment analysis. Methods Mol Biol. 2009;563:99‐121. [DOI] [PubMed] [Google Scholar]
- 24. Jones PA, Issa JP, Baylin S. Targeting the cancer epigenome for therapy. Nat Rev Genet. 2016;17(10):630‐641. [DOI] [PubMed] [Google Scholar]
- 25. Azad N, Zahnow CA, Rudin CM, Baylin SB. The future of epigenetic therapy in solid tumours–lessons from the past. Nat Rev Clin Oncol. 2013;10(5):256‐266. [DOI] [PMC free article] [PubMed] [Google Scholar]
- 26. Klutstein M, Nejman D, Greenfield R, Cedar H. DNA methylation in cancer and aging. Can Res. 2016;76(12):3446‐3450. [DOI] [PubMed] [Google Scholar]
- 27. Farooqi AA, Fuentes‐Mattei E, Fayyaz S, et al. Interplay between epigenetic abnormalities and deregulated expression of microRNAs in cancer. Semin Cancer Biol. 2019;58:47‐55. [DOI] [PubMed] [Google Scholar]
- 28. Ahlen Bergman E, Hartana CA, Johansson M, et al. Increased CD4(+) T cell lineage commitment determined by CpG methylation correlates with better prognosis in urinary bladder cancer patients. Clin Epigenetics. 2018;10(1):102. [DOI] [PMC free article] [PubMed] [Google Scholar]
- 29. Zhang J, Wang L, Mao S, et al. miR‐1‐3p contributes to cell proliferation and invasion by targeting glutaminase in bladder cancer cells. Cell Physiol Biochem. 2018;51(2):513‐527. [DOI] [PubMed] [Google Scholar]
- 30. Moll R, Divo M, Langbein L. The human keratins: biology and pathology. Histochem Cell Biol. 2008;129(6):705‐733. [DOI] [PMC free article] [PubMed] [Google Scholar]
- 31. Pastushenko I, Blanpain C. EMT transition states during tumor progression and metastasis. Trends Cell Biol. 2019;29(3):212‐226. [DOI] [PubMed] [Google Scholar]
- 32. Fang J, Wang H, Liu Y, Ding F, Ni Y, Shao S. High KRT8 expression promotes tumor progression and metastasis of gastric cancer. Cancer Sci. 2017;108(2):178‐186. [DOI] [PMC free article] [PubMed] [Google Scholar]
- 33. Henry J, Toulza E, Hsu CY, et al. Update on the epidermal differentiation complex. Front Biosci (Landmark Ed). 2012;17:1517‐1532. [DOI] [PubMed] [Google Scholar]
- 34. Marenholz I, Heizmann CW. S100A16, a ubiquitously expressed EF‐hand protein which is up‐regulated in tumors. Biochem Biophys Res Commun. 2004;313(2):237‐244. [DOI] [PubMed] [Google Scholar]
- 35. Tomiyama N, Ikeda R, Nishizawa Y, Masuda S, Tajitsu Y, Takeda Y. S100A16 up‐regulates Oct4 and Nanog expression in cancer stem‐like cells of Yumoto human cervical carcinoma cells. Oncology letters. 2018;15(6):9929‐9933. [DOI] [PMC free article] [PubMed] [Google Scholar]
- 36. Qi L, Bart J, Tan LP, et al. Expression of miR‐21 and its targets (PTEN, PDCD4, TM1) in flat epithelial atypia of the breast in relation to ductal carcinoma in situ and invasive carcinoma. BMC Cancer. 2009;9:163. [DOI] [PMC free article] [PubMed] [Google Scholar]
- 37. Wang J, Guan J, Lu Z, et al. Clinical and tumor significance of tropomyosin‐1 expression levels in renal cell carcinoma. Oncol Rep. 2015;33(3):1326‐1334. [DOI] [PubMed] [Google Scholar]
- 38. Varisli L. Identification of new genes downregulated in prostate cancer and investigation of their effects on prognosis. Genet Test Mol Biomarkers. 2013;17(7):562‐566. [DOI] [PubMed] [Google Scholar]
- 39. Zhou Z, Wang W, Xie X, Song Y, Dang C, Zhang H. Methylation‐induced silencing of SPG20 facilitates gastric cancer cell proliferation by activating the EGFR/MAPK pathway. Biochem Biophys Res Commun. 2018;500(2):411‐417. [DOI] [PubMed] [Google Scholar]
- 40. Xiang S, Xiang T, Xiao Q, Li Y, Shao B, Luo T. Zinc‐finger protein 545 is inactivated due to promoter methylation and functions as a tumor suppressor through the Wnt/beta‐catenin, PI3K/AKT and MAPK/ERK signaling pathways in colorectal cancer. Int J Oncol. 2017;51(3):801‐811. [DOI] [PMC free article] [PubMed] [Google Scholar]
- 41. Galamb O, Kalmar A, Peterfia B, et al. Aberrant DNA methylation of WNT pathway genes in the development and progression of CIMP‐negative colorectal cancer. Epigenetics. 2016;11(8):588‐602. [DOI] [PMC free article] [PubMed] [Google Scholar]
- 42. Shuxiong Z, Lihe D, Jun Y, et al. Development and external validation of a nomogram predicting prognosis of upper tract urothelial carcinoma after radical nephroureterectomy. Urol Oncol. 2019;37(4):290.e17‐290.e24. [DOI] [PubMed] [Google Scholar]
- 43. Xiao‐Hong Y, Ying‐Hui J, Yue C, et al. Development of a 21‐miRNA signature associated with the prognosis of patients with bladder cancer. Front Oncol. 2019;7(9):729. [DOI] [PMC free article] [PubMed] [Google Scholar]
Associated Data
This section collects any data citations, data availability statements, or supplementary materials included in this article.
Supplementary Materials


