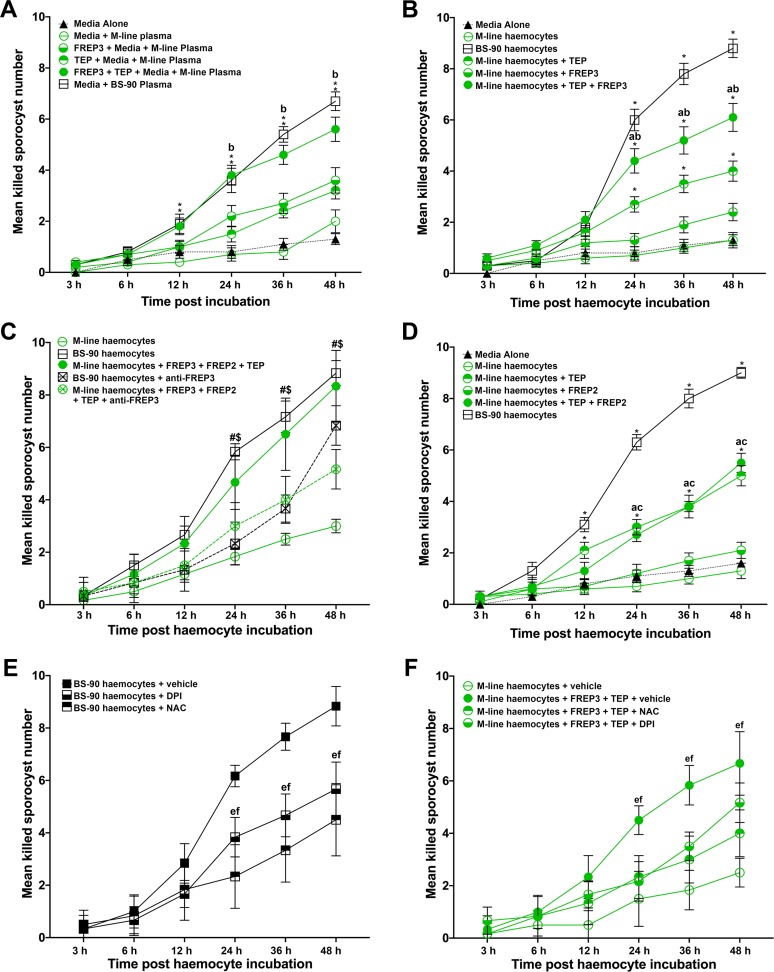
Figure 4. Association of rBgFREP3, rBgTEP1 and rBgFREP2 increased the ability of M-line snails to kill S. mansoni sporocysts.
Effects of rBgFREP3, rBgTEP1 and rBgFREP3-rBgTEP1 complex on killing of S. mansoni sporocysts by M-line plasma (A) and haemocytes (B). (C) Before being exposed to sporocysts, M-line haemocytes were pre-incubated with rBgFREP3-rBgTEP1-rBgFREP2 combination in presence or in absence of anti- BgFREP3 antibodies (abrogation treatment). BS-90 haemocytes were incubated with anti-BgFREP3 antibodies. (D) The effect of rBgFREP2, rBgTEP1 and rBgFREP2-rBgTEP1 complex on the destruction of sporocysts by M-line haemocytes. (E and F) The role of ROS in killing of S. mansoni sporocysts by haemocytes from B. glabrata snails. (E) The addition of ROS inhibitors NAC and DPI abolished the ability of BS-90 haemocytes to destroy sporocysts. (F) Killing sporocysts of M-line haemocytes rendered by rBgFREP3-rBgTEP1 complex was annulled by pre-incubation with ROS inhibitors NAC and DPI. Statistically significant difference symbols in A, B and D: asterisk (*) represents comparison with M-line haemocytes or plasma, *p<0.05, **p<0.01; a represents comparison with BS-90 haemocytes or plasma, p<0.05; b represents comparison with both single treatment (rBgTEP1/rBgFREP3 or rBgFREP2), p<0.05; c represents comparison with only BgFREPs treatment, p<0.05; bars represent SEM, n = 10. Statistically significant difference symbols in C: # represents comparison BS-90 haemocytes with BS-90 haemocytes+anti-rBgFREP3 antibodies, p<0.05; $ represents comparison M-line haemocytes+rBgFREP3+rBgFREP2+rBgTEP1 with M-line haemocytes+rBgFREP3+rBgFREP2+rBgTEP1+anti-rBgFREP3 antibodies, p<0.05; bars represent SEM, n = 10. Statistically significant difference symbols in E and F e represents comparison NAC treatment with BS-90 haemocytes or M-line haemocytes+rBgFREP3+rBgTEP1, p<0.05; f represents comparison DPI treatment with BS-90 haemocytes or M-line haemocytes+rBgFREP3+rBgTEP1, p<0.05; bars represent SEM, n = 6.


