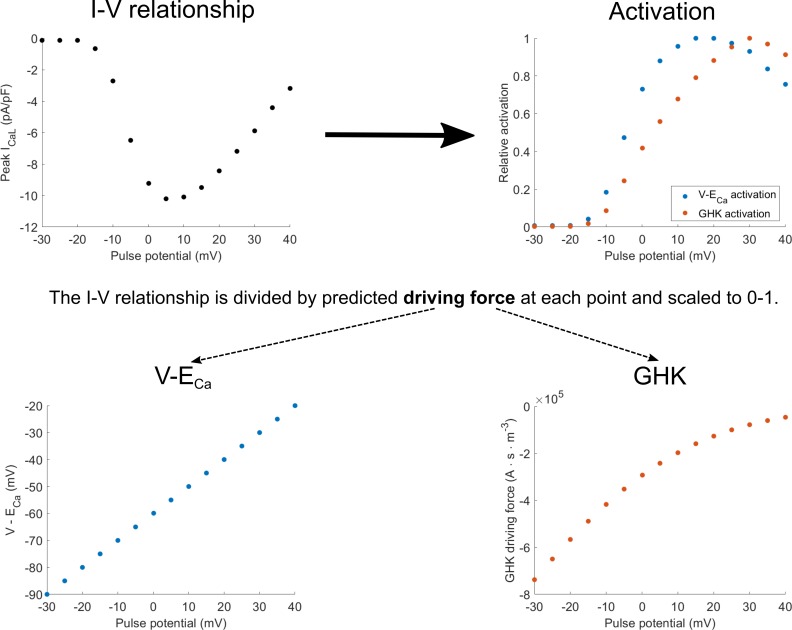
Appendix 1—figure 1. Diagram of how activation curves are extracted from the I-V relationship.
The activation curves (top right) are obtained by dividing values in the I-V curve (top left) at each pulse potential by the driving force considering either V-ECa-based driving force (bottom right) or the Goldman-Hodgkin-Katz (GHK) flux equation (bottom left).

