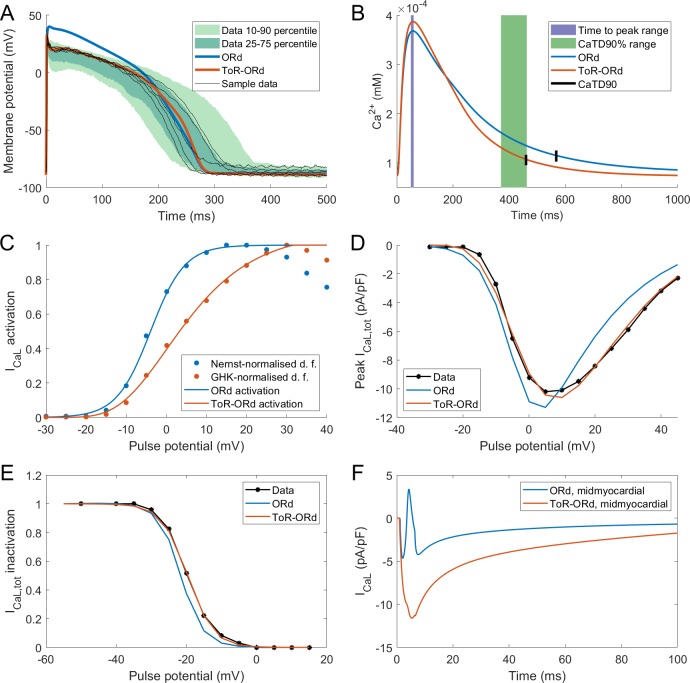
Figure 2. Action potential, calcium transient, and ICaL in ToR-ORd.
Action potential (A) and calcium transient (B) at 1 Hz obtained with the ToR-ORd model following calibration, compared to those obtained with the ORd model and experimental data from O'Hara et al. (2011) and Coppini et al. (2013), respectively. The purple and green zones in (B) stand for mean ± standard deviation. The duration of calcium transient at 90% recovery was extracted from figures in Coppini et al. (2013), adding the time to peak and time from peak to 90% recovery. (C) Activation curves used in the ToR-ORd and ORd models (blue and red lines, respectively). The points correspond to the IV relationship measured in Magyar et al. (2000) normalised by the Nernstian driving force (d.f.) assuming reversal potential of +60 mV (blue points) and the GHK driving force (red points). (D, E) I-V relationship and steady-state inactivation as measured in ToR-ORd (red line) versus ORd model (blue line) versus experimental data from Magyar et al. (2000) (black points with line). ICaL,tot is the sum of currents corresponding to all ions (Ca2+, Na+, and K+) passing through the L-type calcium current channels. (F) L-type calcium current of a midmyocardial cell, showing current reversal in ORd, but not in ToR-ORd. Only the calcium component of ICaL,tot is shown to demonstrate that the current reversal is not due to other ions. We note that the difference in total amplitude of ICaLin Figure 2F follows predominantly from different action potential shape in ToR-ORd vs ORd, consistent with the I-V relationship.

