Abstract
Galcanezumab is a humanized immunoglobulin G (IgG) monoclonal antibody (mAb) indicated for the prevention of migraine that binds to calcitonin gene‐related peptide. A population pharmacokinetic (PK) analysis was performed to characterize galcanezumab PK using data pooled from 7 clinical studies. Clinical studies included healthy individuals and patients with episodic or chronic migraine who were administered between 5 and 300 mg galcanezumab. The PK data were analyzed using nonlinear mixed‐effects modeling. Galcanezumab concentration‐time data were described with a 1‐compartment model with first‐order absorption following subcutaneous administration and linear elimination. At the median body weight of 74 kg, the estimated population apparent clearance (CL/F) was 0.00785 L/h (34% IIV), the apparent volume of distribution was 7.33 L (34% IIV), and half‐life was 27 days. Patient body weight was found to have a modest effect of CL/F, with median galcanezumab concentrations being lower in the heaviest patients compared to the lightest patients, but this outcome was determined not to be clinically relevant in the context of model‐estimated random variability. Dosing adjusted for body weight is not warranted in adults. Age, sex, race/ethnicity, immunogenicity, renal/hepatic markers, and injection‐site location did not affect galcanezumab PK. In conclusion, galcanezumab exhibits PK parameters typical for an IgG mAb administered subcutaneously. The population PK model developed in this study demonstrates that galcanezumab exhibits linear PK that was not influenced in a clinically relevant manner by the patient factors evaluated.
Keywords: galcanezumab, calcitonin gene‐related peptide, pharmacokinetics, migraine
Galcanezumab is a humanized immunoglobulin G monoclonal antibody indicated for the prevention of migraine that binds to calcitonin gene‐related peptide (CGRP) and prevents its biological activity without blocking the CGRP receptor.1 The efficacy of galcanezumab was demonstrated in 3 randomized, double‐blind, placebo‐controlled, phase 3 studies in patients with episodic or chronic migraine.2, 3, 4, 5 Earlier studies evaluated the safety and efficacy of galcanezumab (5, 50, 120, and 300 mg/mo) in patients with episodic migraine6 and the tolerability and pharmacokinetics (PK) of galcanezumab (1‐600 mg single dose; 150 mg every other week) in healthy individuals.5, 7, 8, 9 Monteith et al showed that galcanezumab serum concentrations were dose proportional at single doses ranging from 1 mg to 600 mg.7 The time to maximum concentration of galcanezumab is 5 days, and the elimination half‐life is 27 days.10 The recommended dosage regimen of galcanezumab for the prevention of migraine is a 240‐mg loading dose followed by 120 mg monthly given by subcutaneous injection.
In this article we present the development, qualification, and application of a population PK analysis of galcanezumab in healthy individuals from phase 1 studies, patients with episodic migraine from phase 2 and 3 studies, and patients with chronic migraine from phase 3 studies. The objective was to analyze galcanezumab concentration data with a model‐based approach by means of nonlinear mixed‐effect modeling (NONMEM) in order to estimate PK parameters and their interpatient variability across the population. The PK model was also used to examine the effect of intrinsic and extrinsic patient factors on galcanezumab PK. Galcanezumab clinical pharmacology sections of the prescriber information, including pharmacokinetics and specific populations, are primarily based on the population PK analysis results reported herein.
Materials and Methods
The studies used in this analysis were conducted in compliance with the Declaration of Helsinki, International Conference on Harmonisation Guidelines for Good Clinical Practice, and applicable local regulations. The protocols were approved by the ethics committees of all participating centers, and all individuals provided written informed consent before study entry.
Data Assembly, Editing, and Disposition
Serum galcanezumab concentrations from healthy individuals, patients with episodic migraine, and patients with chronic migraine were combined with dosing information and demographic data using statistical analysis software to produce single study data sets that were pooled to generate an analysis data set.
A summary of the clinical studies, including population, dosing, and PK sampling information, that contributed data to the population PK analysis data set is presented in Table 1. Overall, 15 770 PK observations from 1889 individuals were included in the development of the PK model. There were 1448 PK observations from 270 patients from Study I5Q‐MC‐CGAJ included in the validation data set. The PK sampling in phase 1 studies occurred frequently following dosing to obtain discrete information of the time course of galcanezumab concentrations. In phase 2 and 3 studies the PK sampling was sparse (typically monthly) following dosing. The frequency distribution of the percentage of observed galcanezumab concentrations relative to time from previous dose for all studies included in the population PK analysis is shown in Supplemental Figure S1. Overall, these data aided in compartmental model selection and development. Details for quantifying serum galcanezumab concentrations from blood samples have been described previously.11 The galcanezumab concentration in the PK analysis data set ranged from 0.83 to 135 180 ng/mL. About 0.3% of the galcanezumab concentrations were below the limit of quantitation, and these data were excluded from the analysis. No subjects/patients were excluded from the analysis as outliers based on their galcanezumab concentration data.
Table 1.
Summary of Study Information Included in the Population PK Analysis
| Study/Phase | Population | Dose | Number of PK Samples/Durationa | Number of Patients/ PK Observations |
|---|---|---|---|---|
| I5Q‐MC‐CGAO/1 | Healthy | 240 mg SD | 18/20 wk | 174/2890 |
| 300 mg SD | ||||
| I5Q‐MC‐CGAE/1 | Healthy | 5, 50, 120, or 300 mg SD | 18/20 wk | 35/674 |
| 300 mg Q4W | 33/28 wk | |||
| I5Q‐MC‐CGAB/2 | Episodic migraine | 5, 50, 120, or 300 mg Q4Wb | 6/24 wk | 266/1508 |
| I5Q‐MC‐CGAG (EVOLVE‐1)/3 | Episodic migraine | 240 mg LD/120 mg QMc | 11/10 mo | 422/3621 |
| 240 mg QMc | 11/10 mo | |||
| I5Q‐MC‐CGAH (EVOLVE‐2)/3 | Episodic migraine | 240 mg LD/120 mg QMc | 11/10 mo | 447/3940 |
| 240 mg QMc | 11/10 mo | |||
| I5Q‐MC‐CGAI (REGAIN)/3 | Chronic migraine | 240 mg LD/120 mg QMd | 10/16 mo | 545/3137 |
| 240 mg QMd | 10/16 mo | |||
| I5Q‐MC‐CGAJ/3 | Episodic and chronic migraine | 240 mg LD/120 mg QMd | 7/16 mo | 270/1448 |
| 240 mg QMd | 7/16 mo |
LD indicates loading dose; PK, pharmacokinetic; QM, once every month; Q4W, once every 4 wk; SD, single dose.
Calculated as time from first dose administration to last PK sample collected in study.
Total of 3 administrations over 12 wk.
Total of 6 administrations over 6 mo.
Total of 12 administrations over 12 mo.
Development of a Base Model
A 1‐compartment model with first‐order absorption and linear elimination was used to describe the galcanezumab concentration‐time data, and estimates of the PK parameters and error terms were obtained by fitting the concentration‐time data using NONMEM (version 7.3; ICON Development Solutions, Hanover, Maryland). NONMEM uses the extended least‐squares fitting routine, which continues iteratively until a minimal value of the objective function is reached. The first‐order conditional estimation method with η‐ε interaction was used for all analyses. The interindividual variability (IIV) was assumed to be log‐normally distributed, and variability terms were investigated for all parameters. Covariance between parameters was assessed using an ω block. In addition, 2 residual error models, proportional and combined additive and proportional, were also evaluated. Selection of the PK base model structure was based on agreement between predicted and observed serum concentrations, lack of pattern or randomness in the weighted residuals versus the predicted values, changes in the IIV, and significant decreases in the minimal value of the objective function.
Development of a Covariate Model
A listing of patient factors and the specific PK parameters on which they were tested, along with the type of covariate models used, are specified in Table 2. The patient factors were tested for their effect on each of the PK parameters listed. If a patient factor was selected on more than 1 PK parameter, then it was tested in combination. Patient factors characterized as continuous covariates were tested using linear (equation 1), power (equation 2), or exponential (equation 3) models, whereas patient factors characterized as categorical covariates were tested using a categorical model (equation 4).
| (1) |
| (2) |
| (3) |
| (4) |
where P is the individual's estimate of the parameter, Θ1 represents the typical value of the parameter, Θ2 represents the effect of the covariate, COV is the value of the covariate, and MED is the population median of the covariate, IND is an indicator variable with a value of either 0 or 1 assigned for values of a dichotomous categorical covariate (eg, female or male) and 1 to n for various values of a categorical covariate ranging from 1 to n, where n is the number of categories (eg, n races).
Table 2.
Patient Factors Assessed in the Population PK Model
| Patient Factor | Covariate Type | PK Parameter |
|---|---|---|
| Age | Continuous | CL/F, V/F |
| Dose | Continuous | CL/F, ka, V/F |
| Body weight | Continuous | CL/F, ka, V/F |
| Race | Categorical | CL/F, V/F |
| Subrace | Categorical | CL/F, V/F |
| Ethnicity | Categorical | CL/F, V/F |
| Sex | Categorical | CL/F, V/F |
| Healthy volunteers | Categorical | CL/F, V/F |
| ADA titer | Categorical | CL/F |
| ADA positive | Categorical | CL/F |
| Treatment‐emergent ADA | Categorical | CL/F |
| Cockcroft‐Gault creatinine clearancea | Continuous | CL/F |
| Bilirubinb | Continuous | CL/F |
| Injection site locationc | Categorical | CL/F, ka, V/F |
ADA indicates antidrug antibody; CL/F, apparent clearance; ka, absorption rate constant; PK, pharmacokinetic; V/F, apparent volume of distribution.
Represents the glomerular filtration rate by the kidney.
Nonspecific marker for liver function.
Sites included abdomen, back of the upper arm, buttocks, and thigh.
The criterion for the selection of covariates in the forward selection process was a statistically significant difference in the minimal value of the objective function (at least a 6.635‐point drop; P < .01), whereas the criteria for backward elimination was a statistically significant difference in the minimal value of the objective function (at least a 10.828‐point drop; P < .001). Model convergence, reasonable estimates of parameter values, and parameter precision were all additional factors for covariate selection. Once statistically significant covariates were identified, individual analysis was performed for each covariate to ensure the inclusion of the covariate results in a >5% decrease in the (IIV) of the corresponding model parameter.
Development of the Final Model
The final model was developed taking into account the convergence of the estimation and covariance routines, reasonable parameter and error estimates based on the known PK of the compound, good precision of the parameter and error estimates, statistically significant difference in the minimal value of the objective function criterion (at least a 6.635‐point drop in minimal value of the objective function [P < .01] for 1 degree of freedom), decrease in the absolute IIV in the relevant parameters of >5%, agreement between predicted and observed serum concentrations, as assessed by visual inspection, and random distribution of the weighted residuals versus the predicted values, as assessed by visual inspection.
Final Model Evaluation
A bootstrap analysis was performed to assess the precision of the final parameter estimates. The bootstrap was performed by sampling from the analysis data set with replacement to produce resampled data sets with the same number of patients. A total of 200 bootstrap data sets were created, and the model was fit to each of them. The 95%CIs for each parameter were calculated using the 2.5th and 97.5th percentiles from the distribution of the bootstrap parameter values.
A visual predictive check was performed on the model to ensure that the model maintained fidelity with the data that were used to develop it. The PK data were simulated using the model, taking into account variability in all parameters, as determined by IIV, and residual error terms. The distributions of simulated concentrations, conditional of the posterior distribution of model parameters, were compared with the observed distributions to ensure concordance. Simulated and observed distributions were compared by calculating the median and 5th and 95th percentiles. Prediction correction was applied to allow comparison of model performance across regimens.12
Serum galcanezumab concentrations from Study I5Q‐MC‐CGAJ were used as the validation data set for the final PK model. A validation of the PK model was performed by visually comparing the galcanezumab concentrations from Study I5Q‐MC‐CGAJ with the median and 90% prediction interval simulated with the final PK model.
Final Model Application
PK simulations were conducted taking into account inter‐ and intrasubject variability and patient demographics from the PK model using MuSE (version 3.1; R Foundation for Statistical Computing, Vienna, Austria). Distributions of expected PK responses in 500 subjects for 6 months were presented at 120 mg/mo with or without a 240‐mg loading dose across the range of body weights in the analysis data set, and at 120 mg/mo with a 240‐mg loading dose at the 5th and 95th percentiles of body weight. Also, post hoc estimates of apparent clearance (CL/F) were obtained from the PK model and contrasted with body weight, antidrug antibody (ADA) status, ADA titer, and injection site location (also absorption rate constant [ka] and apparent volume of distribution [V/F]).
Results
At study entry, the mean (SD) age of individuals in the analysis data set was 41 (±12) years, with individuals ranging from 17 to 65 years, and the mean (SD) body weight was 75.8 (±16.8) kg, with individuals ranging from 40 to 135.5 kg. The majority of individuals were non‐Hispanic (74%), white (72%), female (80%), and patients with migraine (89% total; 60% episodic and 29% chronic). Details regarding demographic and lab data can be found in Supplemental Table S1.
PK Model Development
Galcanezumab concentration‐time data were best described with a 1‐compartment model using the first‐order conditional estimation method with interaction and were parameterized in terms of ka, CL/F, and V/F with IIV on each parameter. Residual variability was accounted for by a proportional error structure. There was no evidence from the PK data that a 0‐order absorption model, a more complex compartmental model such as a 2‐compartment model, or a target‐mediated drug disposition model would improve fitting of the model.
Parameter estimates for the base and final PK model are provided in Table 3. The base PK model included an ω block to assess covariance among ka, CL/F, and V/F, as this approach improved model fitting, and the ω block was retained in the final model. All PK parameters were well‐estimated, with standard error of the estimates at 6% or less. The estimated population CL/F was 0.00785 L/h with 34% IIV, V/F was 7.33 L with 34% IIV, and ka was 0.0199 h−1 with 92% IIV at the population median body weight of 73.6 kg.
Table 3.
Pharmacokinetic and Covariate Parameters in the Base and Final Population Models
| Base Model | Final Model | ||||
|---|---|---|---|---|---|
| Parameter Description | Population Estimate (%SEE) | IIVa (%SEE) | Population Estimate (%SEE) | IIVa (%SEE) | Bootstrap Analysis 95%CI |
| Rate of absorption | |||||
| Parameter for ka (h‐1) | 0.0188 (4) | 86% (23) | 0.0199 (2) | 92% (5) | (0.0181‐0.0217) |
| Clearance | |||||
| Parameter for CL/F (L/h) | 0.00790 (<1) | 40% (5) | 0.00785 (1) | 34% (6) | (0.00770‐0.00799) |
| Effect of BW (kg) on CL/Fb | – | – | 0.601 (6) | – | (0.522‐0.698) |
| Volume of distribution | |||||
| Parameter for V/F (L) | 7.32 (<1) | 34% (6) | 7.33 (1) | 34% (7) | (7.20‐7.47) |
| IIV c | |||||
| Covariance (ka and CL/F) | 0.0779 (31) | 0.0694 (19) | (0.0115‐0.102) | ||
| Covariance (CL/F and V/F) | 0.0917 (7) | 0.0716 (9) | (0.0615‐0.0848) | ||
| Residual error (proportional) d | 22% (3) | 22% (3) | (21‐22) | ||
BW indicates body weight; CL/F, apparent clearance; IIV, interindividual variability; ka, absorption rate constant; SEE, standard error of the estimate; V/F, apparent volume of distribution.
, where ΩN is the variance of the relevant parameter.
, where 73.6 is the median body weight of the population and 0.601 is the estimate for the effect of body weight predicted by the model.
Covariance between ω2.
.
Table 2 includes a complete list of all factors tested, including dose, age, sex, race/ethnicity, immunogenicity, measures of renal and hepatic function, and injection site location (abdomen, back of the upper arm, buttocks, or thigh). Forward selection covariate analysis revealed that body weight had a statistically significant effect on CL/F (P < .01, reduction in model objective function of 340) and V/F (P < .01, reduction in model objective function of 8.62). The influence of body weight was best characterized by a power model equation with an allometric relationship of 0.601 for CL/F and 0.145 for V/F, demonstrating that body weight has less effect on V/F than CL/F. With body weight as a covariate, the intersubject variability was decreased 6% for CL/F, but it was increased 7% for V/F. Because the prespecified criteria to ensure the inclusion of a covariate was a decrease in the IIV of the PK parameter by >5%, body weight on V/F did not meet this criterion and was not included in the PK model. Overall, these data demonstrate the lack of clinically meaningful relationship between body weight and V/F. With only 1 covariate in the PK model (body weight on CL/F), backward elimination was not used. The values of CL/F in the base (0.00790 L/h) and final model (0.00785 L/h) were similar. Supplemental Table S2 lists a summary of the covariate models tested and their results.
PK Model Evaluation
Diagnostic plots indicated that the 1‐compartment model described the observed data very well, which was validated on the basis of the agreement between mode‐predicted concentration‐time profile data of galcanezumab and the observed concentration data (Figure 1). The bootstrap analysis indicated model stability, and the estimates were similar to the final model estimates (Table 3). From the bootstrap analysis, the relative standard error of the PK parameters was as follows: ka = 4%, CL/F = 1%, V/F = 1%, effect of weight on CL/F = 7%, IIV on ka‐CL = 37%, IIV on CL/F‐V/F = 9%, and residual error = 3%. Overall, the relative standard error was ≤9% for all parameters except IIV on ka‐CL, indicating that this approach was able to sufficiently assess the precision of the final parameter estimates. Visual examination of model predictions versus observations also supported the validity of this model, as the predicted concentrations were consistent with the observed concentration data (Figure 2, top panel). Supplemental Figure S2 excludes observed PK data, and Supplemental Figure S3 illustrates by study stratification. An external validation of the model was performed by visually comparing the galcanezumab concentrations from Study I5Q‐MC‐CGAJ with the median and 90% prediction interval simulated with the final model (Figure 2, bottom panel). Overall, the galcanezumab concentrations obtained from Study I5Q‐MC‐CGAJ fell within the 90% prediction interval computed with the final model. There was a slight overprediction of the central tendency, but this particular finding was deemed to have no clinical consequence regarding the PK characterization of galcanezumab.
Figure 1.
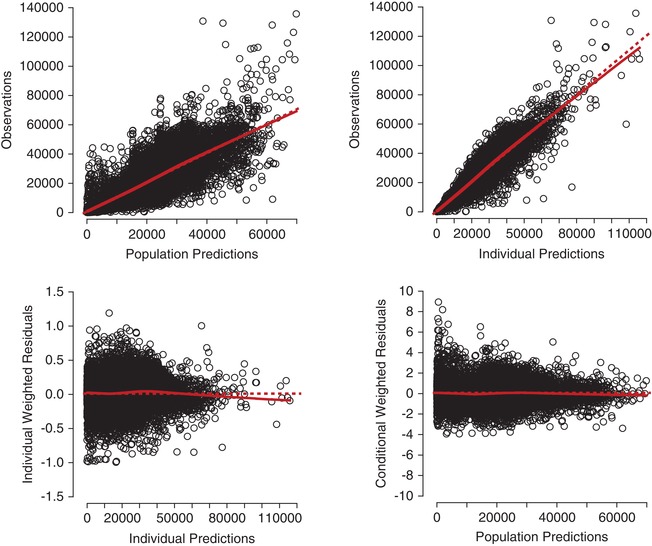
Goodness‐of‐fit plots for the final pharmacokinetic model. Locally weighted scatterplot smoothing fit, a smoothed value given by a weighted linear least squares regression over the span of observations, for data presented (solid line) in addition to a line of unity (dashed line).
Figure 2.
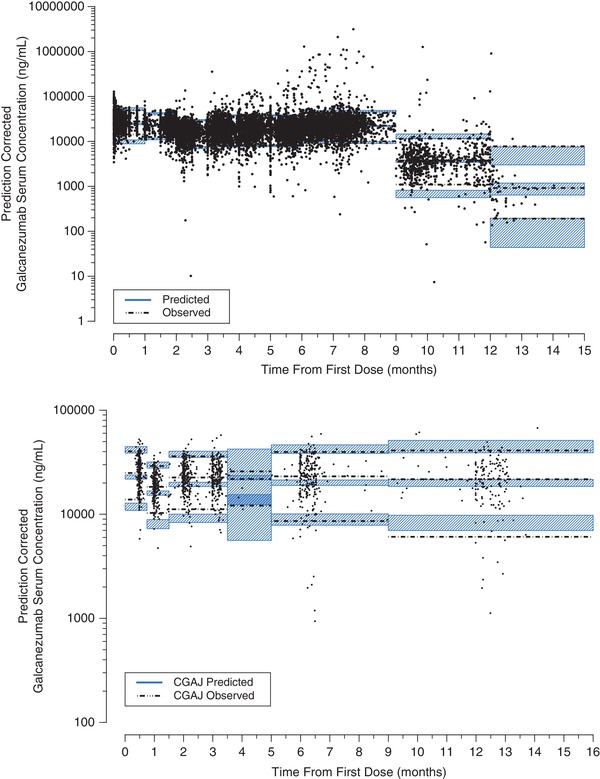
Prediction‐corrected visual predictive check (top panel) and external validation (bottom panel) for the final pharmacokinetic model.
PK Model Application
To assess the influence of a 240‐mg loading dose, the galcanezumab concentration‐time profile was simulated using a dosage regimen of a 240‐mg loading dose (LD) followed by 120 mg/mo and a dosage regimen of 120 mg/mo only, using the final PK model (Figure 3). The figure highlights higher median galcanezumab concentrations (2 times) from month 0 to month 1 with 240‐mg LD+120 mg/mo compared to 120 mg/mo. Also, 240‐mg LD+120 mg/mo achieved steady state following the initial loading dose, but 120 mg/mo did not achieve steady state until 4 to 5 months.
Figure 3.
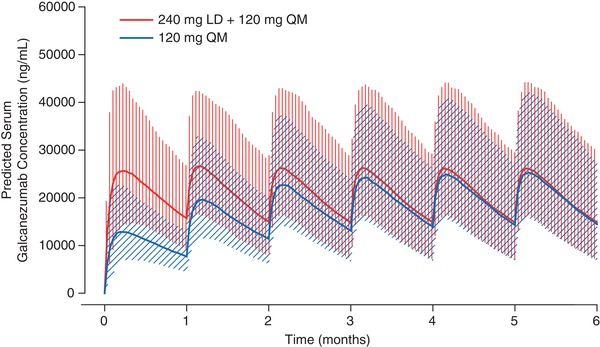
Galcanezumab PK profiles after a dosage regimen of 120 mg monthly and 240‐mg loading dose followed by 120 mg monthly. LD indicates loading dose; QM, monthly; PK, pharmacokinetic.
Post hoc PK parameters were estimated from the model for the patients in the analysis data set following 240‐mg LD+120 mg/mo. The median time to maximum concentration after subcutaneous dosing was 5 days, and the apparent terminal elimination half‐life was 27 days. The minimum galcanezumab concentration (Cmin) after a loading dose of 240 mg was 15 900 ng/mL, and the minimum trough galcanezumab concentration at steady state (Cmin,ss) after 120 mg QM was 15 400 ng/mL.
Galcanezumab CL/F increased in a less‐than‐proportional manner with respect to body weight (Figure 4, top panel). The influence of body weight on the galcanezumab concentration‐time profiles following 240‐mg LD+120 mg/mo was assessed by simulation using the final PK model. Patient body weights at the 5th percentile (52 kg) and 95th percentile (105 kg) obtained from the PK analysis data set were used to determine the impact of body weight in the context of the overall variability in galcanezumab PK. The effect of body weight on CL/F resulted in a lower median galcanezumab concentration in the heaviest patients compared to the lightweight patients. However, in the context of model‐estimated random variability, there was a considerable overlap in the 90% prediction interval of the 5th and 95th percentiles of body weight (Figure 4, bottom panel).
Figure 4.
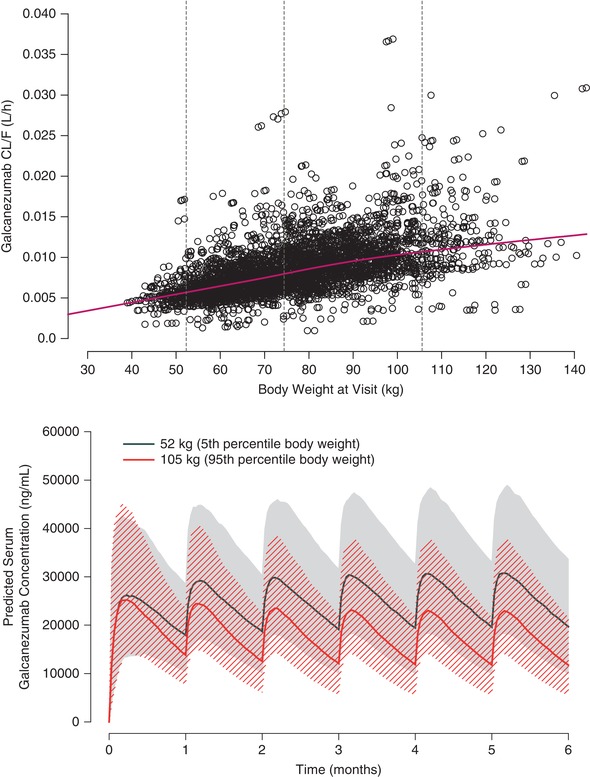
Relationship of galcanezumab CL/F and body weight (top panel) and galcanezumab concentration‐time profiles at the 5th and 95th percentiles of body weight at a dosage regimen of 240‐mg loading dose followed by 120 mg monthly (bottom panel). In the top panel, dashed horizontal lines represent the 5th (52 kg), 50th (73 kg), and 95th (105 kg) percentiles of body weight, and the solid line represents a locally weighted scatterplot smoothing fit and and circles represent individual subject data points. In the bottom panel, the solid line denotes the median responses, and the hatched and shaded areas denote the 90% prediction interval.
During covariate modeling, immunogenicity and injection site location were not found to be statistically significant covariates on galcanezumab PK. Galcanezumab CL/F was unchanged in patients who had ADAs detected, including treatment‐emergent positive, compared to patients who did not have ADAs detected (Figure 5, top panel). CL/F was also unaffected by ADA titer (Figure 5, bottom panel). Figure 6 illustrates that ka, CL/F, and V/F are similar irrespective of galcanezumab injection into the abdomen, back of the upper arm, buttocks, or thigh.
Figure 5.
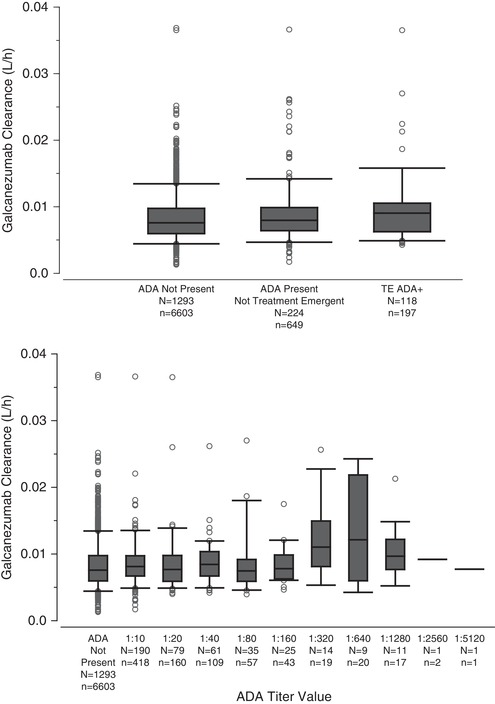
Galcanezumab apparent clearance in patients based on antidrug antibody status (top) and titer (bottom). The middle line in each box plot represents the median; the top and bottom margins of the box represent the 75th and 25th percentiles; the whiskers extend to the 95th and 5th percentiles; data points outside the whiskers represent the points beyond the percentiles. N, number of patients; n, number of PK observations; TE ADA, treatment emergent anti‐drug antibody.
Figure 6.
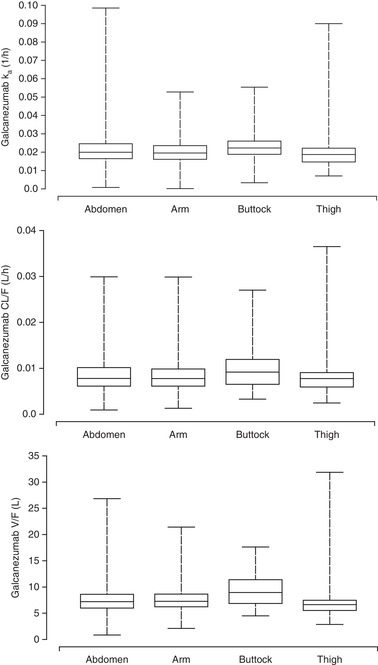
Galcanezumab pharmacokinetic parameters contrasted by injection site location based in population pharmacokinetic analysis. Upper panel: absorption rate constant (Ka). Middle panel: Apparent clearance (CL). Lower panel: Apparent volume of distribution (V). Abdomen (N = 762); arm (N = 949); buttocks (N = 72); thigh (N = 107). The middle line in each box plot represents the median; the top and bottom margins of the box represent the 75th and 25th percentiles; the whiskers extend to the 95th and 5th percentiles.
Discussion
This article provides a comprehensive assessment of galcanezumab PK using population PK methods. A 1‐compartment model with first‐order absorption and linear elimination was used to characterize galcanezumab PK over a dose range of 5 to 300 mg following single and multiple doses in healthy individuals and patients with episodic or chronic migraine. There was no evidence of target‐mediated drug disposition from our PK analysis. The estimated population CL/F and V/F were 0.007 85 L/h and 7.33 L, respectively, with both parameters having 34% IIV. The estimates of galcanezumab CL/F and V/F are reflective of slow elimination and limited distribution and are comparable to reported PK parameters of other immunoglobulin G monoclonal antibodies.13, 14 Monteith et al7 previously reported single‐ and multiple‐dose galcanezumab PK parameters based on a noncompartmental PK analysis that was consistent with our model‐based analysis.
The ratio of Cmin,ss/Cmin represents the degree of increase in galcanezumab trough concentrations from the first administration to steady state. At the recommended dosage for the prevention of migraine of a 240‐mg loading dose (first administration) followed by monthly doses of 120 mg (steady state), the Cmin,ss/Cmin ratio was calculated to be 0.97. A ratio close to 1 indicated that galcanezumab concentrations at the first month of dosing achieved steady state. Based on a half‐life of 27 days for galcanezumab, steady‐state concentrations of a dosing regimen of 120 mg monthly (without a 240‐mg loading dose) would not be achieved until 4 to 5 months of dosing (Figure 3).
Body weight was identified as the only covariate on the PK of galcanezumab with CL/F increasing in a less‐than‐proportional manner with body weight. However, based on the power relationship of body weight with CL/F (Table 3), typical CL/F is expected to differ from the median (50th percentile) by only approximately 20% at lower (5th) and higher (95th) percentiles. This outcome was determined not to be clinically relevant in the context of random variability, and therefore, galcanezumab dosing adjusted by body weight is not warranted in adults.
It is noted that covariance between PK parameters is assessed after the forward selection step as the PK parameter correlation may be due to a relationship between each PK parameter and the same covariate rather than due to a correlation between PK parameters. In this analysis, covariance among ka, CL/F, and V/F was evaluated before the covariate analysis was conducted because it improved model fitting compared to the same model but with no covariance. A possible limitation of this approach may be the ability to detect relationships of PK parameters with covariates given the covariance term between PK parameters.
Injection‐site location is an important consideration for patient satisfaction and preference regarding dosing. The population PK analysis evaluated whether injection site location (abdomen, back of the upper arm, buttocks, and thigh) had an impact on galcanezumab PK after subcutaneous dosing. Our covariate analysis showed that galcanezumab PK parameters were similar across the 4 injection‐site locations. These data in patients after monthly galcanezumab doses are consistent with a previous report of the PK findings after a single dose of galcanezumab to healthy individuals into the abdomen, back of the upper arm, and thigh.4, 5 As a result, it is recommended that galcanezumab be administered into the abdomen, back of the upper arm, buttocks, or thigh subcutaneously.15
A therapeutic antibody may be viewed by the body as foreign and activate immune responses, which can lead to the production of ADAs that can bind to the therapeutic antibody. In some cases the development of ADAs can affect the PK of an antibody,16 potentially leading to changes in safety and efficacy. Therefore, the impact of immunogenicity on galcanezumab CL/F was investigated. Previously reported immunogenicity findings from phase 3 galcanezumab trials in patients with episodic or chronic migraine demonstrated that higher ADA titers did not change galcanezumab serum concentrations.17 In this population PK analysis, we showed that galcanezumab CL/F was unaffected by ADA titer or ADA status, defined by ADA‐positive and treatment‐emergent ADA‐positive patients. Of the 1719 individuals included in the population covariate analysis for ADA titer, only 13 individuals had an ADA titer greater than 1:640. Thus, a definitive conclusion about the effect of higher ADA titer on galcanezumab CL/F cannot be made with this current data set.
Although the liver and kidneys may contribute to catabolism of therapeutic antibodies, in general, renal or hepatic impairment does not affect elimination of monoclonal antibodies.18, 19 The large size of a therapeutic antibody (150 kDa) prevents efficient filtration through the glomerulus, and antibody PK is expected to be unchanged by renal impairment; however, specific cases do exist in which antibody PK is affected.20, 21 Therefore, creatinine clearance, as a marker for renal impairment, was examined as a potential covariate on galcanezumab CL/F. Our analysis revealed that creatinine clearance calculated using the Cockcroft‐Gault method (range 24 to 308 mL/min) did not affect the galcanezumab CL/F in patients categorized as having mild or moderate renal impairment. Patients with severe renal impairment were not studied. In addition, bilirubin concentration (range 2 to 46 µmol/L), as a marker for hepatic function was not a statistically significant covariate on galcanezumab CL/F.
Conclusions
In summary, consistent with an IgG monoclonal antibody, galcanezumab exhibited PK properties of slow absorption following subcutaneous administration, limited distribution, low clearance, and a long terminal elimination half‐life in healthy individuals and in patients with episodic migraine and chronic migraine. The population PK model developed in this study demonstrates that galcanezumab exhibits linear PK that was not influenced in a clinically relevant manner by the patient factors evaluated.
Conflicts of Interest
W.K. and T.Q. are employees and stockholders of Eli Lilly and Company.
Data‐Sharing Statement
Lilly provides access to all individual participant data collected during the trial, after anonymization, with the exception of pharmacokinetic or genetic data. Data are available on request 6 months after the indication studied has been approved in the United States and European Union and after primary publication acceptance, whichever is later. No expiration date of data requests is currently set once they are made available. Access is provided after a proposal has been approved by an independent review committee identified for this purpose and after receipt of a signed data‐sharing agreement. Data and documents, including the study protocol, statistical analysis plan, clinical study report, blank or annotated case report forms, will be provided in a secure data‐sharing environment for up to 2 years per proposal. For details on submitting a request, see the instructions provided at http://www.clinicalstudydatarequest.com.
Funding
These studies were sponsored by Eli Lilly and Company, Indianapolis, Indiana, USA.
Supporting information
Supplemental Figure S1.
Supplemental Figure S2.
Supplemental Figure S3.
Supplemental Table S1. Descriptive Statistics of Demographic and Laboratory Data
Supplemental Table S2. Summary of Covariate Models
Supplemental Figure S1. Frequency distribution of the percentage of observed galcanezumab concentrations relative to time from previous dose.
Supplemental Figure S2. Prediction‐corrected visual predictive check for the final PK model.
Supplemental Figure S3. Prediction‐corrected visual predictive check across studies for the final PK model.
Acknowledgment
The authors thank Mark Stead of Covance with help in preparing this manuscript.
Clinical Trial Identifiers (ClinicalTrials.gov) NCT02104765, NCT02576951, NCT02163993, NCT02614196, NCT02614261, NCT02614183, and NCT02614287.
References
- 1. Benschop RJ, Collins EC, Darling RJ, et al. Development of a novel antibody to calcitonin gene‐related peptide for the treatment of osteoarthritis‐related pain. Osteoarthritis Cartilage. 2014;22(4):578‐585. [DOI] [PubMed] [Google Scholar]
- 2. Detke HC, Goadsby PJ, Wang S, Friedman DI, Selzler KJ, Aurora SK. Galcanezumab in chronic migraine: the randomized, double‐blind, placebo‐controlled REGAIN study. Neurology. 2018;91(24):e2211‐e2221. [DOI] [PMC free article] [PubMed] [Google Scholar]
- 3. Skljarevski V, Matharu M, Millen BA, Ossipov MH, Kim BK, Yang JY. Efficacy and safety of galcanezumab for the prevention of episodic migraine: results of the EVOLVE‐2 phase 3 randomized controlled clinical trial. Cephalalgia. 2018;38(8):1442‐1454. [DOI] [PubMed] [Google Scholar]
- 4. Stauffer VL, Dodick DW, Zhang Q, Carter JN, Ailani J, Conley RR. Evaluation of galcanezumab for the prevention of episodic migraine: the EVOLVE‐1 randomized clinical trial. JAMA Neurol. 2018;75(9):1080‐1088. [DOI] [PMC free article] [PubMed] [Google Scholar]
- 5. Stauffer VL, Sides R, Lanteri‐Minet M, et al. Comparison between prefilled syringe and autoinjector devices on patient‐reported experiences and pharmacokinetics in galcanezumab studies. Patient Prefer Adherence. 2018;12:1785‐1795. [DOI] [PMC free article] [PubMed] [Google Scholar]
- 6. Skljarevski V, Oakes TM, Zhang Q, et al. Effect of different doses of galcanezumab vs placebo for episodic migraine prevention: a randomized clinical trial. JAMA Neurol. 2018;75(2):187‐193. [DOI] [PMC free article] [PubMed] [Google Scholar]
- 7. Monteith D, Collins EC, Vandermeulen C, et al. Safety, tolerability, pharmacokinetics, and pharmacodynamics of the CGRP binding monoclonal antibody LY2951742 (galcanezumab) in healthy volunteers. Front Pharmacol. 2017;8:740. [DOI] [PMC free article] [PubMed] [Google Scholar]
- 8. Kielbasa W, Williams DW, Coutant DE, King A, Ayan‐Oshodi MA. Tolerability, Pharmacokinetics, and Pharmacodynamics of Galcanezumab in Healthy Subjects Following a Subcutaneous Administration of a Lyophilized Formulation or a Solution Formulation. 59th Annual Scientific Meeting of the American Headache Society; June 8‐11, 2017. Boston, MA. [Google Scholar]
- 9. Nakano M, Uenaka K, Kielbasa W, Matsuyama Y, Ayan‐Oshodi MA. Safety, tolerability, pharmacokinetics, and pharmacodynamics of galcanezumab, a monoclonal antibody to calcitonin gene‐related peptide, in healthy Japanese and Caucasian subjects. Rinshο yakuri/Jpn J Clin Pharmacol Ther. 2017;48(4):131‐139. [Google Scholar]
- 10. Kielbasa W, Helton D. A new era for migraine: pharmacokinetic and pharmacodynamic insights into monoclonal antibodies with a focus on galcanezumab, an anti‐CGRP antibody. Cephalalgia. 2019;39(10):1284‐1297. [DOI] [PMC free article] [PubMed] [Google Scholar]
- 11. Oakes TMM, Skljarevski V, Zhang Q, et al. Safety of galcanezumab in patients with episodic migraine: a randomized placebo‐controlled dose‐ranging phase 2b study. Cephalalgia. 2018;38(6):1015‐1025. [DOI] [PubMed] [Google Scholar]
- 12. Bergstrand M, Hooker AC, Wallin JE, Karlsson MO. Prediction‐corrected visual predictive checks for diagnosing nonlinear mixed‐effects models. AAPS J. 2011;13(2):143‐151. [DOI] [PMC free article] [PubMed] [Google Scholar]
- 13. Lobo ED, Hansen RJ, Balthasar JP. Antibody pharmacokinetics and pharmacodynamics. J Pharm Sci. 2004;93(11):2645‐2668. [DOI] [PubMed] [Google Scholar]
- 14. Wang W, Wang EQ, Balthasar JP. Monoclonal antibody pharmacokinetics and pharmacodynamics. Clin Pharmacol Ther. 2008;84(5):548‐558. [DOI] [PubMed] [Google Scholar]
- 15. Emgality (package insert) . Indianapolis, IN: Eli Lilly and Company; 2018. [Google Scholar]
- 16. Harding FA, Stickler MM, Razo J, DuBridge RB. The immunogenicity of humanized and fully human antibodies: residual immunogenicity resides in the CDR regions. MAbs. 2010;2(3):256‐265. [DOI] [PMC free article] [PubMed] [Google Scholar]
- 17. Martinez JM, Garce S, Anglin G, et al. Immunogenicity findings from phase 3 galcanezumab trials in patients with episodic or chronic migraine. 12th European Headache Federation Congress jointly with 32nd National Congress of the Italian Society for the Study of Headaches [P25]. J Headache Pain. 2018;19(suppl 1):80.30238173 [Google Scholar]
- 18. Meibohm B, Zhou H. Characterizing the impact of renal impairment on the clinical pharmacology of biologics. J Clin Pharmacol. 2012;52(1 Suppl):54S‐62S. [DOI] [PubMed] [Google Scholar]
- 19. Mould DR, Meibohm B. Drug development of therapeutic monoclonal antibodies. BioDrugs. 2016;30(4):275‐293. [DOI] [PubMed] [Google Scholar]
- 20. Roberts BV, Susano I, Gipson DS, Trachtman H, Joy MS. Contribution of renal and non‐renal clearance on increased total clearance of adalimumab in glomerular disease. J Clin Pharmacol. 2013;53(9):919‐924. [DOI] [PubMed] [Google Scholar]
- 21. Struemper H, Chen C, Cai W. Population pharmacokinetics of belimumab following intravenous administration in patients with systemic lupus erythematosus. J Clin Pharmacol. 2013;53(7):711‐720. [DOI] [PubMed] [Google Scholar]
Associated Data
This section collects any data citations, data availability statements, or supplementary materials included in this article.
Supplementary Materials
Supplemental Figure S1.
Supplemental Figure S2.
Supplemental Figure S3.
Supplemental Table S1. Descriptive Statistics of Demographic and Laboratory Data
Supplemental Table S2. Summary of Covariate Models
Supplemental Figure S1. Frequency distribution of the percentage of observed galcanezumab concentrations relative to time from previous dose.
Supplemental Figure S2. Prediction‐corrected visual predictive check for the final PK model.
Supplemental Figure S3. Prediction‐corrected visual predictive check across studies for the final PK model.


