

Summary
Centrioles are vital cellular structures that organise centrosomes and cilia. Due to their subresolutional size, centriole ultrastructural features have been traditionally analysed by electron microscopy. Here we present an adaptation of magnified analysis of the proteome expansion microscopy method, to be used for a robust analysis of centriole number, duplication status, length, structural abnormalities and ciliation by conventional optical microscopes. The method allows the analysis of centriole's structural features from large populations of adherent and nonadherent cells and multiciliated cultures. We validate the method using EM and superresolution microscopy and show that it can be used as an affordable and reliable alternative to electron microscopy in the analysis of centrioles and cilia in various cell cultures.
Lay Description
Centrioles are microtubule‐based structures organised as ninefold symmetrical cylinders which are, in human cells, ∼500 nm long and ∼230 nm wide. Centrioles assemble dozens of proteins around them forming centrosomes, which nucleate microtubules and organise spindle poles in mitosis. Centrioles, in addition, assemble cilia and flagella, two critically important organelles for signalling and motility. Due to centriole small size, electron microscopy has been a major imaging technique for the analysis of their ultrastructural features. However, being technically demanding, electron microscopy it is not easily available to the researchers and it is rarely used to collect large datasets. Expansion microscopy is an emerging approach in which biological specimens are embedded in a swellable polymer and isotopically expanded several fold. Physical separation of cellular structures allows the analysis of, otherwise unresolvable, structures by conventional optical microscopes. We present an adaptation of expansion microscopy approach, specifically developed for a robust analysis of centrioles and cilia. Our protocol can be used for the analysis of centriole number, duplication status, length, localisation of various centrosomal components and ciliation from large populations of cultured adherent and nonadherent cells and multiciliated cultures. We validate the method against electron microscopy and superresolution microscopy and demonstrate that it can be used as an accessible and reliable alternative to electron microscopy.
Keywords: Acetylated tubulin, centriole, cilia, electron microscopy, expansion microscopy
Introduction
Centrioles are microtubule‐(MT) based cylindrical assemblies (Fig. 3A) that build centrosomes and cilia (Vorobjev & Chentsov Yu, 1982; Winey & O'Toole, 2014) and organise poles of mitotic spindles. Mammalian centrioles are comprised of nine MT triplets arranged in a rotational ninefold symmetry. They are ∼500 nm long and ∼230 nm wide. The number of centrioles can vary between different types of cells. Although cycling cells harbour only two centrioles, which may be single or duplicated (associated with an orthogonally positioned growing procentriole), some differentiated cells, such as epithelial tracheal cells, undergo a dramatic centriole amplification process during which they generate hundreds of centrioles, which subsequently assemble hundreds of motile cilia on their surface (Anderson & Brenner, 1971; Vladar & Brody, 2013). Centriolar numerical and structural anomalies, which include centriole over‐elongation, are common for a variety of human cancers for which they are also an underlying cause (Nigg & Raff, 2009; Levine et al., 2017; Nigg et al., 2017; Nigg & Holland, 2018).
Figure 3.
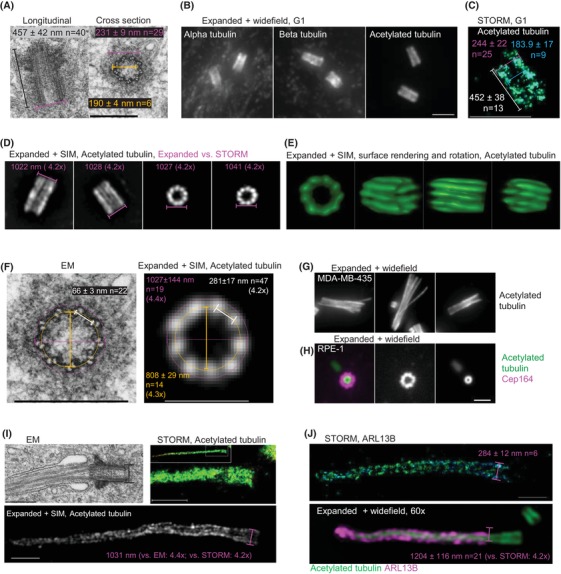
Validation of cMAP protocol for isotropic expansion of centrioles, basal bodies and cilia. (A) Electron micrographs of centrioles from RPE‐1 cells in G1 phase. (B) Representative widefield images of expanded centrioles from G1 cells labelled for alpha, beta and acetylated tubulin. (C) STORM image of a centriole immunolabelled for acetylated tubulin. A central section through the centriole is shown. (D) Expanded and labelled centrioles imaged by SIM. The width of the signals and the expansion factor calculated in comparison to the average STORM signal is marked in magenta. (E) Surface rendering of one expanded centriole to illustrate the distribution of nine sets of microtubules. (F) Comparative analysis of centrioles analysed by EM and expansion. Magenta: the outer centriole diameter; yellow: the central centriole diameter, white: the distance between adjacent B tubules (see Methods for more details). The measured values from EM and SIM recordings reveal the preservation of centriolar ninefold architecture and an average 4.3× expansion. (G) Examples of centrioles labelled by acetylated tubulin from MDA‐MB‐435 cells, known to have over‐elongated and structurally aberrant centrioles. (H) Example a mother centriole from G1 RPE‐1 cell labelled for acetylated tubulin and distal appendage marker Cep164. (I) Comparative EM/STORM/expansion analysis of a primary cilium from RPE‐1 cell. (J) Comparative STORM/expansion analysis of ciliary component ARL13B in RPE‐1 cells. Scale bars: 0.4 µm for EM, 2 µm for widefield in (B) and (D), (G) and (H), 1 µm for SIM in (F), 0.5 µm for STORM.
The analysis of centriolar structural features in cells has been traditionally performed by the electron microscopy (EM), which is laborious, often unavailable to researchers, and unsuitable for the collection of large data sets required for rigorous statistical analyses. Additionally, centriolar and centrosomal proteins tend to form aggregates, which can easily be mistaken for bona‐fide centrioles or centrosomes during analysis of immunolabelled samples. This poses a major problem in the centrosome field, as the conclusions obtained by conventional fluorescent microscopy are often left uncorroborated due to the lack of ultrastructural analysis.
Expansion microscopy is a quickly growing collection of sample preparation techniques based on the forming a swellable polymer within a specimen and crosslinking specimen components to the polymer network, followed by physical expansion of the polymer in water. This results in the isotropic expansion of both, the polymer and specimen components, which improves optical resolution (Geertsema & Ewers, 2016; Alon et al., 2019; Tillberg & Chen, 2019; Wassie et al., 2019).
Most expansion protocols are based on the original approach developed by the Boyden laboratory (Chen et al., 2015), in which immunofluorescent moieties are chemically crosslinked to the polymer prior to enzymatic digestion of proteins before expansion. This approach requires dense labelling before expansion, which may not be easily achievable for some proteins due to antibody epitope hindrance. Another approach developed by the Chang lab termed magnified analysis of the proteome (MAP) (Ku et al., 2016), uses different crosslinking chemistry and protein denaturation instead of enzymatic digestion before expansion. In MAP, cellular proteins crosslinked to the polymer are denatured under stringent temperature and detergent conditions (Fig. 1A). Proteins of interest are then immunolabelled, which may in some cases, enhance the accessibility of otherwise blocked epitopes and improve detection due to the initial expansion of the specimen before immunolabelling (Fig. 1, Tillberg et al., 2016). Expansion microscopy has been successfully used for the analysis of a variety of cellular structures and organelles from diverse biological specimens, including cultured cells, unicellular organisms and tissues (Cahoon et al., 2017; Halpern et al., 2017; Asano et al., 2018; Gao et al., 2018). However, its efficacy for isotropic expansion and a routine analysis of centrioles and cilia within cultured cells is yet to be proven.
Figure 1.
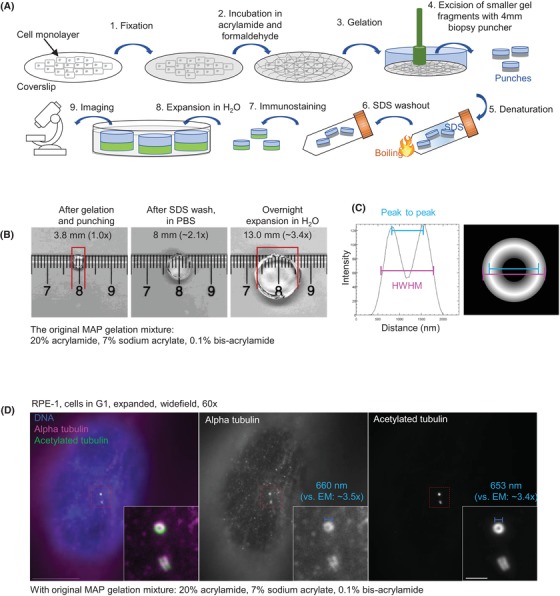
Centriole expansion and detection using the original MAP polymerisation mixture. (A) A scheme illustrating major steps of the expansion protocol. (B) The size of the polymerised gel was determined after excision by a puncher, after SDS washout, and after the overnight expansion in water. The measurements of the gel size indicate ∼3.5× expansion. (C) The width of expanded and labelled centrioles was determined from intensity plots, by measuring either the length of the signal at half‐width at half maxima (HWHM), or between two peaks of intensity (peak‐to‐peak distance, P‐P). (D) Centriole microtubules were labelled with antibodies for alpha tubulin and acetylated tubulin. Alpha tubulin yielded an uneven staining across centriole MT walls. Acetylated tubulin signal showed a strong and uniformed labelling. Centriole diameter was measured and compared with an average central diameter obtained from electron micrographs (190 ± 4 nm, n = 6), which indicated the expansion of 3.5× and 3.4×. Scale bars: 20 and 2 µm (insert).
In this work, we provide an adaptation of the original MAP protocol for a robust, reliable and tuneable expansion and detection of centrioles and cilia in a variety of mammalian cells. We extensively validate our approach, which we named centriole‐MAP (cMAP), by comparing centriolar and ciliary features obtained by expansion to the ones obtained by electron and super resolution microscopy. We demonstrate that cMAP can be used as an accessible alternative to EM for the studies of centriole number, duplication, structural features and ciliation.
Results
Modification of the original MAP method
At the onset, we used the gel composition of the original MAP, but modified gelation and denaturation steps, as detailed in material and methods. To visualise centriole MTs after expansion, we first thought to use standard alpha and beta tubulin antibodies to label centrioles. However, this resulted in unreproducible detection of centrioles across a cell population and tubulin signal which was unevenly distributed along centriole MT walls (Figs. 1D and 3B). A comparison with EM data indicated a ∼3.5× expansion factor, which was also consistent with the gel size measured before and after expansion (Figs. 1B, D). Similar expansion factor and poor centriole labelling using alpha tubulin antibody with MAP has recently been reported (Gambarotto et al., 2019). To investigate whether the cause of poor centriole labelling lies in the choice of the antibody, we tested the antibody against acetylated tubulin. Acetylation is a posttranslational modification found on stable MTs, centrioles and ciliary axonemes (Piperno & Fuller, 1985; Piperno et al., 1987) and it is widely used to detect these structures by immunofluorescence. We found that, contrary to the signal for alpha and beta tubulin, the acetylated tubulin signal was homogenously distributed along the centriole MT wall, and strongly marked centrioles in every cell (Figs. 1D and 3B).
Having identified an effective marker for centrioles, we explored the means to adjust the expansion factor to ∼4×, which is most commonly used in expansion experiments (Chozinski et al., 2016; Tillberg et al., 2016; Cahoon et al., 2017; Halpern et al., 2017; Gambarotto et al., 2019). Various strategies have been used to reach different levels of micromolecular expansion. For instance, varying fixation protocol, using different combinations of acrylamide, sodium acrylate (a swellable component of the gel) and bis‐acrylamide (a crosslinking component) during gelation and incubating expanded gels in buffers of different osmolarities (Ku et al., 2016; Halpern et al., 2017; Gambarotto et al., 2019). However, we aimed to develop a protocol which will support any conventional fixation method and allow tuning of the expansion factor using the original acrylamide and sodium acrylate concentrations, not to compromise the robustness of the gel. So, we explored whether changing the concentration of only the crosslinking component, bis‐acrylamide, can be used to adjust the expansion factor, while preserving isotropic expansion of centrioles. Indeed, after changing only the concentrations of bis‐acrylamide from 0.2% to 0.02%, both, gels and centrioles expanded comparably from ∼3× to 5× (Fig. 2). Acetylated tubulin robustly labelled centrioles regardless of the expansion factor. However, samples expanded ∼5× were more difficult to image with oil objectives, especially if centrioles were positioned deeper in cells.
Figure 2.
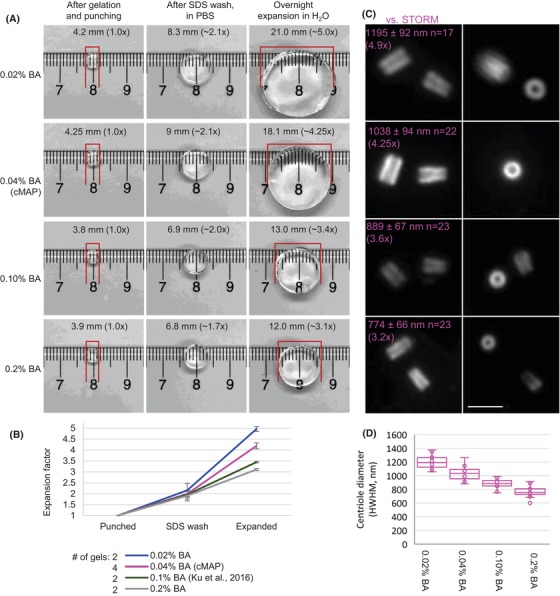
Centriole expansion and detection using various concentrations of bis‐acrylamide in polymerisation mixture. (A) Comparison of gel sizes using various concentrations of bis‐acrylamide (BA). Gels were measured immediately after excision by a puncher, after SDS washout, and after overnight expansion in water. Gel sizes indicated a scalable expansion from ∼3.1× to 5×. (B) Plot showing an average expansion factor calculated from two to four independent gel punches. Error bars are standard deviation of the mean. (C) Centrioles from the same punches shown in (A) were labelled with antibodies recognising acetylated tubulin. (D) Centriole diameters were measured (using HWHM method, Fig. 1C) and the average values were compared to the average width of the acetylated tubulin STORM signal (244 ± 22 nm, n = 25), which indicated the expansion from 3.2× to 4.9×. Scale bar: 2 µm.
The protocol using 0.04% of bis‐acrylamide which yielded a centriole expansion factor of 4.2× was further optimised for centriole immunolabelling and DNA staining. We named it centriole‐MAP (cMAP) and rigorously tested its aptness for centriole and cilia analysis.
cMAP accurately reflects centriole width and length
To determine whether acetylated tubulin signals of expanded centrioles accurately reflects centriole dimensions, we first compared the width of the acetylated tubulin signals from expanded samples [imaged by conventional widefield microscopy or Structured Illumination Microscopy (SIM)] with the width of the acetylated tubulin signals from nonexpanded cells obtained by Stochastic Optical Reconstruction Microscopy (STORM) (Figs. 3C–E). The expanded centrioles were on average 4.2× larger in diameter in comparison with STORM, and 4.3× in comparison with EM (Fig. 3F). Using SIM, nine acetylated densities were easily distinguished along the centriole barrel, the spatial arrangement of which corresponded to the ninefold arrangement of centriole MT triplets as detected by EM (Figs. 3D–F).
To assess whether acetylated tubulin signals accurately reflect centriole length, we compared the average length of acetylated tubulin signals of expanded mature centrioles in RPE‐1 cells (1983 ± 158 nm, n = 47) with the average length of centriole MTs obtained by EM (457 ± 42 nm, n = 40). The average acetylated tubulin signal was 4.3× longer, in agreement with the expected expansion factor, and demonstrated that cMAP accurately reflects centriole length. Additionally, cMAP reliably revealed overly long and structurally aberrant centrioles in MDA‐MB‐435 cells, which are known to harbour such centriolar aberrations (Marteil et al., 2018) (Fig. 3G), confirming that acetylated tubulin signal can be reliably used to detect variations in centriole length and their structural aberrations. cMAP also allows detection of distal appendage protein Cep164 (Fig. 3H), which specifically decorates the oldest, fully mature centrioles and allows cilia formation and functioning (Graser et al., 2007; Bowler et al., 2019). Thus, cMAP can be used to determine the relative age of and maturation status of centrioles.
cMAP can be used for the analysis of basal bodies and cilia
We also tested whether cMAP is suitable for the analysis of basal bodies and cilia, by comparing the distribution of acetylated tubulin signal and ciliary component ARL13B (Hori et al., 2008) by STORM, EM and after expansion (Figs. 3I, J). The analysis of RPE‐1 cells revealed that both ciliary axonemes and ARL13B can be robustly and reliably detected by cMAP.
cMAP accurately reflects centriole duplication status and centriole number
To determine whether acetylated tubulin labelling faithfully detects procentrioles which are initially short, immature and, hence, possibly less acetylated, we analysed procentrioles from their earliest, initiation stage in early S, through S, G2, mitosis and the following G1. Mitotic cells were collected by shake off, re‐plated and expanded using cMAP at various phases of the cell cycle. Shorter acetylated signals adjacent to mother centrioles were easily detectable already in early S (9–10 h after shaking off), strongly labelling the proximal ends of procentrioles (Figs. 4A, B). We concluded that acetylated tubulin can be used as a reliable marker for centriole duplication status. Procentriole‐associated acetylated tubulin signal elongated from early S until G1. Interestingly, however, the width of procentriole acetylated tubulin signals remained smaller than that of mature centrioles, even in elongated procentrioles in mitosis and early G1 (Figs. 4A, B). Comparative STORM analysis confirmed that procentriole‐associated acetylated tubulin signal is narrower and less abundant (Fig. 4C), as detected after expansion. Considering that the diameter of human procentrioles in mitosis and early G1 is ∼220 nm, our data suggest that acetylation of procentriole MTs occurs progressively from proximal towards distal ends and from inner towards outer MTs and is not completed before centriole's first middle G1 phase. This pattern of procentriole acetylation was present in all analysed human and mouse cell lines (not shown).
Figure 4.
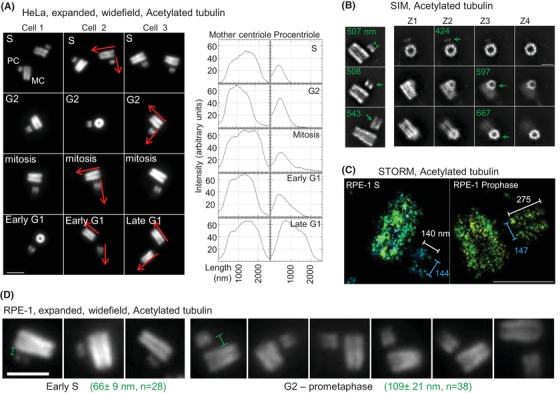
cMAP can be used for the analysis of centriole duplication status. (A) Examples of expanded duplicated centrioles from S to the following G1 phase of the cell cycle, labelled for acetylated tubulin. Short and narrow acetylated tubulin signal is associated with mother centrioles (MC), indicating the site of procentrioles (PC). As PCs elongate, their acetylated tubulin signal increases in length and intensity. Centrioles used for intensity plots are marked by red arrows. (B) SIM analysis of duplicated expanded centrioles indicate PC‐associated acetylated signal (green arrows) localised in nine discrete signals but in a smaller diameter than in MCs. PC diameter is indicated in green. (C) The analysis of acetylated tubulin signal in nonexpanded samples by STORM reveals a narrower signal associated even with elongated procentriole in prophase. (D) The analysis of intracentrosomal mother centriole‐procentriole distances. Several examples of duplicated centrioles are shown. Measured average distance ± SD between acetylated tubulin signals in S phase and in G2 phase – prometaphase is indicated in green. Scale bars: 2 µm for SIM and widefield, 0.5 µm for STORM.
From procentriole initiation in early S phase until mitotic entry, the physical distance between mother centrioles and procentrioles increases (Shukla et al., 2015). The measurements of intercentrosomal centriole distance was detectable after expansion, as illustrated in Figures 4(A) and (D).
cMAP can be used to study centriole amplification and ciliation in multiciliated cells
Next, we tested whether cMAP can be used to study centriole and cilia biogenesis in multiciliated cells. For this purpose, tracheal epithelial cells (mTEC) were grown to a high density on Transwell‐Clear permeable filters and differentiated to induce centriole amplification and multiciliation (You et al., 2002; Vladar & Brody, 2013). During the centriole amplification phase, hundreds of procentrioles form around mother centrioles and specialised structures called deuterosomes near the apical region of the cells. Procentrioles are then released from deuterosomes and mother centrioles and travel to the apical part of the cell where they initiate ciliogenesis. cMAP allowed us to faithfully distinguish all stages of centriole amplification from early procentrioles associated with deuterosomes and mother centrioles, to the fully mature ciliated stage (Fig. 5 and Videos 1–3). The analysis of the width of the acetylated tubulin signal of amplified and released centrioles (Fig. 6 and Video 2) confirmed a ∼4.2× isotropic expansion throughout the apical part of the cell, highlighting the applicability of cMAP to study centriole formation and ciliogenesis in complex and diverse cell culture models such as differentiated mTEC cells.
Figure 5.
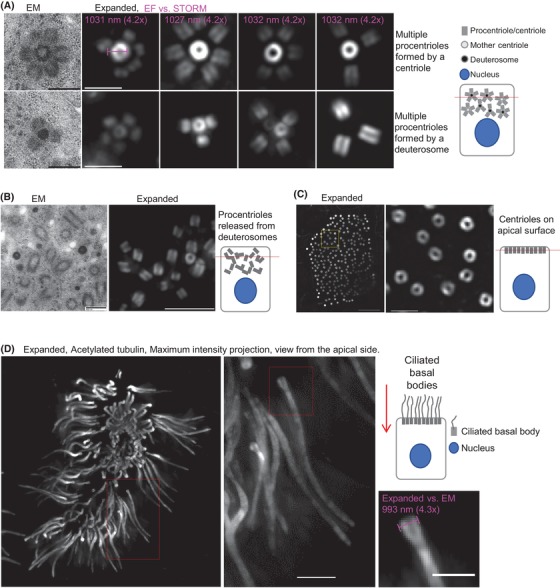
Isotropic expansion and detection of amplified centrioles and cilia in differentiated mTEC cells. (A) Centriole amplification stage in mouse mTEC cells showing variable numbers of procentrioles formed around mother centrioles and deuterosomes (see also Video 1). Measurements of mother centriole diameter reveal a 4.2× expansion factor in comparison with acetylated tubulin STORM signal (in magenta). (B) Numerous procentrioles in various orientations released from deuterosomes and mother centrioles (see also Video 2). (C) A section through a cell with procentrioles associated with apical cell surface (cartoon, red line) before ciliation. (D) An example of expanded multiciliated mTEC imaged from the apical cell surface (cartoon, red arrow), illustrating multicilia (see also Video 3). Scale bars for widefield: 2 µm in (A), 4 µm in (B), 4 µm (left) and 2 µm (right) in (C) and (D); EM in (A) and (B): 0.4 µm.
Figure 6.
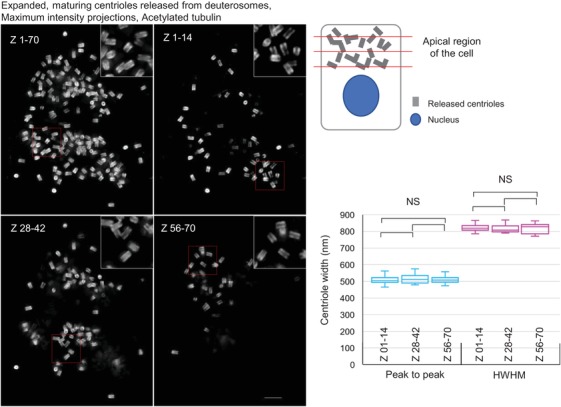
Isotropic expansion of amplified and released centrioles and ciliated basal bodies in mTEC cells. The width of expanded and labelled centrioles was determined from intensity plots at three different cell regions (cartoon, by red lines). Half‐width at half maxima (HWHM), or between two peaks of intensity (peak‐to‐peak distance) were measured (Fig. 1C). The measurements show an isotropic centriole expansion throughout 70 200 nm thick Z sections. Scale bar: 2 µm.
cMAP can be used to study centrioles from previously immunolabelled samples
Further, we explored whether cMAP can be used to expand preimmunolabelled samples. Cells fixed by methanol, formaldehyde or methanol/formaldehyde were immunolabelled, postfixed in formaldehyde and expanded by cMAP using acetylated tubulin as a centriole marker. Gels and centrioles uniformly expanded and acetylated tubulin labelling was efficient irrespective of the fixation method (Fig. 7), proving that cMAP can be used for immunofluorescence‐expansion correlative studies, regardless of the fixation approach used. The most exciting prospect is the possibility of correlative super resolution‐expansion studies, especially for the proteins which cannot be analysed directly by cMAP due to the low stoichiometry or the absence of expansion‐compatible antibodies.
Figure 7.
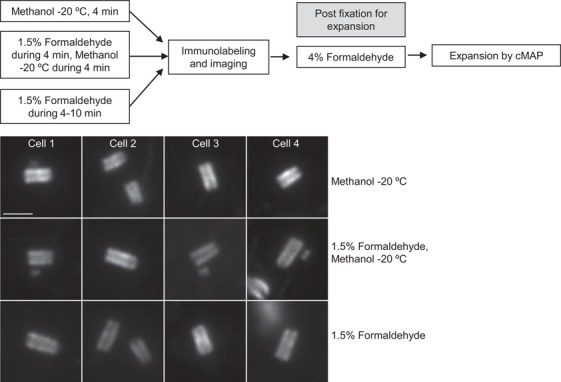
The analysis of centriole expansion after various fixation methods. Cells fixed by methanol, formaldehyde or methanol/formaldehyde were immunolabelled (see Methods and Supplementary Methods), postfixed in formaldehyde and expanded by cMAP, using acetylated tubulin as a centriole marker. Centrioles uniformly expanded and labelled irrespective of the fixation method. Scale bar: 2 µm.
cMAP can be used to study multiple centrosomal and ciliary proteins
Finally, we tested several additional commercial antibodies commonly used to detect centrosomal and ciliary components, for their ability to perform after expansion (Fig. 8). We found that cMAP is suitable for detection of pericentriolar component pericentrin (Doxsey et al., 1994; Mennella et al., 2012), centriole distal/ciliary protein Cep290 (Chang et al., 2006; Drivas & Bennett, 2014), centriole distal appendage proteins FBF‐1 and ANKRD26 (Tanos et al., 2013; Bowler et al., 2019), intercentrosome linker protein Rootletin (Yang et al., 2002; Vlijm et al., 2018), intraflagellar transport protein IFT88 (Schrick et al., 1995; Reilly & Benmerah, 2019) and ciliary transition zone protein RPGRIP1L (Arts et al., 2007; Shi et al., 2017). The signals of all proteins had the distribution as expected from previous reports, demonstrating the usefulness of cMAP in the detection of multiple centrosomal and ciliary apparatus components.
Figure 8.
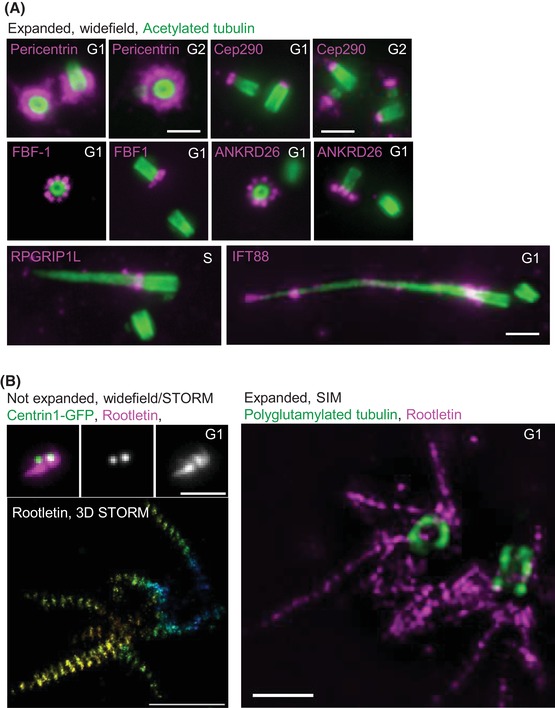
cMAP can be used to study multiple centrosomal and ciliary proteins. RPE‐1 cells were expanded using cMAP and immunolabelled against centrosomal and ciliary proteins. (A) Pericentrin, a pericentriolar protein, surrounds mother centrioles. Cep290 labels distal ends of all centrioles. FBF‐1 and ANKRG286 are distal appendage proteins of older mother centrioles. PRGRIPL1 labels ciliary transition zone and IFT88 intraflagellar transport complex. (B) Correlative widefield and STORM analysis shows that Rootletin assembles striated fibres around two mother centrosomes, which are also detectable after expansion. Polyglutamylation of centriole microtubules is present on two centrioles. Scale bars: 2 µm for widefield and SIM, 0.5 µm for STORM.
Discussion
Here we present an expansion protocol called cMAP, specifically modified for a scalable, and reproducible analysis of centriole length, structural aberrations, number and age from a variety of mammalian cell types. We demonstrate that cMAP goes beyond centriole analysis in flat cell monolayers and that it can be applied for the studies of centriole and cilia even in complex and hard to image samples such as multiciliated cells and that it can be used to detect a variety of centrosomal and ciliary proteins. We also show that the expansion factor can be controllably regulated by modifying only one component of the gel, bis‐acrylamide. This is an important practical detail, because reducing the expansion factor to 3× will facilitate the analysis of thicker specimens or rounded cells.
By directly comparing the data obtained after expansion, superresolution and electron microscopy, we demonstrate that expansion microscopy can be used as a useful alternative to superresolution methods in order to identify subtle details in centriolar and ciliary organisation. However, although cMAP is a remarkable new tool to study centrosome's and ciliary ultrastructural features, we maintain that it is yet to be proven to what extent expansion microscopy allows the discovery of novel nanoscale features of centrioles and cilia. We base this reservation on our longstanding observation that even after the most careful approach and troubleshooting, some centrosomal components still do not show identical characteristics after comparative analyses with more conventional methods. For instance, although we could reproducibly detect nine densities corresponding to nine centriole appendages using Cep164 antibody (Fig. 3H), a detailed localisation pattern as we previously observed by STORM (Bowler et al., 2019) is not obvious after expansion. Another example is the attempt of us and others to use the antibody against alpha tubulin for centriole labelling. We found that this antibody poorly labels centriole MT within human cells after expansion (Fig. 1D). Only a direct side‐by side comparison with acetylated tubulin antibody convinced us that uneven centriole labelling was not a consequence of a deficiency inherent to the MAP method, but rather a consequence of a poor epitope labelling after expansion, the exact reason of which remains unclear.
In conclusion, cMAP is a novel, reliable tool, which can be used as an affordable alternative to EM in the analysis of centriole number, duplication, length, structural integrity and ciliation in a variety of cell cultures.
Materials and methods
Cell culture
HeLa (Piel et al., 2000), U2OS and RPE‐1 (Uetake et al., 2007) cells constitutively express centrin1‐GFP (C1‐GFP). MDA‐MB‐435 human cells are from the DTP/DCTD‐NCI Tumor Repository. All cell lines were grown in DMEM medium (Invitrogen) supplemented with 10% foetal bovine serum (FBS) (Omega Scientific) and 1% penicillin/streptomycin (Gibco) at 37°C in a humified environment with 5% CO2. To synchronise HeLa cells, we used mitotic shake off. Cells were detached by tapping on the flask of logarithmically growing cells, and re‐plated on round 25 mm, 1.5 high precision cover glasses (Warner Instruments). After offer‐plating, cells enter G1 phase within ∼1 h, S phase within ∼9 h, G2 phase within ∼18 h and mitosis ∼20 h.
Identifying cell cycle stages
During microscopy, cell cycle phases were identified as follows: G1 was recognised by the presence of two single C1‐GFP signals and/or the presence of the midbody between two sister cells. Early G1 was recognised by the proximity of the sister cells, their round shape and midbody. In S phase, cells contained duplicated centrioles (four C1‐GFP signals) and closely positioned centrosomes. G2 was identified by two centrosomes moved at the opposite part of the cell. Prophase was identified by DNA condensation. Mitosis was recognised by characteristic mitotic DNA morphology.
mTEC cell culture and differentiation
Cultures were established as previously described (Nanjundappa et al., 2019). Briefly, C57BL/6 mice were sacrificed at 2–4 months of age, trachea were excised, opened longitudinally to expose the lumen, and placed in 1.5 mg mL–1 Pronase E in DMEM/F12 medium (Life Technologies) at 4°C overnight. Tracheal epithelial cells were dislodged by gentle agitation and collected in DMEM/F12 with 10% FBS. After centrifugation, cells were treated with 0.5 mg mL–1 DNase I for 5 min on ice and centrifuged at 4°C for 10 min at 400 g. Cells were resuspended in DMEM/F12 with 10% FBS and plated in a tissue culture dish for 5 h at 37°C with 5% CO2 to adhere contaminating fibroblasts. Nonadhered cells were then collected, concentrated by centrifugation, resuspended in an appropriate volume of mTEC‐Plus medium and seeded onto Transwell‐Clear permeable filter supports (Corning). Air–liquid interface was established 2 d after cells reached confluence by feeding mTEC‐Serum‐Free medium only in the lower chamber. Cells were cultured at 37°C with 5% CO2, and media replaced every 2 days, and fixed on the indicated days. Media were supplemented with 100 U mL–1 penicillin, 100 mg mL–1 streptomycin and 0.25 mg mL–1 Fungizone (all obtained from Life Technologies).
Conventional immunostaining (for nonexpanded samples)
Cells were fixed in cold methanol (4–6 min) at −20°C or in 1.5% formaldehyde (2–4 min) at RT followed by methanol for (1–4 min) at −20°C. Cells were rehydrated in 1× PBS for 30 min and incubated with IF buffer [IF buffer: 1% BSA (Sigma A9647) and 0.05% Tween‐20 (Sigma) in PBS] for 15 min. Samples were treated with primary antibody diluted in IF buffer for 1 h at 37°C or overnight at 4°C. Following the wash in 1× PBS, cells were incubated with secondary antibody diluted in IF buffer for 1–2 h at 37°C and DNA was labelled with Hoechst (Invitrogen; 33342) diluted 1:4000 (WF or SIM) or 1:16 000 (STORM) in 1× PBS. For widefield imaging, samples were mounted onto microscope slides or in Attofluor Cell chambers (Thermo Fisher; A7816). The following antibodies were used: mouse anti‐acetylated tubulin (Sigma; T7451) at 1:10 000, mouse anti‐alpha tubulin (Sigma; T6074) at 1:4000, rabbit anti‐ARL13B (Abcam; ab83879) at 1:300, mouse anti‐Rootletin (Santa Cruz; sc‐374056) at 1:200. Conjugated secondary antibodies CF647 antimouse 20042, CF647 antirabbit 20045, CF568 antirabbit 20099 (Biotium), AF488 antimouse A11019 and AF488 antirabbit A11034 (Invitrogen) were used at a 1:800 dilution.
Expansion using cMAP protocol
Cell preparation and fixation
Cells growing on glass coverslips or Transwell‐Clear permeable filters (mTEC cultures) were fixed (or postfixed after immunostaining, see Fig. 7) with 4% formaldehyde (Electron Microscopy Sciences; 15686) in 1× PBS at RT for 1 h.
Acrylamide incubation, gelation and punching
After fixation, the coverslips and Transwell filters were incubated at 40°C for 16 h in a solution containing 30% acrylamide (Sigma; A4058) and 4% formaldehyde in 1× PBS. Following three 10 min, 1× PBS washes, 25 mm round coverslips were placed (cell‐side facing up) on a parafilm‐covered Petri dish floating in an ice water bath. Alternatively, Transwell filters were placed on the top of the coverslip. Precooled gelation reagents were combined in chilled 1× PBS at the following final concentrations: 20% acrylamide, 7% sodium acrylate (Sigma; A4058), 0.04% bis‐acrylamide (Sigma; A9926), 0.5% APS (Biorad; 161–0700) and 0.5% TEMED (Biorad; 161–0801), with APS and TEMED added just before application. Gelling solution (0.5–1 mL per coverslip) (prepared during the last PBS wash) was quickly transferred to the coverslips, incubated on ice for 20 min (not in the original MAP protocol) and then moved to RT for 1.5 h. Following gel polymerisation, a 4 mm biopsy punch (Integra Miltex) was used to excise several ‘punches’ from each gelled sample.
Denaturation
Punches were preheated at >90°C for 10 min in 50 mL falcon tubes (not in the original MAP protocol). SDS solution (200 mM SDS, 200 mM NaCl, 50 mM TRIS, pH 9) preheated at >90°C was added to the tubes. The tubes maintained at >90°C for 1 h, with mixing every 10 min and then cooled to room temperature. SDS was removed by exchanging the 1× PBS every 20 min for the first 2–3 h followed by an overnight incubation in 1× PBS at 4°C.
Immunostaining
Punches were blocked in IF buffer (1% BSA and 0.05% Tween‐20 in PBS) for 1–2 h at RT, followed by the incubation with primary antibody diluted in IF buffer, for 24 h at 4°C. Punches were washed in 1× PBS for 1–2 h and incubated for 24 h at 4°C with secondary antibody and DAPI (ThermoFisher; D1306) diluted 1:10 000 in IF buffer. The following primary antibodies were used for immunostaining of expanded samples: mouse anti‐acetylated tubulin (Sigma, T7451) at 1:4000, mouse anti‐alpha tubulin (Sigma; T6074) at 1:500, rabbit antibeta tubulin (Abcam; ab15568) at 1:250, rabbit anti‐ARL13B (Abcam; ab83879) at 1:150, rabbit anti‐Cep164 (Proteintech; 22227‐1‐AP) at 1:500, rabbit anti‐ANKRD26 (GeneTex; GTX128255) at 1:200, rabbit anti‐FBF1 (sigma; HPA023677) at 1:100, rabbit anti‐RPGRIP1L (Proteintech; 55160‐1‐AP) at 1:150, rabbit anti‐IFT88 (Proteintech; 13967‐1‐AP) at 1:150, mouse anti‐Rootletin (Santa Cruz; sc‐374056) at 1:50, rabbit antipericentrin (Abcam; ab4448) at 1:400, rabbit anti‐Cep290 (Abcam; ab84870) at 1:150 and rabbit antipolyglutamylated tubulin (AdipoGen; AG‐25B‐0030) at 1:800. Secondary antibodies antimouse Alexa Fluor 488 (Invitrogen; A11029), antirabbit Alexa Fluor 488 (Invitrogen; A11034), antimouse Alexa Fluor 555 (Invitrogen; A28180), antirabbit Alexa Fluor 555 (Invitrogen; A21429) were used at a 1:800 dilution to label primary antibodies.
Expansion and mounting
After immunostaining, the samples were expanded in dH2O for 2 h at RT with dH2O exchange every 10 min. Samples were then left in dH2O overnight at 4°C for full expansion. Prior to imaging, expanded punches were mounted in Rose Chambers, Attofluor cell chambers (Thermo Fisher) or glass bottom Microwell dish (MatTek; P35G‐1.5‐14‐C).
Widefield microscopy
Widefield imaging was performed with an inverted Eclipse Ti microscope (Nikon Inc.), with a 6.4 µm pixel OrcaFlash4 camera (Hamamatsu), Intensilight C‐HGFIE illuminator, 60× NA 1.45, 40× NA 1.45 or 20× NA 0.75, or Plan Apo objective with 1.5× magnifying tube lens. Z‐sections, 200 nm (using 60× objective) or 400 nm (using 20× and 40× objectives) thick, spanning entire centrioles or entire cells were acquired, as needed.
Structured illumination microscopy (SIM)
SIM was performed using N‐SIM, Nikon Inc., equipped with 405, 488, 561 and 640 nm excitation lasers, Apo TIRF 100× NA 1.49 Plan Apo oil objective and back‐illuminated 16 µm pixel EMCCD camera (Andor; DU897). Hundred nanometre thick Z‐sections were acquired in 3D SIM mode and reconstructed to generate a final image using Nikon NIS‐Elements software.
Stochastic optical reconstruction microscopy (STORM)
Cells were plated on round 25 mm, #1.5 high tolerance cover glasses (Warner Instruments), fixed and labelled with primary antibodies, followed by CF647‐conjugated FAB2 antibodies (Biotium) used at 1:800 dilution. Before STORM imaging, samples were layered with 100 nm tetra‐spectral fluorescent beads (Invitrogen), which served as fiducial markers. Coverslips were mounted in Attofluor Cell chambers (Thermo Fisher) and immersed in STORM buffer (25 mM β‐mercaptoethylamine, 0.5 mg mL–1 glucose oxidase, 67 µg mL–1 catalase, 10% dextrose, in 100 mM Tris, pH 8.0). 3D STORM imaging was performed on a Nikon N‐STORM4.0 system using Eclipse Ti inverted microscope, Apo TIRF 100X SA NA 1.49 Plan Apo oil objective, 405, 561 and 647 nm excitation laser launch and a back‐illuminated EMCCD camera (Andor; DU897). The 647 nm laser line (150 mW out of the fibre and ∼90 mW before the objective lens) was used to promote fluorophore blinking. The 405 nm laser was used to reactivate fluorophores throughout the imaging process. The 561 nm laser was used to record the signals of fiducial markers. Note that, 20 000–30 000 time points were acquired each 20 ms at a 50 Hz frame rate. NIS Elements (Nikon) was used to analyse the data. Prior to STORM imaging, centrioles labelled with Centrin1‐GFP and CF647‐labelled target proteins were recorded in widefield mode. 3D STORM data is presented as a projection of the entire or the central part of the 3D volume. A rainbow Z‐colour coding scheme was used, which typically spanned 650 nm of a working Z‐imaging range, labelling signals closer to the coverslip in red and further in blue. The original Z‐colour coding scheme was preserved in image panels.
Electron microscopy
For electron microscopy analysis, cells grown on coverslips or Transwell filters were fixed in 2.5% glutaraldehyde and 0.25% formaldehyde in 1× PBS (pH 7.4) for 1 h at room temperature, washed in PBS for 30 min (10 min each), prestained with 1% osmium tetroxide and 1% uranyl acetate, dehydrated in graded ethanol series and then embedded in EMbed‐812 resin. Eighty‐nanometre serial sections were sectioned, placed on the formvar‐coated copper grids, and further contrasted with uranyl acetate and lead citrate. Imaging was performed using FEI Spirit transmission electron microscope operating at 80 kV.
Image analysis, processing and data presentation
Image analysis and assembly was performed in Photoshop (Adobe) and Fiji (National Institute of Health, Bethesda, MD). Fiji and NIS‐Elements was used to measure signal intensity and centriole length and width. NIS‐Elements was used for surface rendering. AutoQuant X3 software (MediaCybernetics) was used for deconvolution of widefield images. Images were acquired under identical imaging settings for all samples within each experiment. The levels of fluorescent signals were sometimes differentially adjusted between different image panels, to improve the visibility of the dimmer signals. In some image panels, maximum intensity projections of all acquired Z slices spanning a part of the cell containing centrioles were presented. In some instances, to better illustrate centriole width and length or a specific point discussed in text, only central Z section is presented. The presentation method is indicated in figure legends or above figure panels.
Measurement of centriole length and width
The width and length of expanded centrioles was determined by measuring the width and the length of acetylated tubulin signal. Centriole width was determined by measuring the length of the acetylated signals at half‐width at half‐maxima (HWHM), or by measuring the distance between two maxima (peak to peak) (Fig. 1C), using the proximal portion of the centriole. The length of expanded centrioles was measured using HWHM criteria from longitudinally oriented centrioles. The width and the length of STORM signals was measured using the same criteria. To measure outer centriole diameter from electron micrographs, the distance between centriolar MTs (C tubules) was measured from longitudinally or cross sectioned centrioles. To measure the central centriole diameter, the diameter of the ring connecting middle centriolar MTs (B tubules) was determined from vertically sectioned centrioles. To determine the distance between adjacent centriolar MT triplets, distances between adjacent B tubules were measured from electron micrographs, of between adjacent lobules of acetylated tubulin in expanded samples after SIM imaging (Fig. 3F).
Calculation of expansion factor
Expansion factor of gel punches was determined comparing the size of the punch immediately after it was excised after gelation and during various steps in the expansion protocol until their maximal expansion in H2O (Figs. 1 and 2). To determine the expansion factor of expanded centrioles, the diameter of acetylated signals was determined and compared with the dimensions of acetylated signals obtained from nonexpanded centrioles after STORM imaging. In addition, the width of expanded acetylated signals determined by HWHM or P‐P method was compared to the average outer and central centriole diameter, respectively, determined from electron micrographs.
Statistical analysis
Statistical differences between two samples was determined in Excel using an unpaired, two‐tailed Student's t‐test. P values < 0.001 were considered statistically significant. Sample sizes are indicated in figure legends. A median line and upper and lower quartile are presented in box‐and‐whisker plots.
Author contributions
DK and NS troubleshooted expansion protocol and conducted mort experiments, analysed the data and prepared the manuscript. DK conducted EM. VM developed initial expansion protocol. RN and MRM grew mTEC cultures. CS helped with manuscript preparation. JL supervised the project, conducted EM/light microscopy, analysed the data and prepared the manuscript. All authors discussed the results and the manuscript.
Supporting information
Movie 1. mTEC‐ deuterosomes. A variable number of procentrioles is associated with two mother centrioles and numerous deuterosomes. The cell was expanded using cMAP and immunolabelled for acetylated tubulin. Near apical part of the cell was imaged using widefield and 60× oil lens. Hundred and one 200 nm thick Z sections were acquired and deconvolved.
Movie 2. mTEC cell‐released amplified centrioles. mTEC cells containing released amplified centrioles in random orientation. The cell was expanded using cMAP and immunolabelled for acetylated tubulin. Near apical part of the cell were imaged using widefield and 60× oil lens. Seventy‐four 200 nm thick Z sections were acquired and deconvolved.
Movie 3. mTEC cell with multicilia. The cell was expanded using cMAP and immunolabelled for acetylated tubulin. Apical part of the cell and protruding cilia were imaged using widefield and 60× oil lens. One hundred and fifty‐one 200 nm thick Z sections were acquired and deconvolved.
Acknowledgements
JL research was supported by the Intramural Research Program of the National Institutes of Health (NIH), National Cancer Institute, Center for Cancer Research and MRM by the National Institutes of Diabetes and Digestive and Kidney Diseases (R01‐DK108005).
Authors N. Sahabandu and D. Kong contributed equally.
References
- Alon, S. , Huynh, G.H. & Boyden, E.S. (2019) Expansion microscopy: enabling single cell analysis in intact biological systems. FEBS J. 286, 1482–1494. [DOI] [PMC free article] [PubMed] [Google Scholar]
- Anderson, R.G. & Brenner, R.M. (1971) The formation of basal bodies (centrioles) in the Rhesus monkey oviduct. J. Cell Biol. 50, 10–34. [DOI] [PMC free article] [PubMed] [Google Scholar]
- Arts, H.H ., Doherty, D. , van Beersum S.E.C. et al (2007) Mutations in the gene encoding the basal body protein RPGRIP1L, a nephrocystin‐4 interactor, cause Joubert syndrome. Nat. Genet. 39, 882–888. [DOI] [PubMed] [Google Scholar]
- Asano, S.M ., Gao, R. , Wassie, A.T. et al (2018) Expansion microscopy: protocols for imaging proteins and RNA in cells and tissues. Curr. Protoc. Cell Biol. 80, e56. [DOI] [PMC free article] [PubMed] [Google Scholar]
- Bowler, M ., Kong, D. , Sun, S. et al (2019) High‐resolution characterization of centriole distal appendage morphology and dynamics by correlative STORM and electron microscopy. Nat. Commun. 10, 993. [DOI] [PMC free article] [PubMed] [Google Scholar]
- Cahoon, C.K ., Yu, Z. , Wang, Y. et al (2017) Superresolution expansion microscopy reveals the three‐dimensional organization of the Drosophila synaptonemal complex. Proc. Natl. Acad. Sci. U.S.A. 114, E6857–E6866. [DOI] [PMC free article] [PubMed] [Google Scholar]
- Chang, B ., Khanna, H. , Hawes, N. et al (2006) In‐frame deletion in a novel centrosomal/ciliary protein CEP290/NPHP6 perturbs its interaction with RPGR and results in early‐onset retinal degeneration in the rd16 mouse. Hum. Mol. Genet. 15, 1847–1857. [DOI] [PMC free article] [PubMed] [Google Scholar]
- Chen, F. , Tillberg, P.W. & Boyden, E.S. (2015) Optical imaging. Expansion microscopy. Science (New York, N.Y.) 347, 543–548. [DOI] [PMC free article] [PubMed] [Google Scholar]
- Chozinski, T.J ., Halpern, A.R. , Okawa, H. et al (2016) Expansion microscopy with conventional antibodies and fluorescent proteins. Nat. Methods 13, 485–488. [DOI] [PMC free article] [PubMed] [Google Scholar]
- Doxsey, S.J. , Stein, P. , Evans, L. , Calarco, P.D. & Kirschner, M. (1994) Pericentrin, a highly conserved centrosome protein involved in microtubule organization. Cell 76, 639–650. [DOI] [PubMed] [Google Scholar]
- Drivas, T.G. & Bennett, J. (2014) CEP290 and the primary cilium. Adv. Exp. Med. Biol. 801, 519–525. [DOI] [PubMed] [Google Scholar]
- Gambarotto, D ., Zwettler, F.U. , Le Guennec, M. et al (2019) Imaging cellular ultrastructures using expansion microscopy (U‐ExM). Nat. Methods 16, 71–74. [DOI] [PMC free article] [PubMed] [Google Scholar]
- Gao, M ., Maraspini, R. , Beutel, O. et al (2018) Expansion stimulated emission depletion microscopy (ExSTED). ACS Nano 12, 4178–4185. [DOI] [PubMed] [Google Scholar]
- Geertsema, H. & Ewers, H . (2016) Expansion microscopy passes its first test. Nat. Methods 13, 481–482. [DOI] [PubMed] [Google Scholar]
- Graser, S ., Stierhof, Y.‐D. , Lavoie, S.B. et al (2007) Cep164, a novel centriole appendage protein required for primary cilium formation. J. Cell Biol. 179, 321–330. [DOI] [PMC free article] [PubMed] [Google Scholar]
- Halpern, A.R. , Alas, G.C.M. , Chozinski, T.J. , Paredez, A.R. & Vaughan, J.C . (2017) Hybrid structured illumination expansion microscopy reveals microbial cytoskeleton organization. ACS Nano 11, 12677–12686. [DOI] [PMC free article] [PubMed] [Google Scholar]
- Hori, Y. , Kobayashi, T. , Kikko, Y. , Kontani, K. & Katada, T. (2008) Domain architecture of the atypical Arf‐family GTPase Arl13b involved in cilia formation. Biochem. Biophys. Res. Commun. 373, 119–124. [DOI] [PubMed] [Google Scholar]
- Ku, T. , Swaney, J. , Park, J.Y. et al (2016) Multiplexed and scalable super‐resolution imaging of three‐dimensional protein localization in size‐adjustable tissues. Nat. Biotechnol. 34, 973–981. [DOI] [PMC free article] [PubMed] [Google Scholar]
- Levine, M.S . Bakker, B. , Boeckx, B. et al (2017) Centrosome amplification is sufficient to promote spontaneous tumorigenesis in mammals. Dev. Cell 40, 313–322.e315. [DOI] [PMC free article] [PubMed] [Google Scholar]
- Marteil, G ., Guerrero, A. , Vieira, A.F. et al (2018) Over‐elongation of centrioles in cancer promotes centriole amplification and chromosome missegregation. Nat. Commun. 9, 1258. [DOI] [PMC free article] [PubMed] [Google Scholar]
- Mennella, V ., Keszthelyi, B. , McDonald, K.L. et al (2012) Subdiffraction‐resolution fluorescence microscopy reveals a domain of the centrosome critical for pericentriolar material organization. Nat. Cell Biol. 14, 1159–1168. [DOI] [PMC free article] [PubMed] [Google Scholar]
- Nanjundappa, R ., Kong, D. , Shim, K. et al (2019) Regulation of cilia abundance in multiciliated cells. eLife 8, pii: e44039. [DOI] [PMC free article] [PubMed] [Google Scholar]
- Nigg, E.A. , Schnerch, D. & Ganier, O. (2017) Impact of centrosome aberrations on chromosome segregation and tissue architecture in cancer. Cold Spring Harb. Symp. Quant. Biol. 82, 137–144. [DOI] [PubMed] [Google Scholar]
- Nigg, E.A. & Raff, J.W. (2009) Centrioles, centrosomes, and cilia in health and disease. Cell 139, 663–678. [DOI] [PubMed] [Google Scholar]
- Nigg, E.A. & Holland, A.J . (2018) Once and only once: mechanisms of centriole duplication and their deregulation in disease. Nat. Rev. Mol. Cell. Biol. 19, 297–312. [DOI] [PMC free article] [PubMed] [Google Scholar]
- Piel, M. , Meyer, P. , Khodjakov, A. , Rieder, C.L. & Bornens, M. (2000) The respective contributions of the mother and daughter centrioles to centrosome activity and behavior in vertebrate cells. J. Cell Biol. 149, 317–330. [DOI] [PMC free article] [PubMed] [Google Scholar]
- Piperno, G. , LeDizet, M. & Chang, X.J. (1987) Microtubules containing acetylated alpha‐tubulin in mammalian cells in culture. J. Cell Biol. 104, 289–302. [DOI] [PMC free article] [PubMed] [Google Scholar]
- Piperno, G. & Fuller, M.T. (1985) Monoclonal antibodies specific for an acetylated form of alpha‐tubulin recognize the antigen in cilia and flagella from a variety of organisms. J. Cell Biol. 101, 2085–2094. [DOI] [PMC free article] [PubMed] [Google Scholar]
- Reilly, M.L. & Benmerah, A. (2019) Ciliary kinesins beyond IFT: cilium length, disassembly, cargo transport and signalling. Biol. Cell 111, 79–94. [DOI] [PubMed] [Google Scholar]
- Schrick, J.J ., Onuchic, L.F. , Reeders, S.T. et al (1995) Characterization of the human homologue of the mouse Tg737 candidate polycystic kidney disease gene. Hum. Mol. Genet. 4, 559–567. [DOI] [PubMed] [Google Scholar]
- Shi, X ., Garcia, G. , Van De Weghe, J.C. et al (2017) Super‐resolution microscopy reveals that disruption of ciliary transition‐zone architecture causes Joubert syndrome. Nat. Cell Biol. 19, 1178–1188. [DOI] [PMC free article] [PubMed] [Google Scholar]
- Shukla, A. , Kong, D. , Sharma, M. , Magidson, V. & Loncarek, J. (2015) Plk1 relieves centriole block to reduplication by promoting daughter centriole maturation. Nat. Commun. 6, 8077. [DOI] [PMC free article] [PubMed] [Google Scholar]
- Tanos, B.E ., Yang, H.J. , Soni, R. et al (2013) Centriole distal appendages promote membrane docking, leading to cilia initiation. Genes Dev. 27, 163–168. [DOI] [PMC free article] [PubMed] [Google Scholar]
- Tillberg, P.W. & Chen, F. (2019) Expansion microscopy: scalable and convenient super‐resolution microscopy. Annu. Rev. Cell Dev. Biol. 35, 683–701. [DOI] [PubMed] [Google Scholar]
- Tillberg, P.W. , Chen, F. , Piatkevich, K.D. et al (2016) Protein‐retention expansion microscopy of cells and tissues labeled using standard fluorescent proteins and antibodies. Nat. Biotechnol. 34, 987–992. [DOI] [PMC free article] [PubMed] [Google Scholar]
- Uetake, Y ., Loncarek, J. , Nordberg, J.J . et al (2007) Cell cycle progression and de novo centriole assembly after centrosomal removal in untransformed human cells. J. Cell Biol. 176, 173–182. [DOI] [PMC free article] [PubMed] [Google Scholar]
- Vladar, E.K. & Brody, S.L. (2013) Analysis of ciliogenesis in primary culture mouse tracheal epithelial cells. Methods Enzymol. 525, 285–309. [DOI] [PubMed] [Google Scholar]
- Vlijm, R ., Li, X. , Panic, M. et al (2018) STED nanoscopy of the centrosome linker reveals a CEP68‐organized, periodic rootletin network anchored to a C‐Nap1 ring at centrioles. Proc. Natl. Acad. Sci. U.S.A. 115, E2246–e2253. [DOI] [PMC free article] [PubMed] [Google Scholar]
- Vorobjev, I.A. & Chentsov Yu, S. (1982) Centrioles in the cell cycle. I. Epithelial cells. J. Cell Biol. 93, 938–949. [DOI] [PMC free article] [PubMed] [Google Scholar]
- Wassie, A.T. , Zhao, Y. & Boyden, E.S. (2019) Expansion microscopy: principles and uses in biological research. Nat. Methods 16, 33–41. [DOI] [PMC free article] [PubMed] [Google Scholar]
- Winey, M. & O'Toole, E. (2014) Centriole structure. Philos. Trans. R Soc. Lond. B Biol. Sci. Sep 5; 369. [DOI] [PMC free article] [PubMed] [Google Scholar]
- Yang, J. , Liu, X. , Yue, G. et al (2002) Rootletin, a novel coiled‐coil protein, is a structural component of the ciliary rootlet. J. Cell Biol. 159, 431–440. [DOI] [PMC free article] [PubMed] [Google Scholar]
- You, Y. , Richer, E.J. , Huang, T. & Brody, S.L. (2002) Growth and differentiation of mouse tracheal epithelial cells: selection of a proliferative population. Am. J. Physiol. Lung Cell. Mol. Physiol. 283, L1315–L1321. [DOI] [PubMed] [Google Scholar]
Associated Data
This section collects any data citations, data availability statements, or supplementary materials included in this article.
Supplementary Materials
Movie 1. mTEC‐ deuterosomes. A variable number of procentrioles is associated with two mother centrioles and numerous deuterosomes. The cell was expanded using cMAP and immunolabelled for acetylated tubulin. Near apical part of the cell was imaged using widefield and 60× oil lens. Hundred and one 200 nm thick Z sections were acquired and deconvolved.
Movie 2. mTEC cell‐released amplified centrioles. mTEC cells containing released amplified centrioles in random orientation. The cell was expanded using cMAP and immunolabelled for acetylated tubulin. Near apical part of the cell were imaged using widefield and 60× oil lens. Seventy‐four 200 nm thick Z sections were acquired and deconvolved.
Movie 3. mTEC cell with multicilia. The cell was expanded using cMAP and immunolabelled for acetylated tubulin. Apical part of the cell and protruding cilia were imaged using widefield and 60× oil lens. One hundred and fifty‐one 200 nm thick Z sections were acquired and deconvolved.