

Abstract
Objective
Juvenile Sjögren's syndrome (SS) is a rare, poorly defined, and possibly underdiagnosed condition affecting children and adolescents. The aim of this study was to characterize symptoms and clinical findings of juvenile SS and to explore the clinical application of major salivary gland ultrasonography (SGUS) in patients with juvenile SS.
Methods
A cross‐sectional multicenter study recruited patients with disease onset until age 18 years (n = 67). Disease characteristics were recorded, and unstimulated whole sialometry and SGUS examination of the parotid and submandibular salivary glands were performed.
Results
The female:male ratio was 58:9. The mean age at first symptom was 10.2 years and 12.1 years at diagnosis. Ocular and oral symptoms were noted in 42 of 67 patients (63%) and 53 of 66 patients (80%), respectively. The American‐European Consensus Group or American College of Rheumatology/European League Against Rheumatism classification criteria for primary SS were fulfilled by 42 of 67 patients (63%). Pathologic SGUS findings were observed in 41 of 67 patients (61%); 26 of 41 SGUS+ patients (63%) fulfilled primary SS criteria. Salivary gland enlargements/parotitis were noted in 37 of 58 patients and were nonsignificantly associated with SGUS+ status (P = 0.066). The mean levels of saliva were 5.6 ml/15 minutes in SGUS– patients compared to 3.3 ml/15 minutes in the SGUS+ patients (P = 0.049). A total of 36 of 41 SGUS+ patients (88%) were anti‐Ro/La+ compared to 14 of 26 SGUS– patients (54%) (P = 0.001). In addition, 24 of 39 SGUS+ patients (62%) were positive for rheumatoid factor (RF), whereas only 5 of 25 SGUS– patients (20%) were RF+ (P = 0.001).
Conclusion
Juvenile SS is characterized by a large spectrum of clinical symptoms and findings. Several glandular and extraglandular parameters such as hyposalivation, swollen salivary glands, and autoantibodies are associated with pathologic SGUS findings.
Introduction
Primary Sjögren's syndrome (SS) is a systemic autoimmune disorder. Patients with primary SS experience oral and ocular dryness and extraglandular manifestations such as fatigue, arthralgia, and arthritis 1. In addition to subjective and objective findings of salivary and/or lacrimal gland involvement, the primary SS classification is based on either the presence of autoantibodies against Ro/SSA and/or La/SSB, and/or focal mononuclear cell inflammation with a focus score ≥1 in a minor labial salivary gland biopsy 2. Serum autoantibodies have been presented as early markers of primary SS 3.
Significance & Innovations.
Interest in juvenile Sjögren’s syndrome is increasing and international collaborations are emerging. To date, to the best of our knowledge, this is the largest cohort world‐wide characterizing juvenile Sjögren's syndrome and also the first large study investigating salivary gland ultrasonography in this patient group.
Juvenile SS is a rare, poorly defined and possibly underdiagnosed condition 4, 5. The mean age at the time of diagnosis is approximately 10 years 6. A common initial symptom is swelling of the major salivary glands 6, 7. Several organ systems may be affected, resulting in neurologic, dermatologic, musculoskeletal, vascular, gastrointestinal, respiratory, renal, and hematologic manifestations 8, 9. Extraglandular manifestations occur in approximately 50% of children with juvenile SS 4. Criteria for juvenile SS are not available in current literature 10, 11, 12, and neither the American‐European Consensus Group (AECG) criteria 2 nor the American College of Rheumatology (ACR)/European League Against Rheumatism (EULAR) criteria 13 have been validated in a juvenile population. In addition, the AECG criteria may not be applicable due to diverse clinical manifestations in children compared to adults 5.
Interest regarding the major salivary glands ultrasonography examination (SGUS) 14 as a diagnostic tool for primary SS is increasing 15, 16, 17, 18, 19. SGUS may serve as a supplement, or even alternative, to minor salivary gland biopsy 11, 17. Development of a noninvasive, diagnostic method for evaluation of the salivary gland component, to aid the diagnosis of juvenile SS, is especially important in the younger population, both with regard to the late onset in some patients of sicca symptoms and the current lack of diagnostic criteria. Previous studies have indicated that SGUS may be of value in establishing a juvenile SS diagnosis 7, 20, 21. However, current reports include small numbers of patients, and SGUS application remains to be evaluated in a larger cohort. Further studies on juvenile SS are needed, and to our knowledge, our study is, to date, the largest cohort for this patient group. The aim of this study was to characterize symptoms and clinical findings in patients with juvenile SS and to investigate SGUS as a diagnostic tool for juvenile SS.
Materials and Methods
Patients
The study design was a cross‐sectional multicenter study. Patients were recruited from Haukeland University Hospital in Bergen, Norway, Oslo University Hospital in Oslo, Norway, Hospital General Universitario Gregorio Marañón in Madrid, Spain, Hospital Universitário Cassiano Antônio Moraes of Federal University of Espírito Santo in Vitória, Brazil, Hospital Universitário Clementino Fraga Filho of Federal University of Rio de Janeiro in Rio de Janeiro, Brazil, Hospital das Clinicas, Faculdade de Medicina da Universidade de Sao Paulo in Sao Paulo, Brazil, University Medical Center Groningen in Groningen, The Netherlands, and University of Florida, Gainesville, Florida. Patients had previously received the diagnosis of juvenile SS by a specialist in rheumatology or pediatric medicine at age ≤18 years. At the time of inclusion, all patients were younger than 25 years. Identification of patients at each clinic was performed by the local specialist in rheumatology or pediatric medicine.
A clinical examination, sialometry, and SGUS were performed in all patients. Upon inclusion, patients were asked for information on extraglandular manifestations, and a medical history was collected from medical charts, including information regarding autoantibodies, biopsy results, and current/previous treatment.
Patients recruited in Norway (n = 11), Spain (n = 5), and Brazil (n = 40) were examined and included by the primary investigators (SDH and MVJ) with the local specialist. Patients recruited from The Netherlands (n = 8) and US (n = 3) were examined in collaboration with local experts and included retrospectively. Because this was a cross‐sectional study, not all clinical examinations and tests had been performed or were available in all patients.
Disease activity measurements
Subjective symptoms and the EULAR Sjögren's Syndrome Patient Reported Index (ESSPRI) score 22 were determined upon inclusion. Children were aided by an accompanying parent/guardian, when necessary. The European League Against Rheumatism Sjögren's Syndrome Disease Activity Index (ESSDAI) score 23 was registered upon inclusion. The hematologic and biologic domains were determined from the most recent blood samples available.
Tear secretion
Tear secretion was evaluated by the Schirmer I test. Wetting of the strip was recorded in mm, with levels of ≤5 mm wetting of the paper strip considered as pathologically reduced tear secretion.
Sialometry
Salivary gland functional capacity was evaluated by unstimulated sialometry, measured in ml/15 minutes, with the patients fasting for 90 minutes prior to examination. The volume of saliva was determined by weighing, with 1 gram corresponding to 1 ml. Saliva secretion levels ≤1.5 ml/15 minutes were considered pathologically reduced.
Salivary gland ultrasonography
The SGUS examination of the parotid and submandibular glands was performed using linear high‐frequency transducers (6–15 MHz) and a simplified scoring system. Glandular homogeneity and the presence of hypoechogenic areas were evaluated and graded (range 0–3). Grades 0–1 were considered to correspond to normal/nonspecific changes and grades 2–3 to correspond to pathologic changes (Figure 1). The SGUS was performed and scored bedside by local experts in the US and The Netherlands and by SDH and MVJ in Norway, Spain, and Brazil.
Figure 1.
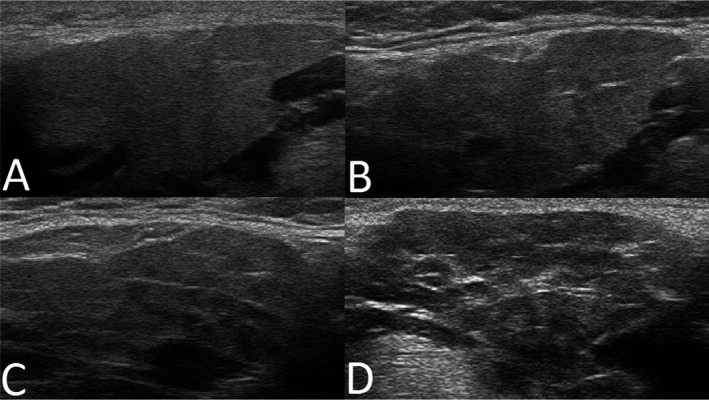
Representative major salivary gland ultrasonography images of submandibular glands, illustrating A, grade 0; B, grade 1; C, grade 2; and D, grade 3, with grades 0–1 corresponding to normal‐appearing morphology, and grades 2–3 corresponding to pathologic changes in the submandibular and parotid glands of patients with clinical symptoms of juvenile Sjögren's syndrome.
Ethical considerations
This study was performed in accord with the regional medical and health research ethics regulations, and necessary applications were approved by the regional Committees in the participating centers/countries (Norway: 145/96‐44.96, 242.06 2009/686; Brazil: 4478701544787015447870151.433.660/201644787015.6.2001.0068). Informed consent was obtained from all participants and from parents of patients age <16 years, according to the Declaration of Helsinki. Parents/legal guardians of underaged patients were present at inclusion (clinical examination and SGUS imaging). In Spain, The Netherlands, and US, the noninvasive study design and number of patients included were in accordance with regional ethical guidelines and did not need a specific project approval.
Statistical analysis
Student's t‐test with Welch's correction was used to study differences between groups and Pearson's correlation for the relationship between 2 variables. Correlations within ranges 0.0 to <0.2 were considered as poor, 0.2 to <0.4 as fair, 0.4 to <0.6 as moderate, 0.6 to <0.8 as good, and 0.8–1.0 as excellent. For categorical data, chi‐square analysis was employed. To adjust for Type I error due to multiple comparisons, Benjamin‐Hochberg adjustment was applied. All analyses were performed using SPSS statistics software, version 19.0.
Results
Patient characteristics
Our cohort consisted of 67 patients. The female:male ratio was 58:9. Mean age at first symptom was 10.2 years (range 1–17), with 12.1 years at diagnosis (range 4–18), and 16.3 years at inclusion (range 6–25) (Table 1).
Table 1.
Patient demographics and associated diseases in all included patients (n = 67) with a clinical diagnosis of juvenile Sjögren's syndromea
| No. | Mean ± SD years | SGUS– | SGUS+ | P b | Benjamin‐Hochberg adjustment | |
|---|---|---|---|---|---|---|
| Age at inclusion, years | 67 | 16.3 ± 4.7c | 17.3 ± 5.7 | 15.6 ± 3.9 | 0.146 | NS |
| Age at first symptom, years | 64d | 10.2 ± 3.7 | 10.5 ± 4.5 | 10.1 ± 3.2 | 0.675 | NS |
| Age at diagnosis, years | 61d | 12.1 ± 3.8 | 12.0 ± 4.5 | 12.2 ± 3.3 | 0.875 | NS |
| Time from symptom onset to diagnosis, years | 60d | 1.8 ± 1.9 | 1.5 ± 1.5 | 1.9 ± 2.0 | 0.355 | NS |
| Time from diagnosis to inclusion, years | 61d | 4.1 ± 4.4c | 5.5 ± 5.3 | 3.3 ± 3.5 | 0.062 | NS |
| Female:male ratio | 58:9 | – | 25:1 | 33:8 | 0.067 | NS |
| Hypothyroidism, no./total (%)e | 5/59 (8) | – | 3/25 (12) | 2/34 (6) | 0.404 | NS |
| SLE, no./total (%)e | 7/59 (12) | – | 4/25 (16) | 3/34 (9) | 0.400 | NS |
| MCTD, no./total (%)e | 1/59 (2) | – | 1/25 (4) | 0/34 (0) | 0.240 | NS |
Values are the mean ± SD unless indicated otherwise. SGUS = salivary gland ultrasonography; NS = nonsignificant; SLE = systemic lupus erythematosus; MCTD = mixed connective tissue disease.
P values are for the comparison of SGUS+ and SGUS– patients.
Regional differences (patients included in Brazil compared to patients included in Europe/US).
Data not available from all patients.
Number of positive observations/number of available observations.
Of the 67 patients, 35 (52%) and 39 (58%) fulfilled the AECG 2 and ACR/EULAR 13 classification criteria, respectively. When combining the criteria, 32 patients (48%) fulfilled both sets of criteria and 42 patients (63%) fulfilled either the AECG or the ACR/EULAR criteria. One patient had mixed connective tissue disease (MCTD), and 7 patients were diagnosed with systemic lupus erythematosus (SLE) (Table 1).
In the patients with MCTD/SLE (n = 8), 7 presented with autoantibodies and fulfilled the AECG and the ACR/EULAR classification criteria. In this subgroup, 6 of 8 patients had ocular symptoms and 5 had ocular signs. All patients had experienced major salivary gland swelling, and 6 had salivary gland involvement by sialometry (n = 2), scintigraphy (n = 2), sialometry and scintigraphy (n = 1), or sialometry, scintigraphy, and sialography (n = 1). Five had available minor salivary gland biopsy results; the 3 patients lacking biopsy results had objective evidence of salivary gland involvement, either by a positive scintigraphy (n = 1), sialometry and scintigraphy (n = 1), or sialometry, scintigraphy, and sialography (n = 1). All 5 biopsy results were positive, i.e., with a focus score of ≥1, corresponding to ≥1 chronic inflammatory cell foci consisting of 50 or more cells per 4 mm2 of otherwise normal‐appearing minor salivary gland tissue. In comparison, for the remaining patients not diagnosed with an additional connective tissue disease (n = 59), information on minor salivary gland biopsy results was available from 29 patients, with a positive biopsy result in 23 cases. Among these, the accurate focus score was available from 16 patients, and 15 biopsy results were positive (focus score ≥1). All MCTD/SLE patients had extraglandular manifestations and 3 had renal affection, findings that were not registered in any of the other patients.
Subjective symptoms
Subjective ocular and oral dryness symptoms were noted in 42 of 67 patients (63%) and 53 of 66 patients (80%), respectively (Table 2). Only 8 of 66 patients (12%) reported no dryness symptoms. Ocular signs were noted in 26 of 40 patients (65%) with ocular symptoms (P = 0.004).
Table 2.
Subjective ocular and oral symptoms, objective signs of impaired tear secretion, salivary gland inflammation and hypofunction, serum autoantibodies, and fulfillment of classification criteria in all included patients (n = 67) with juvenile Sjögren's syndromea
| No. | SGUS– | SGUS+ | P b | Benjamin‐Hochberg adjustment | |
|---|---|---|---|---|---|
| Ocular symptoms (I) | 42/67 (63)c | 23/26 (88) | 19/41 (46) | 0.001 | Significant |
| Oral symptoms (II) | 53/66 (80) | 18/26 (69) | 30/40 (75) | 0.607 | NS |
| Salivary gland enlargement | 37/58 (64)d | 12/24 (50) | 25/34 (74) | 0.066 | NS |
| Ocular signs (III) | 33/65 (51)c | 16/24 (67) | 17/41 (41) | 0.05 | NS |
| Schirmer I test (ever) | 27/64 (42)e | 13/25 (52) | 14/39 (36) | 0.203 | NS |
| Ocular staining score | 20/37 (54) | 12/18 (67) | 8/19 (42) | 0.134 | NS |
| Focus score ≥1 (IV) | 28/34 (82) | 7/8 (88) | 21/26 (81) | 0.662 | NS |
| Focus score, mean ± SD |
1.7 ± 1.7 (n = 20) |
1.0 ± 0 | 1.9 ± 1.9 | 0.368 | NS |
| Salivary gland involvement (V) | 41/61 (67)f | 21/26 (81) | 20/35 (57) | 0.052 | NS |
| UWS ≤1.5 ml/minute | 20/60 (33)e | 9/26 (35) | 11/34 (32) | 0.854 | NS |
| UWS, mean ± SD ml/15 minutes |
4.3 ± 4.6 (n = 60) |
5.6 ± 5.8 | 3.3 ± 3.2 | 0.049 | NS |
| Sialography | 1/3 (33)g | 1/2 (50) | 0/1 (0) | 0.386 | NS |
| Sialo‐scintigraphy | 29/31 (9)h | 20/22 (91) | 9/9 (100) | 0.350 | NS |
| SGUS | 41/67 (61)i | – | – | – | – |
| Autoantibodies (VI) | 50/67 (75)c | 14/26 (54) | 36/41 (88) | 0.002 | Significant |
| ANA | 62/67 (93)d | 23/26 (88) | 39/41 (9) | 0.312 | NS |
| Anti‐Ro/SSA | 50/67 (75)j | 14/26 (54) | 36/41 (88) | 0.002 | Significant |
| Anti‐La/SSB | 27/67 (40)i | 4/26 (15) | 23/41 (56) | 0.001 | Significant |
| Anti‐Ro/SSA and anti‐La/SSB | 27/67 (40)i | 4/26 (15) | 23/41 (56) | 0.001 | Significant |
| Anti‐Ro/SSA or anti‐La/SSB | 50/67 (75)j | 14/26 (54) | 36/41 (88) | 0.002 | Significant |
| Rheumatoid factor | 29/64 (45)c | 5/25 (20) | 24/39 (62) | 0.001 | Significant |
| AECG criteria | 35/67 (52) | 14/26 (54) | 21/41 (51) | 0.834 | NS |
| ACR/EULAR criteria | 39/67 (58) | 15/26 (58) | 24/41 (59) | 0.946 | NS |
| ACR/EULAR and AECG criteria | 32/67 (48) | 13/26 (50) | 19/41 (46) | 0.770 | NS |
| ACR/EULAR or AECG criteria | 42/67 (63) | 16/26 (62) | 26/41 (63) | 0.877 | NS |
Values are the number of patients with positive findings/patients with available information (%), unless indicated otherwise. Roman numerals indicate the corresponding items of the American‐European Consensus Group (AECG) criteria. Regional differences refer to patients included in Brazil compared to patients included in Europe/US. SGUS = salivary gland ultrasonography; NS = nonsignificant; UWS = unstimulated whole saliva flow; ANA = antinuclear antibody; ACR = American College of Rheumatology; EULAR = European League Against Rheumatism.
P values are for the comparison of SGUS+ and SGUS– patients.
Regional differences.
Eight patients with systemic lupus erythematosus (SLE)/mixed connective tissue disease (MCTD).
Four patients with SLE/MCTD.
Six patients with SLE/MCTD, and 5 patients with SLE/MCTD, with regional differences.
One patient with SLE/MCTD, with regional differences.
Four patients with SLE/MCTD, with regional differences.
Three patients with SLE/MCTD, with regional differences.
Seven patients with SLE/MCTD, with regional differences.
Subjective oral symptoms were not associated with a positive minor salivary gland biopsy result or objective salivary gland involvement (sialometry, sialography, or scintigraphy). Sialo‐scintigraphy and/or sialography had been performed in 31 patients (Table 2), although only in the Brazilian part of the cohort.
The ESSPRI score for dryness correlated nonsignificantly with age at inclusion (P = 0.062; n = 58). The mean ESSPRI score for patients not fulfilling classification criteria (n = 25) was 2.7 compared to 4.0 for patients (n = 40) fulfilling either AECG and/or ACR/EULAR classification criteria for primary SS (P = 0.04).
Major salivary gland imaging and glandular characteristics
Pathologic SGUS findings (Figure 1 C and D) were observed in 41 of 67 patients. The mode SGUS score was 2 for all glands. The total sum of the SGUS score for all 4 glands (range 0–12) correlated with the ACR/EULAR points (r = 0.321, P = 0.016; n = 56) (Figure 2). SGUS+ findings were observed in 26 of 27 of the European and North American patients as compared to 15 of 40 of the Brazilian patients (P = 0.001).
Figure 2.
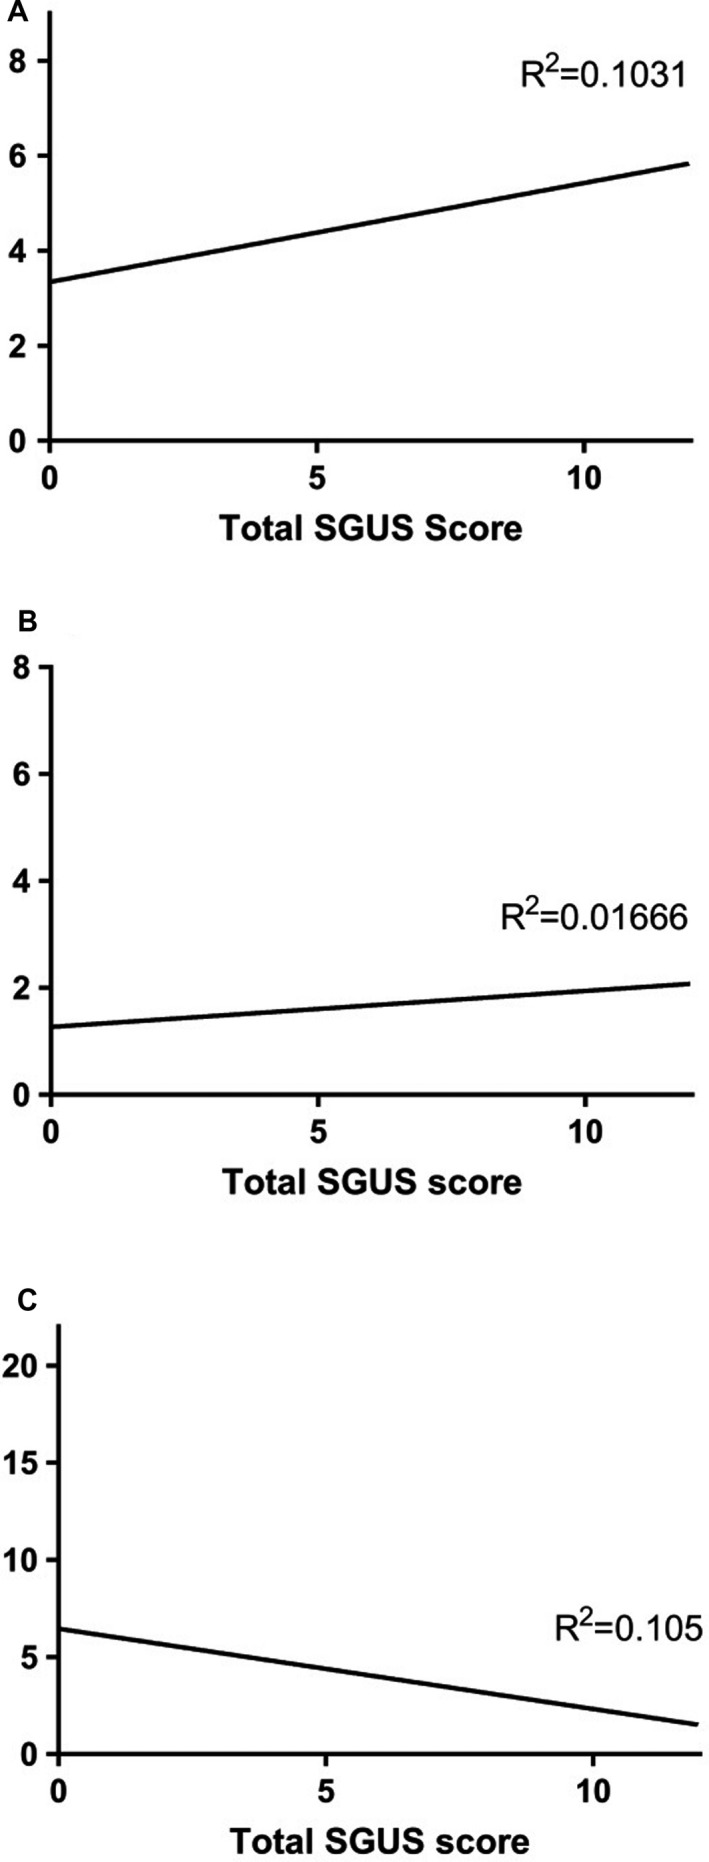
Total major salivary gland ultrasonography score (range 0–12) for all 4 glands in relation to the A, Total points of the American College of Rheumatology/European League Against Rheumatism classification criteria (range 0–9) (P = 0.016), B, Focus score, and C, Unstimulated whole saliva flow (range 0–21.36 ml/15 minute) (P = 0.015). The correlations were not significant after Benjamin‐Hochberg adjustment. We did not find a correlation with the focus score (range 0–8).
Subjective sicca symptoms were not associated with pathologic SGUS findings; ocular symptoms were noted only in 19 of 41 SGUS+ patients (46%) compared to 23 of 26 SGUS– patients (88%) (P = 0.001). Ocular signs were noted in 17 of 41 SGUS+ patients (41%) compared to 16 of 24 SGUS– patients (67%) (P = 0.050). Oral symptoms were noted in 30 of 40 SGUS+ patients (75%) compared to 18 of 26 SGUS– patients (69%) (P = 0.607).
Salivary gland involvement (sialometry, sialo‐scintigraphy, and sialography) was noted in 41 of 61 patients (67%), 20 of 35 SGUS+ patients (57%), and 21 of 26 SGUS– patients (81%) (P = 0.052) (Table 2). When considering the individual items for salivary gland involvement, unstimulated whole saliva levels (ml/15 minutes) correlated inversely with the sum of the SGUS score (range 0–12) for all 4 glands (r = –0.324, P = 0.015 [n = 56]) (Figure 2), and with the SGUS score (range 0–3) for both submandibular glands (r = –0.372, P = 0.005 [n = 56], and r = –0.301, P = 0.024 [n = 56], right and left gland, respectively). A correlation was also observed in the right parotid gland (r = –0.285, P = 0.033 [n = 56]). The mean level of saliva was 5.6 ml/15 minutes in SGUS– patients compared to 3.3 ml/15 minutes in the SGUS+ patients (P = 0.049), but when comparing saliva cutoff levels (≤1.5 ml/15 minutes) SGUS+ patients were below the threshold in 11 of 34 cases (32%), compared to 9 of 26 SGUS– patients (35%) (P = 0.854). Scintigraphy findings coincided with both normal and pathologic SGUS findings (P = 0.350) (Table 2).
Information regarding minor labial salivary gland biopsy results was available in 34 patients. Among these, 28 of 34 patients (82%) had a focus score ≥1, 21 of 26 SGUS+ patients (81%) compared to 7 of 8 SGUS– patients (88%) (P = 0.662) (Table 2). For 20 patients, the precise focus score was available, ranging from 0 to 8 with a mean of 1.7. The mean focus score was 1.9 in the SGUS+ patients (n = 16) compared to 1.0 in the SGUS– patients (n = 4), but the difference was not statistically significant (P = 0.368), most likely due to low numbers. Low numbers probably also influenced the lack of correlation between precise focus score and total SGUS score, both when considering the glands separately and for all glands (Figure 2).
In total, 37 of 58 patients (64%) had experienced salivary gland enlargements/parotitis (Table 2), and although not significant, a trend was noted with regard to pathologic SGUS findings; 25 of 34 SGUS+ patients (74%) had experienced salivary gland swelling, compared to 12 of 24 SGUS– patients (50%) (P = 0.066).
Autoantibodies
The majority of patients, 50 of 67 (75%), presented with anti‐Ro/SSA and/or anti‐La/SSB. In the group with SGUS+ findings, 36 of 41 patients (88%) were anti‐Ro/SSA positive, whereas in the SGUS– group only 14 of 26 patients (54%) were anti‐Ro/SSA positive (P = 0.002). Similarly, SGUS+ status was associated with anti‐La/SSB; 23 of 41 of the SGUS+ patients (56%) were anti‐La/SSB+, whereas only 4 of 26 of the SGUS– patients (15%) were anti‐La/SSB+ (P = 0.001), and 24 of 39 of the SGUS+ patients (62%) were positive for rheumatoid factor (RF), whereas only 5 of 25 of the SGUS– patients (20%) were RF+ (P = 0.001) (Table 2).
In total, 11 of 36 SGUS+ patients (31%) with positive anti‐Ro/SSA status did not fulfill the current classification criteria for primary SS 2, 13. Of these 11 patients, all did not fulfill or were lacking 1 or several items; ocular symptoms (n = 11, 3 positive), oral symptoms (n = 10, 7 positive), ocular signs (n = 11, all negative), minor salivary gland biopsy (n = 3, all negative), salivary gland involvement (n = 6, 2 positive), sialo‐scintigraphy (n = 1, positive), sialometry (n = 6, all negative), ocular staining score (n = 6, 1 positive). Six patients had experienced salivary gland swelling; 2 of these had also experienced lacrimal gland swelling.
Taking a closer look at patients not fulfilling classification criteria for primary SS (n = 25), 11 of 25 patients (44%) presented with anti‐Ro/SSA and SGUS+ status, whereas the remaining patients (n = 14) were either SGUS+ but lacked anti‐Ro/SSA (n = 4) or were anti‐Ro/SSA– and had a normal‐appearing SGUS (n = 10). Among the SGUS+/anti‐Ro/SSA– patients, 2 of 4 were positive for antinuclear antibody (ANA). For the SGUS–/anti‐Ro/SSA– patients, all had pathologic findings by sialo‐scintigraphy, 9 of 10 (90%) were ANA+, 3 of 10 (30%) had pathologic levels of unstimulated whole saliva flow, and 1 also had a positive sialography. One of the SGUS–/anti‐Ro/SSA– patients was diagnosed with SLE.
Extraglandular manifestations
Various extraglandular manifestations at some time point had been noted in 56 of 62 patients (90%) (Table 3). The mean ESSPRI score total was 4.0 for patients (n = 40) fulfilling classification criteria for primary SS 2, 13 compared to 2.7 for the remaining patients (n = 25) (P = 0.040). The ESSPRI pain score was also increased in patients fulfilling the AECG and/or ACR/EULAR classification criteria for primary SS, with mean levels of 3.5 compared to 1.9 (P = 0.05). The mean ESSDAI score was nonsignificantly higher in the SGUS+ patients compared to the SGUS– patients (P = 0.138) (Table 3).
Table 3.
Extraglandular manifestations in patients with juvenile Sjögren's syndromea
| No. | SGUS– | SGUS+ | P b | Benjamin‐Hochberg adjustment | |
|---|---|---|---|---|---|
| Extraglandular manifestations | 56/62 (90)c | 24/25 (96) | 32/37 (86) | 0.214 | NS |
| Constitutional | 24/59 (41)d | 12/25 (48) | 12/34 (35) | 0.326 | NS |
| Cutaneous | 17/59 (29)e | 8/25 (32) | 9/34 (26) | 0.643 | NS |
| Lymphadenopathy | 35/59 (59)f | 17/25 (68) | 18/34 (53) | 0.245 | NS |
| Articular | 34/59 (58)g | 17/25 (68) | 17/34 (50) | 0.167 | NS |
| Muscular | 5/59 (8) | 1/25 (4) | 4/34 (12) | 0.290 | NS |
| Pulmonary | 1/59 (2) | 1/25 (4) | 0/34 (0) | 0.240 | NS |
| Renal | 3/59 (5)h | 1/25 (4) | 2/34 (6) | 0.745 | NS |
| Peripheral nervous system | 1/59 (2) | 1/25 (4) | 0/34 (0) | 0.240 | NS |
| Central nervous system | 3/59 (5) | 3/25 (12) | 0/34 (0) | 0.038 | NS |
| Hematologic domain | 16/58 (28)e | 6/24 (25) | 10/34 (29) | 0.711 | NS |
| Biologic domain | 21/58 (36)i | 9/24 (38) | 12/34 (35) | 0.863 | NS |
| ESSPRI score, mean ± SD |
3.5 ± 2.5 (n = 65) |
3.2 ± 2.8 | 3.7 ± 2.3 | 0.368 | NS |
| ESSPRI dryness, mean ± SD |
3.4 ± 3.0 (n = 65) |
3.4 ± 2.9 | 3.5 ± 3.1 | 0.919 | NS |
| ESSPRI fatigue, mean ± SD |
4.3 ± 3.4 (n = 65)j |
3.8 ± 3.9 | 4.6 ± 3.0 | 0.314 | NS |
| ESSPRI pain, mean ± SD |
2.9 ± 3.2 (n = 65) |
2.4 ± 3.4 | 3.2 ± 3.2 | 0.362 | NS |
| Total ESSDAI score, mean ± SD |
4.7 ± 5.4 (n = 62) |
3.4 ± 2.8 | 5.5 ± 6.5 | 0.138 | NS |
| Clinical ESSDAI, mean ± SD |
3.2 ± 4.1 (n = 59) |
2.7 ± 3.0 | 3.6 ± 4.8 | 0.443 | NS |
Values are the number of patients with positive findings/patients with available information (%), unless indicated otherwise. Regional differences refer to patients included in Brazil compared to patients included in Europe/US. SGUS = salivary gland ultrasonography; NS = nonsignificant; ESSPRI = European League Against Rheumatism (EULAR) Sjögren's Syndrome Patients Reported Index; ESSDAI = EULAR Primary Sjögren's Syndrome Disease Activity Index.
P values are for the comparison of SGUS+ and SGUS– patients.
Eight patients with systemic lupus erythematosus (SLE)/mixed connective tissue disease (MCTD), with regional differences.
Five patients with SLE/MCTD, with regional differences.
¶Five patients with SLE/MCTD.
Three patients with SLE/MCTD, with regional differences.
Eight patients with SLE/MCTD.
Three patients with SLE/MCTD.
Six patients with SLE/MCTD.
Regional differences.
Treatment
Symptomatic treatment was observed in 29 of 59 patients (49%) (Table 4). Symptomatic treatment was registered in 16 of 34 SGUS+ patients (47%) compared to 17 of 25 SGUS– patients (68%) (P = 0.109). Only 5 of 59 patients (8%) had received salivary substitutes; 4 of these patients had SGUS+ status. Three patients had received pilocarpine, none had received cevimeline. A higher number of patients, 30 of 59 (51%), had received or were using lacrimal substitutes, whereof the majority, 18 of 30 (60%), had normal SGUS (P = 0.005) (Table 4). The mean ESSPRI score for dryness was 4.1 for patients who had received symptomatic treatment compared to 2.4 for those without symptomatic treatment (P = 0.028).
Table 4.
Treatment in all included patients with juvenile Sjögren's syndromea
| No. | SGUS– | SGUS+ | P b | Benjamin‐Hochberg adjustment | |
|---|---|---|---|---|---|
| Symptomatic treatment, current | 29/59 (49)c | 17/25 (68) | 16/34 (47) | 0.109 | NS |
| Symptomatic treatment, ever | 47/59 (80)d | 22/25 (88) | 25/34 (74) | 0.172 | NS |
| Salivary substitutes, current | 4/59 (7) | 1/25 (4) | 3/34 (9) | 0.466 | NS |
| Salivary substitutes, ever | 5/59 (8) | 1/25 (4) | 4/34 (12) | 0.466 | NS |
| Lacrimal substitutes, current | 25/59 (42)e | 16/25 (64) | 9/34 (26) | 0.004 | Significant |
| Lacrimal substitutes, ever | 30/59 (51)e | 18/25 (72) | 12/34 (35) | 0.005 | Significant |
| NSAIDS, current | 9/59 (15) | 1/25 (4) | 8/34 (24) | 0.039 | NS |
| NSAIDs, ever | 25/59 (42)f | 9/25 (36) | 16/34 (47) | 0.396 | NS |
| Systemic treatment, ever | 56/59 (95)g | 25/25 (100) | 31/34 (91) | 0.127 | NS |
| Systemic treatment, current | 46/59 (78)h | 23/25 (92) | 23/34 (68) | 0.026 | NS |
| Hydroxychloroquine, ever | 54/59 (92)g | 25/25 (100) | 29/34 (85) | 0.045 | NS |
| Hydroxychloroquine, current | 40/59 (68)g | 22/25 (88) | 18/34 (53) | 0.004 | Significant |
| MTX, ever | 22/57 (39)f | 9/25 (36) | 13/32 (41) | 0.722 | NS |
| MTX, current | 14/57 (25)f | 6/25 (24) | 8/32 (25) | 0.931 | NS |
| Azathioprine, ever | 12/58 (21)i | 6/25 (24) | 6/33 (18) | 0.588 | NS |
| Azathioprine, current | 10/58 (17)j | 5/25 (20) | 5/33 (15) | 0.628 | NS |
| Low prednisone, ever | 31/57 (54)d | 11/24 (46) | 20/33 (61) | 0.269 | NS |
| Low prednisone, current | 12/57 (21)k | 4/24 (17) | 8/33 (24) | 0.489 | NS |
| High prednisone, ever | 13/59 (22)c | 6/25 (24) | 7/34 (21) | 0.755 | NS |
| High prednisone, current | 5/59 (8)j | 2/25 (8) | 3/34 (9) | 0.911 | NS |
Values are the number of patients with positive findings/patients with available information (%), unless indicated otherwise. Regional differences refer to patients included in Brazil compared to patients included in Europe/US. SGUS = salivary gland ultrasonography; NS = nonsignificant; NSAIDs = nonsteroidal antiinflammatory drugs; MTX = methotrexate.
P values are for the comparison of SGUS+ and SGUS– patients.
Six patients with systemic lupus erythematosus (SLE)/mixed connective tissue disease (MCTD), with regional differences.
Six patients with SLE/MCTD.
Five patients with SLE/MCTD, with regional differences.
One patient with SLE/MCTD.
Eight patients with SLE/MCTD.
Eight patients with SLE/MCTD, with regional differences.
Four patients with SLE/MCTD, with regional differences.
Four patients with SLE/MCTD.
Five patients with SLE/MCTD.
Current or previous use of nonsteroidal antiinflammatory drugs was noted in 16 of 34 SGUS+ patients (47%) compared to 9 of 25 SGUS– patients (36%) (P = 0.396). Of 59 patients, 54 were currently (n = 40) or previously (n = 14) treated with hydroxychloroquine. In total, 29 of 34 SGUS+ patients (85%) had experience using hydroxychloroquine, whereas 25 of 25 SGUS– patients had used or were using hydroxychloroquine (P = 0.045). When instead comparing never users (n = 5) and previous users (n = 14) to current users (n = 40), 18 of 34 SGUS+ patients (53%) and 22 of 25 SGUS– patients (88%) were on current treatment (P = 0.004) (Table 4).
Systemic treatment was noted in 56 of 59 patients (95%) and was associated with extraglandular manifestations in 52 of 53 patients (P = 0.001). In 10 patients, systemic treatment was ceased, and 42 of 53 patients with extraglandular manifestations were currently receiving systemic treatment (P = 0.481). In 40 of 46 patients (87%), the systemic treatment was current hydroxychloroquine (P = 0.001).
Discussion
To date, this is the largest study investigating clinical characteristics of patients with juvenile SS in combination with SGUS. The female:male ratio was approximately 6.4:1, i.e., slightly altered with more male patients as compared to 9:1 for adults with primary SS 24, 25, 26, 27. The mean time from symptom debut to diagnosis was 1.8 years, naturally shorter than in adult primary SS patients, where the time from debut of symptoms to diagnosis spans up to 11–14 years 26.
Nearly 2 of 3 of the patients fulfilled the current classifications criteria for primary SS, and there were no significant differences in the application of the 2002 AECG 2 and the ACR/EULAR criteria 13. Due to different practices between regions and the fact that not all examinations in the classification criteria are routinely performed in all pediatric patients, we cannot be certain that patients not fulfilling the classification criteria in this study would still not fulfill criteria were all necessary examinations performed.
SGUS findings were associated with anti‐Ro/SSA and anti‐La/SSB, similar to previous findings in adult primary SS 28. Of the 36 SGUS+ patients with positive anti‐Ro/SSA, 11 patients did not fulfill the AECG or ACR/EULAR classification criteria due to lack of objective salivary or lacrimal gland involvement, such as reduced salivary and/or lacrimal secretion. Of these 11 patients, 6 of 8 had registered salivary gland enlargement.
When considering the patients not fulfilling classification criteria for primary SS (n = 25), 11 (44%) were anti‐Ro/SSA+ and SGUS+, 4 (16%) were SGUS+ and anti‐Ro/SSA–, and 10 (40%) were anti‐Ro/SSA– and SGUS–. Among the anti‐Ro/SSA– patients, 11 of 14 (78.6%) were ANA+. In addition, all the anti‐Ro/SSA– and SGUS– patients had previously documented salivary gland involvement by sialo‐scintigraphy. Our findings thus support the notion that the existing criteria for primary SS are not optimal for clinical evaluation and research of juvenile SS 10, 12, 29. Of note, among the individuals fulfilling either the AECG or the ACR/EULAR classification criteria, 1 of 42 SGUS+ patients was ANA+ but anti‐ Ro/SSA–. Concerning the individuals fulfilling both AECG and ACR/EULAR criteria, all 19 SGUS+ patients were anti‐Ro/SSA+ compared to 11 of 13 of the SGUS– patients (P = 0.077). Other relevant autoantibodies such as anti‐La/SSB and RF were also associated with SGUS findings, further supporting the link between autoantibodies and salivary gland involvement in juvenile SS.
In this cohort of patients with juvenile SS, pathologic SGUS changes (61%) were slightly more common compared to findings in adults 30 and nonsignificantly associated with salivary gland swelling, a clinical feature generally associated with juvenile SS. Similar to findings in adult primary SS, a higher SGUS score was associated with lower levels of unstimulated whole saliva 28, nonsignificantly associated with oral dryness symptoms. Treatment of oral dryness symptoms was rare, but linked to SGUS+ status in 4 of 5 cases. Ocular sicca symptoms and symptomatic treatment of dry eye were more common in SGUS– patients. The ESSPRI dryness score showed a trend to increase with age at inclusion (P = 0.062). One might speculate whether this increase was due to actual later onset of sicca symptoms, or whether oral dryness is not perceived as a problem by the younger patients.
Although the mean focus score was higher in SGUS+ patients compared to SGUS– patients and implies that the focus score can mirror the degree of damage visualized by SGUS, comparison of findings in the major and the minor glands was limited due to lack of data on minor salivary gland focus score.
Similar to earlier reports in both primary SS and juvenile SS, the patients in this cohort displayed a high degree of extraglandular manifestations 25, 30. Both mean ESSPRI and mean ESSPRI pain scores were higher in the patients fulfilling AECG and ACR/EULAR classification criteria, and the mean ESSDAI score was nonsignificantly higher in the SGUS+ patients compared to the SGUS– patients.
Eight patients with extraglandular manifestations differed from their juvenile SS peers in several aspects. All 8 had at some point been diagnosed with SLE or MCTD and 3 had renal affection, an extraglandular manifestation with a varied prevalence of 2% to 67% in primary SS 31, 32, 33. Kidney involvement was not observed in any other patients in the cohort. Although 7 of 8 patients fulfilled the classification criteria for primary SS, a possible misdiagnosis cannot be ruled out, as differentiation between various connective tissue diseases can be difficult. Nonetheless, 3 of 8 patients with SLE/MCTD presented with SS‐like SGUS changes, such as hypoechogenic areas and inhomogeneity 27, consistent with the frequency of imaging findings in this subgroup of the cohort.
Previous or current systemic treatment was also quite frequent, especially in patients with extraglandular manifestations. For the majority of patients, the current systemic treatment was hydroxychloroquine. Only 18 of 40 patients with current hydroxychloroquine treatment displayed SGUS+ changes, whereas 16 of 19 patients without current treatment showed changes. These results should, however, be interpreted with care because among those 2 groups there is both a higher proportion of patients with extraglandular manifestations (39 of 40 versus 14 of 19, respectively) (P = 0.005), current systemic treatment (37 of 40 versus 9 of 19, respectively) (P = 0.001), and a lower degree of SGUS+ status in a subgroup of the cohort consisting of patients included in Brazil compared to Europe/US (15 of 40 versus 26 of 27) (P = 0.000), and a possible confounding factor cannot be ruled out. Patients in this Brazilian subgroup were also older when included, and the mean time from diagnosis to inclusion was higher.
Studying the current group of patients revealed variation in subjective symptoms, clinical findings, application of diagnostic tests/methods, and treatment regimes. More invasive diagnostic methods (such as sialo‐scintigraphy and sialography, compared to sialometry) and systemic treatment (azathioprine and high dose corticosteroids/prednisone) were observed in the subgroup of the cohort consisting of patients included in Brazil, possibly due to a higher incidence of extraglandular manifestations.
The data presented in this study were a combination of newly acquired and retrospective data. In consequence, shortcomings include lack of new blood tests and incomplete clinical data, limiting the application of AECG and ACR/EULAR classification criteria. Different ultrasonography machines and probes were used for the SGUS examinations, possibly affecting the results obtained. To move forward, a prospective study with a more rigorous design, a more standardized regime for data collection, and international collaborations are necessary to characterize this rare condition and establish adequate criteria for diagnosis and classification.
In conclusion, findings in the juvenile SS patients studied indicate an association between SGUS results, hyposalivation, and autoantibodies. In many patients, SGUS status was also associated with salivary gland swelling, a previously known and common clinical finding in juvenile SS. SGUS is an interesting diagnostic tool for identifying patients with juvenile SS.
Author Contributions
All authors were involved in drafting the article or revising it critically for important intellectual content, and all authors approved the final version to be submitted for publication. Dr. Hammenfors had full access to all of the data in the study and takes responsibility for the integrity of the data and the accuracy of the data analysis.
Study conception and design
Hammenfors, Valim, Brun, Jonsson.
Acquisition of data
Hammenfors, Valim, Bica, Pasoto, Lilleby, Nieto‐González, Silva, Mossel, Pereira, Coelho, Bootsma, Thatayatikom, Jonsson.
Analysis and interpretation of data
Hammenfors, Jonsson.
Acknowledgments
The authors thank Dr. Roland Jonsson for invaluable advice on conception and design of the study, for providing a sound scientific environment encouraging collaborations, and for critical commentary on the manuscript. We also thank Jannicke Igland at the Department of Global Public Health and Primary Care, University of Bergen, for valuable advice on statistical analyses.
Supported by the University of Bergen (Strategic Programme for International Research and Education) and the European Union (projects NECESSITY [H2020‐JTI‐IMI2/806975] and HarmonicSS [H2020‐SC1‐2016‐RTD/731944]). Dr. Hammenfors’ work was supported by Helse Vest Regional Health Authority.
1Daniel S. Hammenfors, MD, Johan G. Brun, MD, PhD: University of Bergen and Haukeland University Hospital, Bergen, Norway; 2Valéria Valim, MD, PhD, Aline Coelho, MD: Federal University of Espírito Santo, Vitória, Brazil; 3Blanca E. R. G. Bica, MD, PhD: Hospital Universitário Clementino Fraga Filho, Federal University of Rio de Janeiro, Rio de Janeiro, Brazil; 4Sandra G. Pasoto, MD, PhD, Clovis A. Silva, MD, PhD, Rosa M. R. Pereira, MD, PhD: Hospital das Clinicas, Faculdade de Medicina da Universidade de Sao Paulo, Sao Paulo, Brazil; 5Vibke Lilleby, MD, PhD: Oslo University Hospital, Oslo, Norway; 6Juan Carlos Nieto‐González, MD: Hospital General Universitario Gregorio Marañón, Madrid, Spain; 7Esther Mossel, MD, Hendrika Bootsma, MD, PhD: University Medical Centre Groningen, University of Groningen, Groningen, The Netherlands; 8Akaluck Thatayatikom, MD: University of Florida, Gainesville; 9Malin V. Jonsson, DMD, PhD: University of Bergen, Bergen, Norway.
No potential conflicts of interest relevant to this article were reported.
References
- 1. Jonsson R, Bolstad AI, Brokstad KA, Brun JG. Sjögren's syndrome: a plethora of clinical and immunological phenotypes with a complex genetic background. Ann N Y Acad Sci 2007;1108:433–47. [DOI] [PubMed] [Google Scholar]
- 2. Vitali C, Bombardieri S, Jonsson R, Moutsopoulos HM, Alexander EL, Carsons SE, et al. Classification criteria for Sjögren's syndrome: a revised version of the European criteria proposed by the American‐European Consensus Group. Ann Rheum Dis 2002;61:554–8. [DOI] [PMC free article] [PubMed] [Google Scholar]
- 3. Johnsen SJ, Brun JG, Gøransson LG, Småstuen MC, Johannesen TB, Haldorsen K, et al. Risk of non‐Hodgkin's lymphoma in primary Sjögren's syndrome: a population‐based study. Arthritis Care Res (Hoboken) 2013;65:816–21. [DOI] [PubMed] [Google Scholar]
- 4. Anaya JM, Ogawa N, Talal N. Sjögren's syndrome in childhood. J Rheumatol 1995;22:1152–8. [PubMed] [Google Scholar]
- 5. Lieberman SM. Childhood Sjögren syndrome: insights from adults and animal models. Curr Opin Rheumatol 2013;25:651–7. [DOI] [PMC free article] [PubMed] [Google Scholar]
- 6. Cimaz R, Casadei A, Rose C, Bartunkova J, Sediva A, Falcini F, et al. Primary Sjögren syndrome in the paediatric age: a multicentre survey. Eur J Pediatr 2003;162:661–5. [DOI] [PubMed] [Google Scholar]
- 7. Fang QG, Liu FY, Sun CF. Recurrent submandibular gland swelling as a first manifestation in a child with primary Sjögren syndrome. J Craniofac Surg 2013;24:e413–5. [DOI] [PubMed] [Google Scholar]
- 8. Nikitakis NG, Rivera H, Lariccia C, Papadimitriou JC, Sauk JJ. Primary Sjögren syndrome in childhood: report of a case and review of the literature. Oral Surg Oral Med Oral Pathol Oral Radiol Endod 2003;96:42–7. [DOI] [PubMed] [Google Scholar]
- 9. Bogdanovic R, Basta‐Jovanovic G, Putnik J, Stajic N, Paripovic A. Renal involvement in primary Sjögren syndrome of childhood: case report and literature review. Mod Rheumatol 2013;23:182–9. [DOI] [PubMed] [Google Scholar]
- 10. Schuetz C, Prieur AM, Quartier P. Sicca syndrome and salivary gland infiltration in children with autoimmune disorders: when can we diagnose Sjögren syndrome? Clin Exp Rheumatol 2010;28:434–9. [PubMed] [Google Scholar]
- 11. Yokogawa N, Lieberman SM, Alawi F, Bout‐Tabaku S, Guttenberg M, Sherry DD, et al. Comparison of labial minor salivary gland biopsies from childhood Sjögren syndrome and age‐matched controls. J Rheumatol 2014;41:1178–82. [DOI] [PubMed] [Google Scholar]
- 12. Houghton K, Malleson P, Cabral D, Petty R, Tucker L. Primary Sjögren's syndrome in children and adolescents: are proposed diagnostic criteria applicable? J Rheumatol 2005;32:2225–32. [PubMed] [Google Scholar]
- 13. Shiboski CH, Shiboski SC, Seror R, Criswell LA, Labetoulle M, Lietman TM, et al. 2016 American College of Rheumatology/European League Against Rheumatism classification criteria for primary Sjögren's syndrome: a consensus and data‐driven methodology involving three international patient cohorts. Arthritis Rheum 2017;69:35–45. [DOI] [PMC free article] [PubMed] [Google Scholar]
- 14. De Vita S, Lorenzon G, Rossi G, Sabella M, Fossaluzza V. Salivary gland echography in primary and secondary Sjögren's syndrome. Clin Exp Rheumatol 1992;10:351–6. [PubMed] [Google Scholar]
- 15. Obinata K, Sato T, Ohmori K, Shindo M, Nakamura M. A comparison of diagnostic tools for Sjögren syndrome, with emphasis on sialography, histopathology, and ultrasonography. Oral Surg Oral Med Oral Pathol Oral Radiol Endod 2010;109:129–34. [DOI] [PubMed] [Google Scholar]
- 16. Milic VD, Petrovic RR, Boricic IV, Marinkovic‐Eric J, Radunovic GL, Jeremic PD, et al. Diagnostic value of salivary gland ultrasonographic scoring system in primary Sjögren's syndrome: a comparison with scintigraphy and biopsy. J Rheumatol 2009;36:1495–500. [DOI] [PubMed] [Google Scholar]
- 17. Salaffi F, Argalia G, Carotti M, Giannini FB, Palombi C. Salivary gland ultrasonography in the evaluation of primary Sjögren's syndrome: comparison with minor salivary gland biopsy. J Rheumatol 2000;27:1229–36. [PubMed] [Google Scholar]
- 18. Cornec D, Jousse‐Joulin S, Marhadour T, Pers JO, Boisrame‐Gastrin S, Renaudineau Y, et al. Salivary gland ultrasonography improves the diagnostic performance of the 2012 American College of Rheumatology classification criteria for Sjögren's syndrome. Rheumatology (Oxford) 2014;53:1604–7. [DOI] [PubMed] [Google Scholar]
- 19. Carotti M, Ciapetti A, Jousse‐Joulin S, Salaffi F. Ultrasonography of the salivary glands: the role of grey‐scale and colour/power Doppler. Clin Exp Rheumatol 2014;32 Suppl 80:S61–70. [PubMed] [Google Scholar]
- 20. Nieto‐Gonzalez JC, Monteagudo I, Bello N, Martinez‐Estupinan L, Naredo E, Carreno L. Salivary gland ultrasound in children: a useful tool in the diagnosis of juvenile Sjögren's syndrome. Clin Exp Rheumatol 2014;32:578–80. [PubMed] [Google Scholar]
- 21. Civilibal M, Canpolat N, Yurt A, Kurugoglu S, Erdamar S, Bagci O, et al. A child with primary Sjögren syndrome and a review of the literature. Clin Pediatr (Phila) 2007;46:738–42. [DOI] [PubMed] [Google Scholar]
- 22. Lee J, Koh JH, Kwok SK, Park SH. The EULAR Sjögren's Syndrome Patient‐Reported Index is an independent determinant of health‐related utility values of Korean patients with primary Sjögren's syndrome. Clin Exp Rheumatol 2016;34:663–7. [PubMed] [Google Scholar]
- 23. Seror R, Bowman SJ, Brito‐Zeron P, Theander E, Bootsma H, Tzioufas A, et al. EULAR Sjögren's syndrome disease activity index (ESSDAI): a user guide. RMD Open 2015;1:e000022. [DOI] [PMC free article] [PubMed] [Google Scholar]
- 24. Haugen AJ, Peen E, Hulten B, Johannessen AC, Brun JG, Halse AK, et al. Estimation of the prevalence of primary Sjögren's syndrome in two age‐different community‐based populations using two sets of classification criteria: the Hordaland Health Study. Scand J Rheumatol 2008;37:30–4. [DOI] [PubMed] [Google Scholar]
- 25. Virdee S, Greenan‐Barrett J, Ciurtin C. A systematic review of primary Sjögren's syndrome in male and paediatric populations. Clin Rheumatol 2017;36:2225–36. [DOI] [PMC free article] [PubMed] [Google Scholar]
- 26. Ramirez Sepulveda JI, Kvarnstrom M, Eriksson P, Mandl T, Norheim KB, Johnsen SJ, et al. Long‐term follow‐up in primary Sjögren's syndrome reveals differences in clinical presentation between female and male patients. Biol Sex Differ 2017;8:25. [DOI] [PMC free article] [PubMed] [Google Scholar]
- 27. Goransson LG, Haldorsen K, Brun JG, Harboe E, Jonsson MV, Skarstein K, et al. The point prevalence of clinically relevant primary Sjögren's syndrome in two Norwegian counties. Scand J Rheumatol 2011;40:221–4. [DOI] [PubMed] [Google Scholar]
- 28. Hammenfors DS, Brun JG, Jonsson R, Jonsson MV. Diagnostic utility of major salivary gland ultrasonography in primary Sjögren's syndrome. Clin Exp Rheumatol 2015;33:56–62. [PubMed] [Google Scholar]
- 29. Yokogawa N, Lieberman SM, Sherry DD, Vivino FB. Features of childhood Sjögren's syndrome in comparison to adult Sjögren's syndrome: considerations in establishing child‐specific diagnostic criteria. Clin Exp Rheumatol 2016;34:343–51. [PubMed] [Google Scholar]
- 30. Both T, Dalm VA, van Hagen PM, van Daele PL. Reviewing primary Sjögren's syndrome: beyond the dryness. From pathophysiology to diagnosis and treatment. Int J Med Sci 2017;14:191–200. [DOI] [PMC free article] [PubMed] [Google Scholar]
- 31. Bossini N, Savoldi S, Franceschini F, Mombelloni S, Baronio M, Cavazzana I, et al. Clinical and morphological features of kidney involvement in primary Sjögren's syndrome. Nephrol Dial Transplant 2001;16:2328–36. [DOI] [PubMed] [Google Scholar]
- 32. Pertovaara M, Korpela M, Pasternack A. Factors predictive of renal involvement in patients with primary Sjögren's syndrome. Clin Nephrol 2001;56:10–8. [PubMed] [Google Scholar]
- 33. Vitali C, Bombardieri S, Moutsopoulos HM, Balestrieri G, Bencivelli W, Bernstein RM, et al. Preliminary criteria for the classification of Sjögren's syndrome: results of a prospective concerted action supported by the European Community. Arthritis Rheum 1993;36:340–7. [DOI] [PubMed] [Google Scholar]