Abstract
Glioblastoma multiforme (GBM) is a highly proliferative cancer with generally poor prognosis and accumulating evidence has highlighted the potential of long noncoding RNAs (lncRNAs) in the biological behaviors of glioma cells. This study focused on the identification of lncRNAs to identify targets for possible GBM prognosis. Microarray expression profiling found that 1,759 lncRNAs and 3,026 messenger RNAs (mRNAs) were upregulated, and 1932s lncRNA and 2,979 mRNAs were downregulated in GBM. Bioinformatics analysis and experimental verification identified TCONS_00020456 (TCON) for further analysis. In situ hybridization, along with immunohistochemical and receiver operating characteristic analysis determined TCON (truncation value = 3.5) as highly sensitive and specific in GBM. Grade IV patients with glioma life span with different lncRNA staining scores were analyzed. TCON staining scores below 3.5 indicated poor prognosis (life span ranging from 0.25 to 7 months), even if the glioma was surgically removed. TCON decreased significantly in GBM, and showed a coexpressional relationship with Smad2 and protein kinase C α (PKCα). Overexpression of TCON reduced the proliferation on one hand and migration, invasion on the other. TCON also inhibited epithelial–mesenchymal transformation and glioma progression in vivo, based on a nude mouse tumorigenicity assay. In addition, we predicted a potential binding site and intersection that microRNAs targeting Smad2, PKCα, and TCON through RACE pretest and bioinformatics analysis. Taken together, TCON, regarded as oncosuppressor, targeting the Smad2/PKCα axis plays a novel role in inhibiting the malignant progression of glioma. Moreover, it also demonstrates that the level of TCON can be used as a prognostic and diagnostic biomarker for GBM.
Keywords: glioblastoma, long noncoding RNA, PKCα, Smad2, tumorigenicity
This study focused on the identification of long noncoding RNAs (lncRNAs) to identify possible targets for GBM therapy. We believe that our study makes a significant contribution to the literature because few studies have investigated the role of lncRNA in cancer progression. This is the first study to characterize the role of TCONS_00020456 in Smad2 and protein kinase C α cross‐talk.
1. INTRODUCTION
The highly proliferative and invasive hallmarks of glioblastoma account for its dismal prognosis. The life expectancy of patients with glioblastoma multiforme (GBM) is approximately 15 months from the time of diagnosis (Stupp et al., 2005). The World Health Organization (WHO) classification of central nervous system tumors aids in the evaluation of histological histopathology and provides prognostic predictions for patients but has limitations when used alone (Antal et al., 2015; Weller et al., 2013). A number of studies have revealed that novel molecular targets contribute to the increased accuracy in diagnosis and the classification of primary brain tumors, as well as increasing the effectiveness of therapeutic treatment decisions (Weller et al., 2013). Nevertheless, molecular markers are mostly focused on proteins assisting glioma assessment in modern neuro‐oncology. The genes are transcribed into messenger RNA (mRNA), which are then translated into proteins that are ultimately responsible for all cellular functions. However, long noncoding RNAs (lncRNAs) also play important roles in normal physiological processes and can contribute to human diseases, such as cancer (Mendell, 2016), and glioma is no exception. Actually, only 1.5% of human genome DNA pairs are responsible for encoding proteins (Mendell, 2016). Noncoding RNAs (ncRNAs) are potential targets for disease treatment and drug discovery (Matsui & Corey, 2017). These transcripts are distributed in many organs, yet the functions of few ncRNAs are illuminated. Recent work studying the molecular mechanisms of lncRNAs has provided new insights into how lncRNAs control cellular function by coordinating regulatory proteins, localizing to target loci, remodeling chromatin architecture, RNA stabilization and transcription regulation, including enhancer‐associated activity, and so forth lncRNA (MALAT1) was first discovered in metastatic lung cancer cells (Ji et al., 2003). Gutschner, Hammerle, and Diederichs (2013) evaluated MALAT1 expression associated with metastasis and reduced patient survival; MALAT1 inhibition resulted in the reduction of cell proliferation, migration, and invasion capacity. Yang et al described that two lncRNAs, PRNCR1 and PCGEM1, that activated androgen receptors and enhanced androgen‐receptor‐associated transcriptional programs promoted cancer growth (Schmitt & Chang, 2013). Recently, the discovery of lncRNAs and related studies are increasing in major biological processes including evolution, development, metabolism, and oncogenesis (Wang et al., 2016). Uncovering cancer‐associated lncRNAs would reveal a new level of the tumor progression mechanism. Therefore, comprehensive studies on specific lncRNA expression patterns should be encouraged.
This study explored the specific expression patterns of lncRNAs in the human brain malignant glioma cell line U251 and profiled the lncRNAs and mRNA expression signatures. TCONS_00020456 was chosen as the focus, and the specific effect of TCONS_00020456 on glioma cells was evaluated by functional in vitro and in vivo experiments.
2. MATERIALS AND METHODS
2.1. Patients and samples
Tumor tissue samples from 148 glioma patients were collected from the surgical specimen archives of the Affiliated Hospital of Xuzhou Medical University, Xuzhou, China, between January 2006 and April 2008 with written informed consent from the patients. Each animal experimental procedure had received the approval of the animal care committee of Xuzhou Medical University. The tissue microarray was processed by Outdo Biotech Co. Ltd. (Shanghai, China).
2.2. Cell lines and cell culture
Human glioma cell line U251, U87 (authenticated by STR profiling, Carlsbad, CA) and normal human astrocytes (HA) were cultured as previously described (Tang et al., 2018). HAs were maintained in the astrocyte medium (ScienCell Research Laboratories, Carlsbad, CA). Glioma cells were maintained in Dulbecco's modified Eagle's medium (high glucose; Gibco, Invitrogen) supplemented with 10% fetal bovine serum (FBS; Gibco, Invitrogen) at 37°C and 5% CO2 in a CO2 incubator (Thermo Fisher Scientific).
2.3. Selecting lncRNA biomarkers
The difference between the raw processed signal across three U251 samples (U) and three HA samples (H), marked as were calculated. Umax and Umin represented the maximum and minimum raw gProcessedSignal in U251 samples, respectively; Hmax and Hmin represented the maximum and minimum raw gProcessedSignal in HA samples, respectively. A lncRNA was specifically defined as a candidate biomarker if Umax − Umin and Hmax − Hmin were smaller than A/10.
2.4. RNA extraction
Trizol reagent (Invitrogen, Carlsbad, CA) was used for RNA isolation. RNA concentration and purification were determined by ultraviolet spectrophotometry (BioDee, Biotechnology Co. Ltd, Beijing, China).
2.5. LncRNA and mRNA microarray expression profiling
LncRNA and mRNA expressions were determined using a CapitaBio Technology Human LncRNA Array v4 (CapitalBio, Beijing, China). Double‐stranded complementary DNAs (cDNAs) were synthesized from 1 μg total RNA. cDNA was labeled with Cy3‐dCTP or Cy5‐dCTP (GE Healthcare, Piscataway, NJ) and hybridized onto a human lncRNA + mRNA Array V4.0 (4 × 180 K; Agilent, Santa Clara, CA), comprising 40,916 human lncRNAs and approximately 34,000 human mRNAs. The lncRNA and mRNA target sequences were merged from ENSEMBL, human long intervening/intergenic ncRNA, and the LNCipedia catalog.
Threshold values of ≥2 and ≤2‐fold change and a Benjamini‐Hochberg corrected p = .05 were used to identify differentially expressed genes. The data were analyzed using hierarchical clustering with average linkage. Java Treeview software (Stanford University School of Medicine, Stanford, CA) was employed to visualize the microarray results. The primers are listed in Table S1.
2.6. Coexpression network construction and functional group analysis
LncRNAs and mRNAs with Pearson correlation coefficients greater than 0.985 were selected to draw the network using Cytoscape software version 3.1.1 (U.S. National Institute of General Medical Science, Washington, DC). Gene Ontology (GO) analysis identified the primary functions of differentially expressed mRNA. Pathway analysis of the differentially expressed mRNA was based on the Kyoto Encyclopedia of Genes and Genomes (KEGG) database.
2.7. Fluorescence in situ hybridization and immunohistochemical analysis
RNA fluorescence in situ hybridization (FISH) was carried out on glioma tissue and 5‐μm‐thin paraffin sections, using T7 probes (F: AAACGCTCGTACCCTGACT, R: TAATACGACTCACTATAGGGTTGAACCACCAAGGGTTGCT) against TCONS_00020456 lncRNA labeled with streptavidin‐horseradish peroxidase at the 5′ and 3′ ends (BOSTER Biological Technology, WuHan, China), as previously described (de Planell‐Saguer, Rodicio, & Mourelatos, 2010). The slides were digested with protein K (2 μg/ml, Sangon Biotech, Shanghai, China) at 37°C for 30 min, then prehybridized with an antisense or sense probe with final concentrations of 100 ng/ml for 2 hr at 37°C. Slides were incubated in a blocking buffer (Roche) for 30 min, followed by anti‐streptavidin/HRP antibody preabsorbed at a dilution of 1:2,000 for another 40 min in a humidified chamber (50–60%) at room temperature (20–24℃). Staining was performed using hematoxylin (blue) as the background color and 3, 3′‐diaminobenzidine (brown) to reveal positively stained tissue areas. Visualization was performed on a Leica DM5000B microscope.
2.8. Glioma staining assessment
Staining score = the depth of glioma staining × ratio of stained cells. The staining depth was divided into 0 (negative), 1 (weak positive), 2 (moderate positive), and 3 (strong positive). The proportion of stained cells was divided into 1 (1–24% positive tumor cells), 2 (25–49% positive tumor cells), 3 (50–74% positive tumor cells), and 4 (75–100% positive tumor cells). The two were multiplied to get a score of 0, 1, 2, 3, 4, 6, 8, 9, or 12. Zero was classified as negative. 1, 2, 3, and 4 were classified as weak positive, 6 and 8 were classified as moderate positive, and 9 and 12 were classified as strong positive.
2.9. Construction of stable cell lines with overexpressed OR downregulated lncRNA‐TCONS_00020456
Lenti‐CAS9‐sgRNA for TCONS_00020456 overexpression and vectors for knockout were constructed by GeneChem (Shanghai, China). Stable cell lines were generated as previously described (Li et al., 2017). U251 cells were transduced with vectors at a multiplicity of infection of 5 in the presence of 5 μg/ml polybrene. The supernatant was removed after 24 hr, and the medium with FBS was added to the U251 cells. After 72 hr, 5 μg/ml puromycin was added. The relevant empty lentivectors were employed as negative controls.
2.10. Wound healing and transwell invasion assay
Cell migration and Transwell assay were evaluated as described previously (Li et al., 2017; Sun et al., 2018).
2.11. Western blot analysis
SMAD family member 2 (Smad2), protein kinase C α (PKCα), E‐cadherin, N‐cadherin, vimentin, p44/42 MAPK (Erk1/2), phospho‐p44/42 MAPK (p‐Erk), JNK, and phospho‐SAPK/JNK (Thr183/Tyr185) were determined by western blot. Cells were collected, and cell lysates (P0013B; Beyotime Biotechnology, Shanghai, China) were prepared. Proteins extracted from the experimental and control groups were denatured, electrophoretically separated by 8–12% sodium dodecyl sulfate‐polyacrylamide gel electrophoresis and transferred onto nitrocellulose membranes (EMD Millipore, Billerica, MA). The membranes were incubated overnight at 4°C with the primary antibodies. The detail antibodies information was supplied in supplementary materials. The blots were incubated for 2 hr with goat anti‐rabbit (Lot No. C60321‐05) secondary antibodies (1:1,000; LI‐COR Biosciences, Lincoln, NE). All protein bands were scanned using the Odyssey Infrared Laser Scanning Image System (LI‐COR Biosciences). Membrane bands were analyzed using Image J 1.48v software (National Institutes of Health, Bethesda, MD).
2.12. Nude mouse glioma model in vivo
Four‐week‐old female BALB/c nude mice were purchased from LinChang Biotechnology Co. Ltd. (Shanghai, China). U87 cells were infected and a single‐cell suspension of 1 × 10⁷/ml U87 was prepared. One hundred microliters were subcutaneously injected into the left axillary of the nude mice. Groups consisted of the control, overexpression (OE), and Konck‐Down (KD) groups. Tumors were observed on the 18th day and were allowed to grow for another 22 days until the tumor diameter reached approximately 1.2 cm with a total volume of 1.5 cm3. The short and long tumor diameters were recorded with vernier callipers. Tumor volume was calculated as V = diameter length × short radius2, centimeter).
2.13. Immunohistochemical assay
All tissues were fixed overnight in a formalin solution, dehydrated in ethanol, embedded in paraffin, and sectioned at 5 µm. The slides were blocked with 5% normal goat serum and incubated with anti‐PKCα and anti‐smad2 at 4℃. After washing with phosphate‐buffered saline, the slides were incubated with goat anti‐rabbit horseradish peroxidase (Vector Laboratories, Burlingame, CA) for 30 min at room temperature. A DAB kit (MXB Biotechnologies, DAB‐1031, China) was used to detect the immunohistochemically reactions. The slides were examined under a phase‐contrast light microscope (Olympus), and the integral optical density of each positively stained slide was measured using an Image‐Pro plus 6.0 true‐color image analysis system.
2.14. RACE pretest
At 80% confluency of cells, RNA samples were extracted with TRIzol (Invitrogen). The cDNA was synthesized from the extracted RNA with RevertAid Reverse Transcriptase (#EP0441; Thermo Fisher Scientific). The cDNA was used for polymerase chain reaction (PCR) after fivefold diluted concentration. The primer sequences were as follows: Forward primer (FP 5′‐3′): GACACAGGCGTGGCCAAACATAG, Reverse primer‐1 (RP1, 5′‐3′): TTCCCAAAACCCTGGCAAACACT, RP2: TAATAGCCGCGTGCTTGCATGTT, and RP3: AGTAGATGACTTCAAGCAACTCGGC. Reaction conditions: 95°C, initial denaturation, 3 min; 95°C, denaturation, 10 s; 58–65°C (the four temperature gradients used are 58, 60, 62, and 65°C), anneal, 10 s; 72°C, elongation, 30 s; amplification, 20, 25, 30, or 35 cycles.
2.15. Target prediction
miRWalk (http://zmf.umm.uni-heidelberg.de/apps/zmf/mirwalk/micrornapredictedtarget.html, last updated March 15, 2013) was used to predict microRNAs (miRNAs) that might target Smad2 and PKCα mRNA (Dweep, Sticht, Pandey, & Gretz, 2011) were used. All predicted targets are freely accessible from miRDB (http://www.mirdb.org). Venny's online software (http://bioinfogp.cnb.csic.es/tools/venny/) was used for Venn diagrams.
2.16. Statistical analysis
Quantitative data were presented as the mean ± standard deviation. SPSS software (version 19.0; SPSS Inc., Chicago, IL) and GraphPad Prism 6.0 software (GraphPad Software Inc., La Jolla, CA) were used. The t test and one‐way analysis of variance were used followed by the Student–Newman–Keuls test to test check differences. KEGG and GO analysis were performed using DAVID (http://david.abcc.ncifcrf.gov/). The Kaplan–Meier survival test was to assess the statistical significance between survival groups using the 3.5 value as the cut‐off from the receiver operating characteristic (ROC) analysis. Several independent microarray databases from the Oncomine database (https://www.oncomine.org/resource/login.html) were used to investigate smad2 and PKCα expression.
3. RESULTS
3.1. lncRNA and mRNA expression profiles in glioblastoma cells
Based on p ≤ .05 and |log fold change (FC)| ≥ 2, a total of 13,191 lncRNAs and 21,506 mRNAs were detected in three pairs of human glioma cell line U251 and normal astrocytes by microarray analysis. A scatter‐plot assessed the expression variation of lncRNAs and mRNAs in U251 samples relative to HA controls (Figure 1a,b). Volcano plot filtering identified 3,691 significantly differentially expressed lncRNAs (DE‐lncRNAs) and 6005 DE‐mRNAs (Figure 1c,d). Among the 3,691 DE‐lncRNAs, 1,759 were upregulated and 1,932 were downregulated. Subsequently, hierarchical clustering analysis obtained the distinct expression signatures of both DE‐lncRNAs and DE‐mRNAs (Figure 1e,f).
Figure 1.
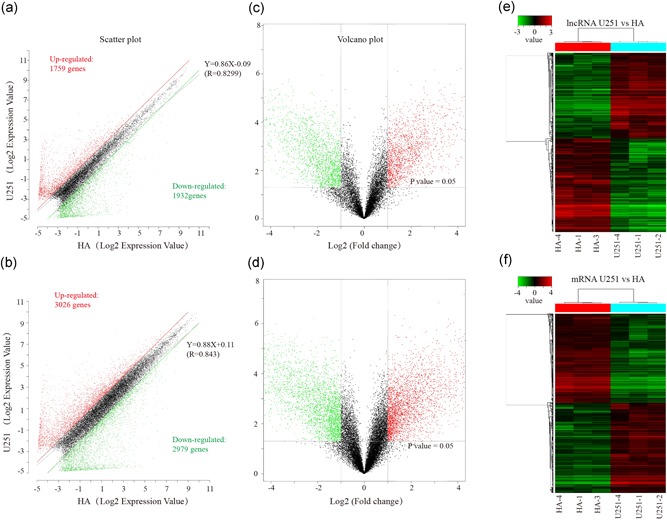
Expression profiles of lncRNAs and mRNAs in U251 glioma cells compared to HA samples. (a and b) Scatter‐plot of variation in expression of lncRNAs and mRNAs between U251 glioma cells and HA samples. X and Y axes are the mean normalized signal values (log2 scaled). The red and green lines are fold change lines (the default fold change value given is 2.0). (c and d) The Volcano plot of differentially expressed lncRNAs and mRNAs in U251 glioma cells relative to HA samples. The vertical lines represent 2.0‐fold changes up and down, and the horizontal line represents an FDR‐value of 0.05. The red and green points in the plot represent the differentially expressed lncRNAs with statistical significance. “Red” indicates high relative expression, and “green” indicates low relative expression. X‐axes are the fold change values (log2 scaled), Y axes are the FDR‐values (log2 scaled). (e and f) Hierarchical clustering analysis of lncRNAs and mRNAs. FDR, false discovery rate; HA, human astrocyte; lncRNA, long noncoding RNA; mRNA, messenger RNA
3.2. GO and pathway analysis
GO analysis (FC ≥ 2.0; p ≤ .05) provided three structured networks of defined terms: biological processes, cellular components, and molecular functions (Figure 2a,b). GO analysis revealed that the upregulated genes were involved in double‐strand break repair via break‐induced replication and cell cycle DNA replication initiation. The downregulated genes were mainly associated with cellular extravasation response.
Figure 2.
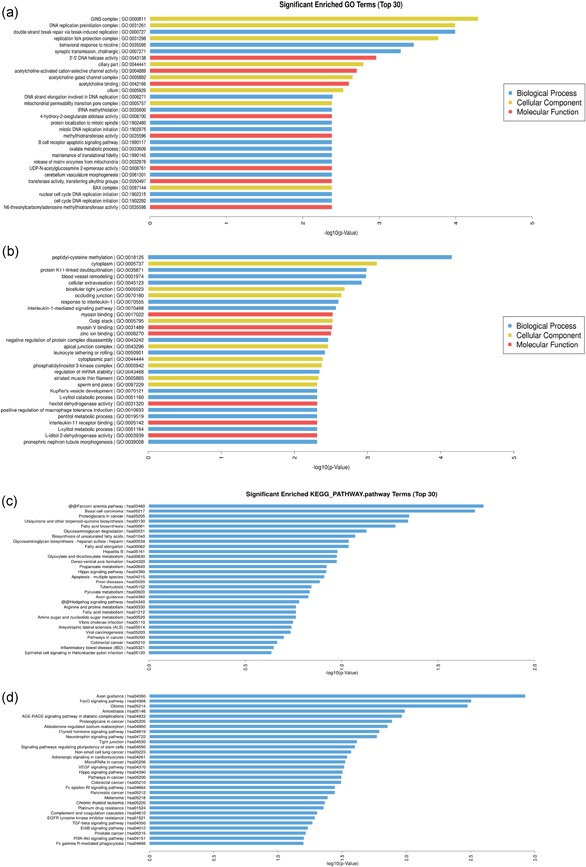
Enrichment analysis of GO terms and KEGG pathways for differentially expressed mRNAs. The value of −log10 (corrected p value) was calculated to reflect the significance of GO term enrichment. The top 30 enriched GO terms of upregulated mRNAs (a) and downregulated mRNAs (c) are shown. The 30 most significant pathways of upregulated mRNAs (c). Significant pathways of the downregulated mRNAs (e). Enrichment score values were calculated as −log10 (p value). GO, Gene Ontology; KEGG, Kyoto Encyclopedia of Genes and Genome; mRNA, messenger RNA
Gene set analysis mapping of the 6,005 differentially regulated genes identified the top 30 biological pathways of upregulated mRNAs and downregulated mRNAs (Figure 2c,d). The most significant pathways targeted by upregulated and downregulated mRNA transcripts were involved in GBM pathogenesis.
3.3. Confirmation of differentially expressed lncRNAs from microarray data
Twelve upregulated lncRNAs and 26 downregulated lncRNAs from the microarray analysis were selected and assessed by reverse transcription PCR (RT‐PCR; Table S2). RT‐PCR results showed that four significantly upregulated lncRNAs and 21 downregulated lncRNAs in U251 glioma cells compared with normal HAs (Table S3; Figure 3b). Twenty‐five lncRNAs were input into the cancer genomics cBioportal and 17 lncRNAs interacted positively with mRNA (Figure 3a). LncRNA TCONS_00020456 was targeted for further study; TCONS_00020456 was one of the most downregulated lncRNAs in microarray analysis and PCR validation. mRNA related to TCONS_00020456 correlated with invasion and migration and the functional pre‐experiments indicated that TCONS_00020456 acted as a glioblastoma oncogene. Analysis of the mRNA targeted by TCONS_00020456 using Uniprot and enriched GO related to cell migration and invasion highlighted Smad2 and PKCα as targets for further detection.
Figure 3.
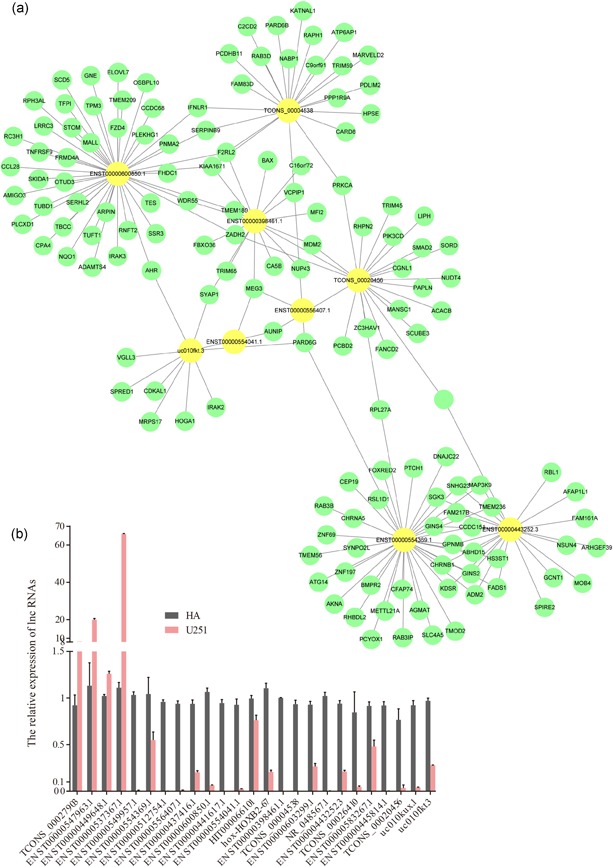
The lncRNA–mRNA coexpression network and RT‐PCR confirmation of 34 differentially expressed lncRNAs. (a) The lncRNA–mRNA network graph, based on the correlation analysis between the differentially expressed lncRNAs and mRNAs, showed that differentially expressed mRNAs were associated with 17 lncRNAs. Yellow nodes represent the lncRNAs and green nodes represent the target mRNAs. (b) 38 selected lncRNAs differentially expressed were validated by quantitative real‐time PCR. Comparison of the qPCR expression fold change of 17 candidate lncRNAs in U251 cells and HA cells. The bars represent the standard error. HA, human astrocyte; lncRNA, long noncoding RNA; mRNA, messenger RNA; RT‐PCR, reverse transcription‐polymerase chain reaction
3.4. TCONS_00020456 expression level correlated with glioma grades
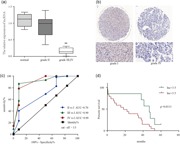
Different WHO grades of tumor tissue were subjected to TCONS_00020456 expression analysis (Figure 4). TCONS_00020456 expression was significantly correlated with the pathological grades. TCONS_00020456 expression decreased in high WHO grades compared with lower grades (Figure 4a). Immunohistochemistry combined with RNA FISH assay also demonstrated that TCON stained with HRP is expressed mainly in low‐grade gliomas. The image of low‐grade glioma showed more dark brown areas apparently (Figure 4b). In addition, we further explored whether pathological types of glioma interfere with the correlation outcome. It was gratifying to get the nonsignificant result, which indicates that the level of TCONS_00020456 was related to the WHO grades of glioma but not the pathological types (Table 1).
Figure 4.
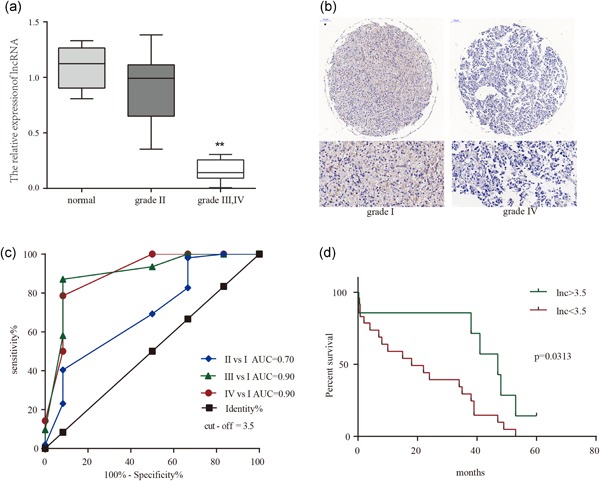
LncRNA‐ TCONS_00020456 expression signature through FISH and immunohistochemical (IHC) analysis, and evidence that decreased lncRNA‐TCONS_00020456 confers poor prognosis in glioma patients. (a) The staining score of lncRNA in diffuse astrocytoma samples of different grades. (b) Representative images of IHC staining for T7 probe lncRNA. Left, Grade I; Right, Grade IV. (c) ROC curves of lncRNA‐TCONS_00020456 in the microarray samples of different WHO grade gliomas. LncRNA value in predicting the risk of high‐grade glioma is high, the area under the ROC curve was 0.8988, the 95% confidence interval (CI) was 0.7817–1.0106, and the cut‐off staining score value was 3.5. Sensitivity was 78.57% (95% CI: 59.05–91.70%) and specificity was 91.67% (95% CI: 61.52–99.79%) (d) Overall survival was determined by Kaplan–Meier survival curves, and a log‐rank test was used to assess the statistical significance of the differences. FISH, fluorescence in situ hybridization; lncRNA, long noncoding RNA; ROC, receiver operating characteristic; WHO, World Health Organization
Table 1.
Characteristics of glioma patients
| Characteristic | Patient frequency | TCONS_00020456 | Pearson χ 2 | p Value | |
|---|---|---|---|---|---|
| Low | High | ||||
| Total gender | 104 | 62 | 42 | ||
| Male | 61 (58.7%) | 34 | 27 | 0.820 | .365 |
| Female | 43 (41.3%) | 28 | 15 | ||
| Glioma grade | |||||
| Low | 50 (48.1%) | 18 | 32 | 22.306 | <.001 |
| High | 54 (51.9%) | 44 | 10 | ||
| Pathological type | |||||
| Diffuse astrocytoma | 55 (52.9%) | 34 | 21 | 0.3 | .861 |
| Glioblastoma | 20 (19.2%) | 11 | 9 | ||
| Anaplastic astrocytoma | 29 (27.9%) | 17 | 12 | ||
3.5. Decreased TCONS_00020456 expression indicated a short life span and was a prognostic factor when combined with WHO grade
The cut‐off value for distinguishing between WHO grades were 3.5, which showed relatively high sensitivity of 87.1% (95% CI: 71–96%), and specificity of 92% (95% confidence interval [CI]: 62–99%; Figure 4c). Comparison between IV and I, III and I, and II and I, resulted in an area under the ROC curve of 0.90, 0.90, and 0.70, respectively. Further survival analysis was based on these values. High‐grade glioma patients with lnc less than 3.5 had a shorter survival period, suggesting a potential link between a low lnc expression level and human high‐grade glioma progression (Figure 4d). Death was regarded as the outcome variable, and logistic regression results are shown in Table 2. The lnc level coupled with WHO grade is of high value in prognosis determination in spite of marginal significance.
Table 2.
Variables in the logistic regression equation based on binary logistics
| Variables in the equation | |||||
|---|---|---|---|---|---|
| B | SE | Wald | Sig. | Exp (B) | |
| Lnc and grades | −0.107 | 0.054 | 3.845 | 0.05 | 0.899 |
| Constant | 2.143 | 0.850 | 6.438 | 0.012 | 8.522 |
Abbreviation: SE, standard error.
3.6. TCONS_00020456 regulated epithelial–mesenchymal transition‐related proteins and signal pathways
qRT‐PCR assays showed significantly lower TCONS_00020456 expression in tumor tissues than in normal tissues. These results indicated that TCONS_00020456 functioned as a glioma oncogene and prompted the investigation of TCONS_00020456 function. qRT‐PCR assays revealed that TCONS_00020456 increased by 7.5‐fold in U251‐TCONS_00020456 stable cell lines, while TCONS_00020456 decreased by 81.5% in U251‐si‐TCONS_0002045 stable cell lines compared with those in the control cell lines (Figure 5a,b). Cell invasion and migration abilities indicated that TCONS_00020456 knockdown significantly promoted U87 and U251 cell invasion and migration, while TCONS_00020456 upregulation significantly inhibited U251 and U87 cell invasion and migration in vitro (Figure 5d–g). The phosphorylation levels of c‐Jun N‐terminal kinase (JNK) and extracellular signal‐regulated kinase (ERK) targeted by PKCα were elevated after TCONS_00020456 knockdown (Figure 5k). TCONS_00020456 downregulation in glioma may be related to PKCα‐ERK and ‐JNK pathway activation. Epithelial–mesenchymal transition (EMT) related proteins were compared in the three groups. TCONS_00020456 downregulation enhanced the EMT process as reflected through the detection of N‐cadherin, vimentin, and E‐cadherin (Figure 5n–q). The relative expression values of Smad2 and PKCα in Sun Brain Oncomine datasets were nontumor = 22, GBM = 105, and nontumor = 23, GBM = 26, respectively (Figure 5r,s).
Figure 5.
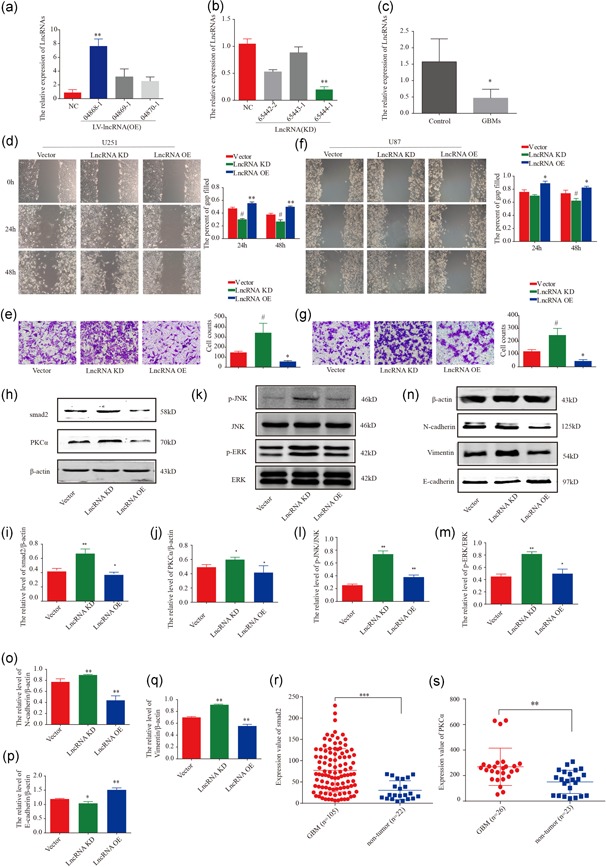
TCONS_00020456 affects the migration and invasion abilities of glioma cells and the expression of related proteins. (a) U251 cells were transfected with LV‐lncRNA‐sgRNA (LncRNA OE: 04868‐1, 04869‐1, 04860‐1), and LV‐vector (NC). TCONS_00020456 levels were examined by qRT‐PCR (**p < .01). (b) U251 cells were transfected with LV‐vector (Negative control, NC) and lentivirus‐RNAi (LncRNA‐KD: 65444‐1; 65443‐1; 65442‐1); TCONS_00020456 levels were examined by qRT‐PCR (**p < .01). (c) TCONS_00020456 expression detected by qRT‐PCR assay in six paired GBM tissues (n = 6), (*p < .05, paired Student's t test). (d and f) Wound‐healing assays were performed to detect the migration of U87 and U251 cells. (e and g) Transwell assays were used to measure the invasion (OE group compared with control, *p < .05; KD group compared with control, # p < 0.05); (h–j) Western blot was used to determine the overexpression or knockdown of TCONS_00020456 on endogenous PKCα and Smad2 (*p < .05); (k–m) The levels of activated JNK and ERK were evaluated and statistical analysis was performed (*p < .05; **p < .01); (n–q) The related epithelial–mesenchymal transition proteins were checked by western blot (*p < .05; **p < .01). (r and s) The relative expression value of Smad2 in Sun Brain (nontumor = 22, GBM = 105) and PKCα in the same Oncomine datasets, Sun Brain (nontumor = 23, GBM = 26). ERK, extracellular signal‐regulated kinase; JNK, c‐Jun N‐terminal kinase; KD, knockdown; NC, negative control; OE, overexpression; PKCα, protein kinase C α; qRT‐PCR, quantitative reverse transcription‐polymerase chain reaction
3.7. TCONS_00020456 negatively promotes glioma progression in vivo
Increased tumor sizes were observed in the lncRNA–KD group (1.552 ± 0.235 g) compared with those in the LV‐vector group (0.924 ± 0.164 g) on the last day. Additionally, decreased tumor sizes were observed in the lncRNA–OE group (0.332 ± 0.078 g) compared with those in the LV‐vector group (Figure 6a,b). As a whole, the difference in tumor size was apparent over time. Tumor weight was covariant with tumor size (Figure 6c,d). These results demonstrate that TCONS_00020456 inhibited glioma progression in vivo. Furthermore, immunohistochemical showed that knockdown of lncRNA promoted the expression of Smad2 and PKCα in tumors (Figure 6e,f), consistent with the in vitro results (Figure 5f) and Oncomine database (Figure 5r,s).
Figure 6.
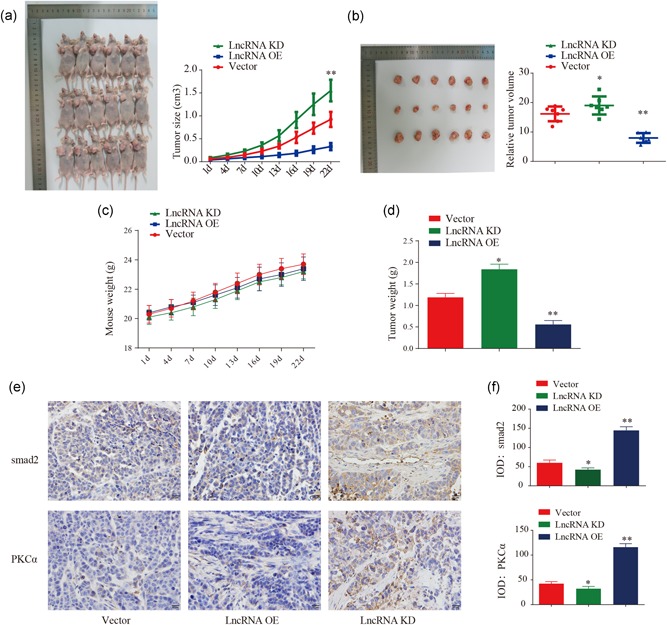
TCONS_00020456 inhibits glioblastoma tumor formation in vivo. (a) U87 cells (2 × 10⁶ cells per mouse; n = 6) were inoculated in BALB/c nude mice to establish subcutaneous xenograft tumors. The mice were euthanized at 41 days and the tumor sizes were measured (*p< .01). (b and d) Photographs of dissected tumors. The relative tumor volume and the tumor weights were measured at 41 days (*p < .01, **p < .01). (c) Mice weight was continuously monitored. (e) Representative images of immunohistochemical staining for smad2, PKCα in different groups. (f) IOD comparison of smad2/PKCα immunohistochemically staining (compared with the vector group, *p < .01, **p < .01). IOD, integral optical density; PKCα, protein kinase C α
3.8. Biological information analysis of TCONS_00020456
Biological information analysis provided a total of 13 miRNAs considered common targets of TCONS_00020456, Smad2, and PKCα collectively (Figure 7), and the RACE preliminary experiment showed that TCONS_00020456 had high specificity in glioma cells (Figure 7a). A total of 1,539 miRNAs targeting Smad2 were identified in human cell lines. Computational analysis using miRDB predicted that 83 miRNAs that would target the submitted 4,623 nucleotide lncRNA sequence. Comparison using Venny's online software revealed 13 miRNAs, namely hsa‐miR‐502‐3p, hsa‐miR‐501‐3p, hsa‐miR‐1321, hsa‐miR‐302e, hsa‐miR‐1279, hsa‐miR‐1272, hsa‐miR‐1248, hsa‐miR‐320d, hsa‐miR‐320c, hsa‐miR‐320b, hsa‐miR‐320a, hsa‐miR‐636, and hsa‐miR‐513a‐5p that would target the lncRNA sequence. Based on this prediction analysis, a 3‐set Venn diagram presenting the intersection between the target miRNA of Smad2 and PKCα mRNA, and the target miRNA of lncRNA TCONS_00020456 was created (Figure 7b). After continuous sequence alignment, only one miRNA met the criteria (hsa‐miR‐1279; Figure 7c).
Figure 7.
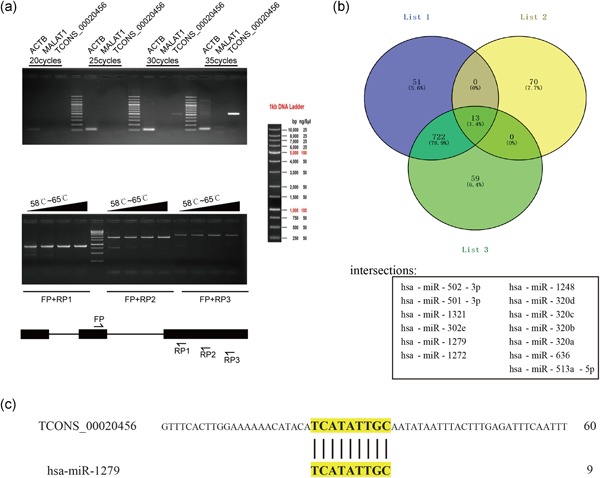
RACE pretest and intersection miRNAs targeting Smad2, PKCα, and TCONS_00020456 lncRNA. (a) Top. Transcript ratio assessment of TCONS_00020456. ACTB and MALAT1 were used as references. The length of the ACTB amplification products was 110 base pair (bp), MALAT1 was 150 bp, and TCONS_00020456 was 521 bp. Down, Specificity evaluation of TCONS_00020456 transcription products. The figure on the right shows the position of the detected primers. Above is the electrophoresis pattern of PCR products using a temperature gradient. The four temperature gradients used are 58, 60, 62, and 65°C. The marker diagram is shown on the right. (b) A three‐set Venn diagrams presenting the intersection miRNAs that might target Smad2, PRKCα, and lncRNA. List1 is the possible miRNAs targeting Smad2, List2 is the predicted miRNAs that might target lncRNA, and List 3 is the potential miRNAs targeting PKCα. The intersections are as follows: hsa‐miR‐502‐3p, hsa‐miR‐501‐3p, hsa‐miR‐1321, hsa‐miR‐302e, hsa‐miR‐1279, hsa‐miR‐1272, hsa‐miR‐1248, hsa‐miR‐320d, hsa‐miR‐320c, hsa‐miR‐320b, hsa‐miR‐320a, hsa‐miR‐636, and hsa‐miR‐513a‐5p. (c) NCBI BLAST results for lncRNA TCONS_00020456 and has‐miR‐1279. lncRNA, long noncoding RNA; miRNA, microRNA; PCR, polymerase chain reaction; PKCα, protein kinase C α
4. DISCUSSION
Our study represents the first analysis of lncRNA‐TCONS_00020456‐guided regulation of Smad2 and PKCα in GBM. TCONS_00020456 was markedly decreased in human GBM, and low TCONS_00020456 expression was significantly associated with a higher WHO grade and shorter overall survival in GBM. TCONS_00020456 was coexpressed with Smad2 and PKCα mRNAs. TCONS_00020456 downregulation aggravated cell migration, invasion and EMT of glioma cells through an interaction with Smad2 and PKCα. Smad2 is a core component of transforming growth β (TGF‐β)/Smad which contributes to the progress of EMT in cancer (Song et al., 2019).
LncRNAs are a class of ncRNA containing more than 200 nucleotides that were initially considered transcriptional noise (Deniz & Erman, 2017). LncRNAs are involved in protein modification and metabolism, recruitment of transcription factors, and cell cycle control (Huarte, 2015). Our study showed that TCONS_00020456 may decrease Smad2 levels via mediating by miRNA (hsa‐miR‐1279) indirectly or complementary base pairing in mRNA directly (Figure 7 and Figure S1). Although it is only a prediction, it is enough to indicate a research direction for our further mechanism exploration. EMT is a crucial event in the metastatic process that endows tumor cells with the ability to leave the primary tumor mass and disseminate to distant sites (Fenizia et al., 2018; Nieto, Huang, Jackson, & Thiery, 2016). EMT is triggered and maintained by the TGF‐β signaling pathway (Thiery, 2002). Coincidently, Smad2 participates in promoting transcriptional activation of EMT related transcription factors: Snail1, Slug, ZEB1/2, Twist1/2, and Sox4 (Budi, Duan, & Derynck, 2017; Macias, Martin‐Malpartida, & Massague, 2015). In our study, we checked the expression of effector proteins in EMT. EMT involves multiple components, such as vimentin and E‐cadherin (Mima et al., 2013). Vimentin is a well‐known metastasis marker whose expression is a late event in EMT that leads to the upregulation of mesenchymal genes (Kokkinos et al., 2007). E‐cadherin, which suppresses the malignant metastasis and invasion of epithelial cells, is related to the invasiveness of glioma cells (Shi et al., 2013). This study found that E‐cadherin and vimentin levels changed with changing lncRNA levels, indicating Smad2 as a promising target molecule of TCONS_00020456.
The other protein regulated by TCONS_00020456 in this study is PKCα. PKC family comprises a series of phospholipid‐dependent serine‐threonine kinases (Nishizuka, 1988) that play important roles in signal transduction and in the regulation of cell growth, differentiation, and apoptosis (Mandil et al., 2001). The PKCα signaling pathway has been widely studied in malignant gliomas, and PKCα activity was increased in gliomas and glioma cell lines (Couldwell, Antel, & Yong, 1992). Our study corroborated these findings, as the level of PKCα increased in glioma sample tissue. Moreover, it is proved that the inhibition effect of PKCα inhibitor (GF1029203X) on glioma is greatly enhanced, including migration and invasion (Figure S2). Corresponding to the low level of TCONS_00020456, PKCα increased significantly in glioma cells that contribute to cell proliferation (Hussaini et al., 2000; Mandil et al., 2001). Interestingly, PKCα has a bidirectional regulation function and can act either as an oncogene or as a tumor suppressor gene (Antal et al., 2015; Newton & Brognard, 2017). However, the overall level of PKCα increased in our study. Given the bidirectional nature of this protein, the hotspot mutation of PKCα regulated by TCONS_00020456 should be further explored. Rosenberg et al. (2018) reported that PKCα is mutated in a wide range of human cancers. Additional genetic alterations affecting the positive/negative function of PKCα in glioma development deserve additional study.
PKCα was overexpressed in breast cancer, and inhibited apoptosis and contributed to chemoresistance via the ERK signaling pathway (Pal & Basu, 2017). PKCα phosphorylation participates in the downstream activation of the NF‐κB pathway, which contributes to the development of multiple types of cancers. In human melanoma, the ERK signaling pathway upregulates JNK and activates the c‐Jun oncogene and its downstream targets, including RACK1 and cyclin D1 (Lopez‐Bergami et al., 2007). Furthermore, abnormally activated RAS proteins are the main oncogenic driver that governs the function of major signaling pathways involving ERK and protein kinase C (Khan et al., 2019). Thus, uncontrolled transcriptional expression and reprogramming in carcinogenesis are also involved in ERK activation (Ward, Braun, & Shannon, 2012). PKC cooperates with the protein Ser/Thr phosphatase, calcineurin, in transducing signals leading to JNK activation (Ghaffari‐Tabrizi et al., 1999). In the current study, we found that ERK/JNK increased when TCONS_00020456 decreased. This signal pathway should be thoroughly explored, as the specific mechanism of lncRNA in regulating protein activity would benefit this field of study.
Inevitably, lncRNAs can exert their functions through RNA–protein interactions to modulate target genes (McHugh et al., 2015). Biological information analysis identified 13 miRNAs considered common targets of TCONS_00020456, smad2, and PKCα collectively (Figure 7). This implies that TCONS_00020456 plays an oncogenic role in glioma by regulating miRNAs. LncRNA pull‐down assays should be used to identify target molecules (DNA, RNA, and proteins), through which the relationship between Smad2 or PKCα interacting with proteins and chromatin methylation, histone modification, and gene transcription can be analyzed. Based on this assumption, the RACE preliminary experiment showed that TCONS_00020456 had high specificity in glioma cells. In future studies, the RACE experiment could be conducted to obtain the full‐length lncRNA sequence, which could identify basic molecular biological properties, including length detection, protein‐coding potential analysis, intracellular distribution, and nuclear distribution. The association suggests that lncRNA could regulate mRNA expression mediated by miRNAs (Lin et al., 2015).
In summary, our findings revealed that decreased TCONS_00020456 promotes the migration, invasion, and epithelial–mesenchymal transition of glioma cells in vitro, as well as glioma progression in vivo. TCONS_00020456 could negatively regulate PKCα‐ERK/JNK and Smad2 expression levels. From the above study, TCONS_00020456 acts as an oncosuppressor in GBM. Furthermore, decreased TCON expression demonstrated a short life span and it could be a potential prognostic biomarker. However, large‐scale clinical validation is still needed.
CONFLICT OF INTERESTS
The authors declare that there are no conflict of interests.
AUTHOR CONTRIBUTIONS
C. X. T. was involved in the conception and design of the study, and drafted the manuscript; Y. W. collected data from the internet, performed bioinformatics analyses, and organized the figures and tables. L. Z. contributed reagents/materials/analysis tools. J. W. and W. W. performed partial experiments and conducted the submission of the manuscript. X. H. and C. Y. M. performed the literature search. D. S. G. acquired the funding and was involved in the conception and design of the study, supervised the study, and critically reviewed the manuscript. All authors read and approved the final manuscript.
Supporting information
Figure S1. NCBI BLAST results for the 4623 base pair lncRNA and target gene Smad2
Figure S2. GF109203X inhibits the migration and invasion of glioma cells directly. (A, B) U251 cells were treated with either 0.1% DMSO or GF109203X (a specific PKCα inhibitor), wound‐healing and transwell assay were detected respectively. (C, D) U87 cells were treated with GF109203X, migration and invasion were evaluated by the same methods. (E) The percent of gap filled was calculated based on wound‐healing results and statistical analysis was performed (t‐test, *P < 0.05). (F) Penetrating cells were counted after transwell experiment and statistical analysis was performed (t‐test, *P < 0.05)
Table S1. Primer sequences used in real‐time PCR for detecting lncRNA expression
Table S2. Thirty‐eight selected lncRNAs used as candidate biomarkers
Table S3. Expression levels of 25 lncRNAs from U251 glioma cells compared with normal human astrocytes based on RT‐PCR
ACKNOWLEDGMENT
This work was supported by the National Natural Science Foundation of China (grant no: 81772688).
Tang C, Wang Y, Zhang L, et al. Identification of novel LncRNA targeting Smad2/PKCα signal pathway to negatively regulate malignant progression of glioblastoma. J Cell Physiol. 2020;235:3835–3848. 10.1002/jcp.29278
DATA AVAILABILITY STATEMENT
The data that support the findings of this study are openly available in repository name, e.g., “figshare” at https://doi.org/[doi], reference number [reference number]. The datasets used and/or analyzed during the current study are available from the corresponding author on reasonable request. The URL of public data sources: https://www.oncomine.org
References
REFERENCES
- Antal, C. E. , Hudson, A. M. , Kang, E. , Zanca, C. , Wirth, C. , Stephenson, N. L. , & Trotter, E. W. (2015). Cancer‐associated protein kinase C mutations reveal kinase's role as tumor suppressor. Cell, 160(3), 489–502. 10.1016/j.cell.2015.01.001 [DOI] [PMC free article] [PubMed] [Google Scholar]
- Budi, E. H. , Duan, D. , & Derynck, R. (2017). Transforming growth factor‐β receptors and smads: regulatory complexity and functional versatility. Trends in Cell Biology, 27(9), 658–672. 10.1016/j.tcb.2017.04.005 [DOI] [PubMed] [Google Scholar]
- Couldwell, W. T. , Antel, J. P. , & Yong, V. W. (1992). Protein kinase C activity correlates with the growth rate of malignant gliomas: Part II. Effects of glioma mitogens and modulators of protein kinase C. Neurosurgery, 31(4), 717–724. [DOI] [PubMed] [Google Scholar]
- Deniz, E. , & Erman, B. (2017). Long noncoding RNA (lincRNA), a new paradigm in gene expression control. Functional and Integrative Genomics, 17(2‐3), 135–143. 10.1007/s10142-016-0524-x [DOI] [PubMed] [Google Scholar]
- Dweep, H. , Sticht, C. , Pandey, P. , & Gretz, N. (2011). miRWalk—database: Prediction of possible miRNA binding sites by “walking” the genes of three genomes. Journal of Biomedical Informatics, 44(5), 839–847. 10.1016/j.jbi.2011.05.002 [DOI] [PubMed] [Google Scholar]
- Fenizia, C. , Bottino, C. , Corbetta, S. , Fittipaldi, R. , Floris, P. , Gaudenzi, G. , & Carra, S. (2018). SMYD3 promotes the epithelial–mesenchymal transition in breast cancer. Nucleic Acids Research, 47, 1278–1293. 10.1093/nar/gky1221 [DOI] [PMC free article] [PubMed] [Google Scholar]
- Ghaffari‐Tabrizi, N. , Bauer, B. , Villunger, A. , Baier‐Bitterlich, G. , Altman, A. , Utermann, G. , & Überall, F. (1999). Protein kinase Cθ, a selective upstream regulator of JNK/SAPK and IL‐2 promoter activation in Jurkat T cells. European Journal of Immunology, 29(1), 132–142. [DOI] [PubMed] [Google Scholar]
- Gutschner, T. , Hämmerle, M. , & Diederichs, S. (2013). MALAT1—a paradigm for long noncoding RNA function in cancer. Journal of Molecular Medicine, 91(7), 791–801. 10.1007/s00109-013-1028-y [DOI] [PubMed] [Google Scholar]
- Huarte, M. (2015). The emerging role of lncRNAs in cancer. Nature Medicine, 21(11), 1253–1261. 10.1038/nm.3981 [DOI] [PubMed] [Google Scholar]
- Hussaini, I. M. , Karns, L. R. , Vinton, G. , Carpenter, J. E. , Redpath, G. T. , Sando, J. J. , & VandenBerg, S. R. (2000). Phorbol 12‐myristate 13‐acetate induces protein kinase Cη‐specific proliferative response in astrocytic tumor cells. Journal of Biological Chemistry, 275(29), 22348–22354. 10.1074/jbc.M003203200 [DOI] [PubMed] [Google Scholar]
- Ji, P. , Diederichs, S. , Wang, W. , Böing, S. , Metzger, R. , Schneider, P. M. , & Tidow, N. (2003). MALAT‐1, a novel noncoding RNA, and thymosin β4 predict metastasis and survival in early‐stage non‐small cell lung cancer. Oncogene, 22(39), 8031–8041. 10.1038/sj.onc.1206928 [DOI] [PubMed] [Google Scholar]
- Khan, A. Q. , Kuttikrishnan, S. , Siveen, K. S. , Prabhu, K. S. , Shanmugakonar, M. , Al‐Naemi, H. A. , & Haris, M. (2019). RAS‐mediated oncogenic signaling pathways in human malignancies. Seminars in Cancer Biology, 54, 1–13. 10.1016/j.semcancer.2018.03.001 [DOI] [PubMed] [Google Scholar]
- Kokkinos, M. I. , Wafai, R. , Wong, M. K. , Newgreen, D. F. , Thompson, E. W. , & Waltham, M. (2007). Vimentin and epithelial–mesenchymal transition in human breast cancer—observations in vitro and in vivo. Cells Tissues Organs, 185(1‐3), 191–203. 10.1159/000101320 [DOI] [PubMed] [Google Scholar]
- Li, F. , Tang, C. , Jin, D. , Guan, L. , Wu, Y. , Liu, X. , & Wu, X. (2017). CUEDC2 suppresses glioma tumorigenicity by inhibiting the activation of STAT3 and NF‐κB signaling pathway. International Journal of Oncology, 51(1), 115–127. 10.3892/ijo.2017.4009 [DOI] [PMC free article] [PubMed] [Google Scholar]
- Lin, L. , Zheng, Y. , Tu, Y. , Wang, Z. , Liu, H. , Lu, X. , & Xu, L. (2015). MicroRNA‐144 suppresses tumorigenesis and tumor progression of astrocytoma by targeting EZH2. Human Pathology, 46(7), 971–980. 10.1016/j.humpath.2015.01.023 [DOI] [PubMed] [Google Scholar]
- Lopez‐Bergami, P. , Huang, C. , Goydos, J. S. , Yip, D. , Bar‐Eli, M. , Herlyn, M. , & Smalley, K. S. M. (2007). Rewired ERK‐JNK signaling pathways in melanoma. Cancer Cell, 11(5), 447–460. 10.1016/j.ccr.2007.03.009. [DOI] [PMC free article] [PubMed] [Google Scholar]
- Macias, M. J. , Martin‐Malpartida, P. , & Massagué, J. (2015). Structural determinants of Smad function in TGF‐β signaling. Trends in Biochemical Sciences, 40(6), 296–308. 10.1016/j.tibs.2015.03.012 [DOI] [PMC free article] [PubMed] [Google Scholar]
- Mandil, R. , Ashkenazi, E. , Blass, M. , Kronfeld, I. , Kazimirsky, G. , Rosenthal, G. , & Umansky, F. (2001). Protein kinase C α and protein kinase C δ play opposite roles in the proliferation and apoptosis of glioma cells. Cancer Research, 61(11), 4612–4619. [PubMed] [Google Scholar]
- Matsui, M. , & Corey, D. R. (2017). Non‐coding RNAs as drug targets. Nature reviews. Drug discovery, 16(3), 167–179. 10.1038/nrd.2016.117 [DOI] [PMC free article] [PubMed] [Google Scholar]
- McHugh, C. A. , Chen, C. K. , Chow, A. , Surka, C. F. , Tran, C. , McDonel, P. , & Pandya‐Jones, A. (2015). The Xist lncRNA interacts directly with SHARP to silence transcription through HDAC3. Nature, 521(7551), 232–236. 10.1038/nature14443 [DOI] [PMC free article] [PubMed] [Google Scholar]
- Mendell, J. T. (2016). Targeting a long noncoding RNA in breast cancer. New England Journal of Medicine, 374(23), 2287–2289. 10.1056/NEJMcibr1603785 [DOI] [PubMed] [Google Scholar]
- Mima, K. , Hayashi, H. , Kuroki, H. , Nakagawa, S. , Okabe, H. , Chikamoto, A. , & Watanabe, M. (2013). Epithelial‐mesenchymal transition expression profiles as a prognostic factor for disease‐free survival in hepatocellular carcinoma: Clinical significance of transforming growth factor‐β signaling. Oncology Letters, 5(1), 149–154. 10.3892/ol.2012.954 [DOI] [PMC free article] [PubMed] [Google Scholar]
- Newton, A. C. , & Brognard, J. (2017). Reversing the paradigm: Protein kinase C as a tumor suppressor. Trends in Pharmacological Sciences, 38(5), 438–447. 10.1016/j.tips.2017.02.002 [DOI] [PMC free article] [PubMed] [Google Scholar]
- Nieto, M. A. , Huang, R. Y. J. , Jackson, R. A. , & Thiery, J. P. (2016). Emt: 2016. Cell, 166(1), 21–45. 10.1016/j.cell.2016.06.028 [DOI] [PubMed] [Google Scholar]
- Nishizuka, Y. (1988). The molecular heterogeneity of protein kinase C and its implications for cellular regulation. Nature, 334(6184), 661–665. 10.1038/334661a0 [DOI] [PubMed] [Google Scholar]
- Pal, D. , & Basu, A. (2017). Protein kinase C‐eta regulates Mcl‐1 level via ERK1. Cellular Signalling, 40, 166–171. 10.1016/j.cellsig.2017.09.012 [DOI] [PubMed] [Google Scholar]
- de Planell‐Saguer, M. , Rodicio, M. C. , & Mourelatos, Z. (2010). Rapid in situ codetection of noncoding RNAs and proteins in cells and formalin‐fixed paraffin‐embedded tissue sections without protease treatment. Nature Protocols, 5(6), 1061–1073. 10.1038/nprot.2010.62 [DOI] [PubMed] [Google Scholar]
- Rosenberg, S. , Simeonova, I. , Bielle, F. , Verreault, M. , Bance, B. , Le Roux, I. , & Daniau, M. (2018). A recurrent point mutation in PRKCA is a hallmark of chordoid gliomas. Nature Communications, 9(1), 2371 10.1038/s41467-018-04622-w [DOI] [PMC free article] [PubMed] [Google Scholar]
- Schmitt, A. M. , & Chang, H. Y. (2013). Long RNAs wire up cancer growth. Nature, 500(7464), 536–537. 10.1038/nature12548 [DOI] [PMC free article] [PubMed] [Google Scholar]
- Shi, Y. , Wu, H. , Zhang, M. , Ding, L. , Meng, F. , & Fan, X. (2013). Expression of the epithelial–mesenchymal transition‐related proteins and their clinical significance in lung adenocarcinoma. Diagnostic Pathology, 8, 772 10.1186/1746-1596-8-89 [DOI] [PMC free article] [PubMed] [Google Scholar]
- Song, B. , Park, S. H. , Zhao, J. C. , Fong, K. , Li, S. , Lee, Y. , & Yang, Y. A. (2019). Targeting FOXA1‐mediated repression of TGF‐β signaling suppresses castration‐resistant prostate cancer progression. Journal of Clinical Investigation, 129(2), 569–582. 10.1172/JCI122367 [DOI] [PMC free article] [PubMed] [Google Scholar]
- Stupp, R. , Mason, W. P. , van den Bent, M. J. , Weller, M. , Fisher, B. , & Taphoorn, M. J. B. , National Cancer Institute of Canada Clinical Trials, G. (2005). Radiotherapy plus concomitant and adjuvant temozolomide for glioblastoma. New England Journal of Medicine, 352(10), 987–996. 10.1056/NEJMoa043330 [DOI] [PubMed] [Google Scholar]
- Sun, S. , Wang, Y. , Wu, Y. , Gao, Y. , Li, Q. , Abdulrahman, A. , & Liu, X. F. (2018). Identification of COL1A1 as an invasionrelated gene in malignant astrocytoma. International Journal of Oncology, 53(6), 2542–2554. 10.3892/ijo.2018.4568 [DOI] [PMC free article] [PubMed] [Google Scholar]
- Tang, C. X. , Gu, Y. X. , Liu, X. F. , Tong, S. Y. , Ayanlaja, A. , Gao, Y. , & Ji, G. Q. (2018). Cross‐link regulation of precursor N‐cadherin and FGFR1 by GDNF increases U251MG cell viability. Oncology Reports, 40(1), 443–453. 10.3892/or.2018.6405 [DOI] [PubMed] [Google Scholar]
- Thiery, J. P. (2002). Epithelial‐mesenchymal transitions in tumour progression. Nature Reviews Cancer, 2(6), 442–454. 10.1038/nrc822 [DOI] [PubMed] [Google Scholar]
- Wang, Q. , Zhang, J. , Liu, Y. , Zhang, W. , Zhou, J. , Duan, R. , & Pu, P. (2016). A novel cell cycle‐associated lncRNA, HOXA11‐AS, is transcribed from the 5‐prime end of the HOXA transcript and is a biomarker of progression in glioma. Cancer Letters, 373(2), 251–259. 10.1016/j.canlet.2016.01.039 [DOI] [PubMed] [Google Scholar]
- Ward, A. F. , Braun, B. S. , & Shannon, K. M. (2012). Targeting oncogenic ras signaling in hematologic malignancies. Blood, 120(17), 3397–3406. 10.1182/blood-2012-05-378596 [DOI] [PMC free article] [PubMed] [Google Scholar]
- Weller, M. , Pfister, S. M. , Wick, W. , Hegi, M. E. , Reifenberger, G. , & Stupp, R. (2013). Molecular neuro‐oncology in clinical practice: A new horizon. The Lancet Oncology, 14(9), e370–e379. 10.1016/S1470-2045(13)70168-2 [DOI] [PubMed] [Google Scholar]
Associated Data
This section collects any data citations, data availability statements, or supplementary materials included in this article.
Supplementary Materials
Figure S1. NCBI BLAST results for the 4623 base pair lncRNA and target gene Smad2
Figure S2. GF109203X inhibits the migration and invasion of glioma cells directly. (A, B) U251 cells were treated with either 0.1% DMSO or GF109203X (a specific PKCα inhibitor), wound‐healing and transwell assay were detected respectively. (C, D) U87 cells were treated with GF109203X, migration and invasion were evaluated by the same methods. (E) The percent of gap filled was calculated based on wound‐healing results and statistical analysis was performed (t‐test, *P < 0.05). (F) Penetrating cells were counted after transwell experiment and statistical analysis was performed (t‐test, *P < 0.05)
Table S1. Primer sequences used in real‐time PCR for detecting lncRNA expression
Table S2. Thirty‐eight selected lncRNAs used as candidate biomarkers
Table S3. Expression levels of 25 lncRNAs from U251 glioma cells compared with normal human astrocytes based on RT‐PCR
Data Availability Statement
The data that support the findings of this study are openly available in repository name, e.g., “figshare” at https://doi.org/[doi], reference number [reference number]. The datasets used and/or analyzed during the current study are available from the corresponding author on reasonable request. The URL of public data sources: https://www.oncomine.org


