

Abstract
Nonindigenous species pose a major threat for coastal and estuarine ecosystems. Risk management requires genetic information to establish appropriate management units and infer introduction and dispersal routes. We investigated one of the most successful marine invaders, the ctenophore Mnemiopsis leidyi, and used genotyping‐by‐sequencing (GBS) to explore the spatial population structure in its nonindigenous range in the North Sea. We analyzed 140 specimens collected in different environments, including coastal and estuarine areas, and ports along the coast. Single nucleotide polymorphisms (SNPs) were called in approximately 40 k GBS loci. Population structure based on the neutral SNP panel was significant (F ST .02; p < .01), and a distinct genetic cluster was identified in a port along the Belgian coast (Ostend port; pairwise F ST .02–.04; p < .01). Remarkably, no population structure was detected between geographically distant regions in the North Sea (the Southern part of the North Sea vs. the Kattegat/Skagerrak region), which indicates substantial gene flow at this geographical scale and recent population expansion of nonindigenous M. leidyi. Additionally, seven specimens collected at one location in the indigenous range (Chesapeake Bay, USA) were highly differentiated from the North Sea populations (pairwise F ST .36–.39; p < .01). This study demonstrates the utility of GBS to investigate fine‐scale population structure of gelatinous zooplankton species and shows high population connectivity among nonindigenous populations of this recently introduced species in the North Sea.
OPEN RESEARCH BADGES

This article has earned an Open Data Badge for making publicly available the digitally‐shareable data necessary to reproduce the reported results. The data is available at: The DNA sequences generated for this study are deposited in the NCBI sequence read archive under SRA accession numbers SRR6950721–SRR6950884, and will be made publically available upon publication of this manuscript.
Keywords: genotyping‐by‐sequencing, invasion biology, Mnemiopsis leidyi, population differentiation, population genomics, Single nucleotide polymorphisms
The population genomic structure of the gelatinous zooplankton species Mnemiopsis leidyi in its nonindigenous range in the North Sea was investigated. Two genetically distinct clusters were identified.
1. INTRODUCTION
Invasive species are widely recognized for their negative effects on biodiversity and ecosystem functioning (Carlton & Geller, 1993; Simberloff et al., 2013). During the last decades, globalization of maritime traffic has increased invasion rates of marine organisms by facilitating dispersal over large geographical distances (Hulme, 2009; Ricciardi & MacIsaac, 2000; Ruiz, Fofonoff, Carlton, Wonham, & Hines, 2000). Although only a fraction of the introduced species is able to thrive in a new environment, establishment of permanent populations can have dramatic effects on the local community (Katsanevakis et al., 2014; Molnar, Gamboa, Revenga, & Spalding, 2008; Ojaveer et al., 2015). Therefore, management of nonindigenous species should be a priority for marine conservation. Effective control measures and impact prediction rely on an accurate understanding of dispersal and population connectivity, which can be investigated with genetic approaches (Allendorf, Hohenlohe, & Luikart, 2010; Chown et al., 2015; Sherman et al., 2016; Viard, David, & Darling, 2016). Moreover, genetic reconstruction of invasion histories provides the opportunity to study the eco‐evolutionary mechanisms underlying long‐distance dispersal, range expansion, and local adaptation (Cristescu, 2015; Sax et al., 2007).
Marine invasions often affect valuable coastal and estuarine ecosystems (Grosholz, 2002). Marine species typically show limited population differentiation, and establishing appropriate management units is challenging. Estimating population connectivity is complicated by many factors specific to the marine environment (Palumbi, 2003). Obvious physical barriers to migration are seemingly absent, and habitat connectivity and high mobility promote long‐distance dispersal (Allendorf et al., 2010; Cowen & Sponaugle, 2009). Distribution ranges and population densities are shaped by seascape features such as ocean currents and physicochemical fluctuations and temperature (Hohenlohe, 2004; Johansson et al., 2015; O'Connor et al., 2007; Selkoe et al., 2016), and demographic processes such as local recruitment (Jones, Planes, & Thorrold, 2005). Moreover, the dispersal capabilities of pelagic organisms can be affected by other factors such as antropogenic pollution (Puritz & Toonen, 2011). Marine invertebrate species typically have a high reproductive output, and large population sizes prevent the accumulation of neutral divergence by genetic drift (Deagle, Faux, Kawaguchi, Meyer, & Jarman, 2015). Traditional genetic methods may lack the resolution to identify genetically differentiated populations. In contrast, genotyping‐by‐sequencing (GBS) allows identification of SNPs at thousands of loci to investigate fine‐scale population structure and accurate population assignment in the context of weak genetic structure (Andrews, Good, Miller, Luikart, & Hohenlohe, 2016; Davey et al., 2011; Narum, Buerkle, Davey, Miller, & Hohenlohe, 2013).
One of the most successful marine invaders is the ctenophore Mnemiopsis leidyi. This species is native to the Atlantic coasts of North and South America but is nowadays widespread across European seas. Introduction of M. leidyi in coastal ecosystems can induce community trophic cascades (Tiselius & Møller, 2017), and outbreaks have coincided with alarming changes in the pelagic food web (Oguz, Fach, & Salihoglu, 2008; Shiganova & Bulgakova, 2000). The invasive success of M. leidyi is attributed to its broad tolerance for environmental variability (Fuentes et al., 2010; Purcell, Shiganova, Decker, & Houde, 2001), flexible planktivorous diet (Costello, Bayha, Mianzan, Shiganova, & Purcell, 2012; Costello, Sullivan, Gifford, Van Keuren, & Sullivan, 2006; Rapoza, Novak, & Costello, 2005), and high fertility (Costello et al., 2012; Jaspers, Møller, & Kiørboe, 2015). Individuals are simultaneous hermaphrodite and capable of self‐fertilization. Maturity can be reached in a few weeks, after which thousands of eggs per day can be released (Jaspers, Costello, & Colin, 2014). Mnemiopsis leidyi is pelagic through its entire life cycle (Rapoza et al., 2005), which possibly promotes long‐distance dispersal via ocean currents. Molecular studies have identified distinct genetic clusters in Southern Europe (Black, Caspian and Mediterranean Sea) and Northwestern Europe (Baltic and North Sea; Bayha et al., 2015; Ghabooli et al., 2011; Reusch, Bolte, Sparwel, Moss, & Javidpour, 2010). These originate from distinct introductions that can be linked to the climatic conditions in the indigenous range. The Southern European cluster originates from a limited number of founders from the Gulf of Mexico, and subsequent outbreaks along the coast suggest a stepping‐stone scenario of colonization (Bolte et al., 2013; Fuentes et al., 2010; Ghabooli et al., 2013). The Northern European cluster originates from the Atlantic coast of North America. Possibly large numbers of ctenophores have been introduced by recurrent ballast water discharges, since no founder effects were detected (Bayha et al., 2015; Ghabooli et al., 2011; Reusch et al., 2010). However, these studies were based on a limited number of genetic markers and provided limited geographical resolution for risk assessment of contemporary outbreaks in Northwestern Europe. In the indigenous range, coastal embayments and estuaries support overwintering populations that populate adjacent coastal areas (Costello et al., 2006). Similar source–sink dynamics are expected in the nonindigenous range in Northwestern Europe (Collingridge, Molen, & Pitois, 2014; Schaber et al., 2011; Vansteenbrugge, Ampe, Troch, Vincx, & Hostens, 2015).
In the current study, we used high‐density SNP markers to investigate the spatial population structure of M. leidyi on three geographical scales. First, we estimated fine‐scale population differentiation and connectivity within the Southern part of the North Sea. Sampling locations covered three potential source populations (the ports of Dunkirk and Ostend, and the estuary of the Scheldt River) and potential sink populations along the Belgian coastal zone. We investigated the presence of distinct source populations and estimated their contribution to the coastal population. Based on source–sink dynamics, we expected to find higher genetic diversity in the three putative source populations compared with the population(s) in the North Sea. Second, we compared geographically distant regions; the Southern part of the North Sea and the Kattegat/Skagerrak region (DK) in the north. Third, sampling covered one location in the indigenous species range (Chesapeake Bay, USA). We expected low levels of population structure among the regions in the Southern part of the North Sea, due to local, annual migration, and increasing genetic differences between individuals from the Southern part of the North Sea, the Baltic Sea, and Chesapeake Bay due to isolation by distance. Our main aims were to develop a GBS procedure for M. leidyi with a focus on marker density and data completeness, and to describe spatial variation in SNP frequencies after the introduction and secondary spread in the North Sea. Specific goals were to (a) identify outlier SNPs putatively under natural selection; (b) determine the population structure based on all SNPs and neutral SNPs separately; (c) quantify genomewide diversity and structure among environmentally distinct regions in the Southern part of the North Sea and the geographically distant regions of Kattegat/Skagerrak (nonindigenous) and Chesapeake Bay (indigenous); and (d) identify recent migrants between regions by population assignment.
2. MATERIAL AND METHODS
2.1. Sample collection
Mnemiopsis leidyi specimens were collected from 23 sampling locations (Figure 1). Several stations along the Belgian coast, in the port of Ostend and in the Scheldt estuary were sampled using plankton net trawling (both CalCOFI net and hyperbenthic sledge towed at three knots, mesh size 1,000 µm), scuba diving, or dip‐net sampling from June until November 2014 (Table 1). Specimens of the port of Ostend were collected in two subsequent years (2014 and 2015; Table 1). Additionally, specimens were collected by plankton net trawling: in the port of Dunkirk (FR) in 2012 and 2013, the Kattegat/Skagerrak region (DK) in 2014, and Chesapeake Bay (USA) in 2013. Specimens were preserved individually in 99% ethanol.
Figure 1.
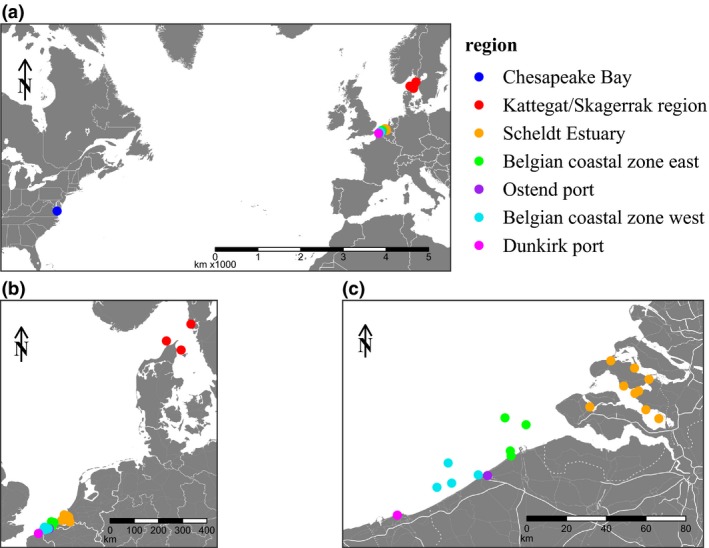
Geographical distribution of sampling locations covers both geographically distant and environmentally distinct regions. (a) Transatlantic range, including one sampling location in M. leidyi's indigenous range. (b) North Sea range, including three sampling location in the Kattegat/Skagerrak region. (c) Southern part of the North Sea, including the Belgian coast and potential source populations in the ports of Dunkirk and Ostend, and the Scheldt Estuary (Table 1)
Table 1.
Overview and details of the sampling locations, dates, and geographic regions
| Region | Individual samples (n) | Location | Latitude | Longitude | Sampling date and individual samples (n) | ||||||||||||
|---|---|---|---|---|---|---|---|---|---|---|---|---|---|---|---|---|---|
| 2012 | 2013 | 2014 | 2015 | ||||||||||||||
| 8 | 9 | 10 | 8 | 9 | 6 | 7 | 8 | 9 | 10 | 11 | 4 | 5 | |||||
| Chesapeake Bay (*) | 6 | Chesapeake Bay | 37.5704 | −76.1718 | 7 | ||||||||||||
| Kattegat/Skagerrak | 16 | Gullmar Fjord | 58.2490 | 11.4000 | 4 | ||||||||||||
| Kattegat | 57.4256 | 10.8143 | 4 | ||||||||||||||
| Skagerrak | 57.7163 | 9.9361 | 8 | ||||||||||||||
| Scheldt estuary | 27 | OS5 | 51.5220 | 4.0826 | 2 | ||||||||||||
| OS6 | 51.4821 | 4.1762 | 3 | ||||||||||||||
| OS9 | 51.6057 | 4.0310 | 1 | ||||||||||||||
| Eastern Scheldt 1 | 51.6277 | 3.9240 | 2 | ||||||||||||||
| Grevelingen 1 | 51.7402 | 3.8308 | 4 | 5 | |||||||||||||
| Grevelingen 2 | 51.7078 | 4.0013 | 1 | 1 | |||||||||||||
| Mastgat 1 | 51.6577 | 4.1052 | 2 | ||||||||||||||
| Mastgat 2 | 51.5953 | 4.0041 | 2 | ||||||||||||||
| Veerse Meer 1 | 51.5347 | 3.6801 | 4 | ||||||||||||||
| Belgian coastal zone east | 44 | Diep1 | 51.4857 | 3.0700 | 2 | 5 | |||||||||||
| Knok1 | 51.4548 | 3.2218 | 4 | 2 | |||||||||||||
| Zee1 | 51.3375 | 3.1086 | 4 | 6 | 16 | ||||||||||||
| Blankenberge | 51.3150 | 3.1140 | 5 | ||||||||||||||
| Ostend port | 12 | Ostend | 51.2269 | 2.9449 | 2 | 2 | 4 | 4 | |||||||||
| Belgian coastal zone west | 28 | Oost1 | 51.2299 | 2.8777 | 2 | 6 | |||||||||||
| Kwint | 51.2833 | 2.6617 | 9 | ||||||||||||||
| West1 | 51.1929 | 2.6869 | 5 | ||||||||||||||
| West2 | 51.1740 | 2.5810 | 6 | ||||||||||||||
| Dunkirk port | 6 | Dunkirk | 51.0484 | 2.2962 | 3 | 3 | |||||||||||
| Total | 140 | ||||||||||||||||
The region indicated with (*) is located in the indigenous range of M. leidyi.
2.2. Library preparation
Tissue aliquots of ca. 5 mg were dried for 15 min at 37°C to ensure ethanol evaporation. Dried tissue samples were dissolved in 50 µl water. The Bio‐Nobile QuickPick gDNA purification kit was used for DNA isolation of samples from 2014 onwards and the InViTek DNA isolation kit for samples from 2013 and older. DNA integrity was checked by gel electrophoresis, and the concentration was measured with QuantiFluor intercalating dye on a Promega Quantus fluorometer (Promega). All samples were genotyped individually with a single‐enzyme GBS protocol modified from Elshire et al. (2011). The protocol was optimized for M. leidyi during a pilot experiment. We compared the performance of six restriction enzymes with different recognition sites: MseI (T|TAA), MspI (C|CGG), ApeKI (G|CWGC), EcoRI (G|AATTC), EcoT22I (ATGCA|T), and PstI (CTGCA|G). Ten libraries were prepared for each enzyme using a set of ten specimens. The performance of the enzymes was evaluated by gel electrophoresis of the restriction digest and a pilot sequencing run. MspI was selected for genotyping all other samples (see Section 3). In short, 100 ng of genomic DNA was digested, and adapters were ligated with T4 DNA ligase. A barcode adapter—common adapter system was used with in‐line barcode sequences. Adapter sequences were generated with the tool from Deena Bioinformatics (http://www.deenabio.com/services/gbs-adapters). Barcode sequences were 4 to 9 bp, differed from each other by at least 3 substitutions and contain homopolymers of maximum 2 bp. Restriction digests and adapter ligations were performed according to the enzyme manufacturer's recommendations (New England Biolabs). Individual libraries were purified with 1.6× MagNa magnetic beads (Rohland & Reich, 2012) and eluted in 50 µl 0.1× TE buffer. Short fragments were amplified by PCR with 2 µl ligate with Taq 2× Master Mix (New England Biolabs), using a denaturation step of 5 min at 72°C + 30 s at 98°C followed by 20 cycles of 10 s at 98°C + 30 s at 65°C + 30 s at 72°C. PCR products were purified with 1.6× MagNa magnetic beads and eluted in 30 µl 0.1× TE buffer. Fragment size distributions of individual libraries were evaluated with a Qiagen QIAxcel system (Qiagen). The libraries were normalized and pooled for sequencing. The libraries of the pilot experiment were paired‐end sequenced for 100 bp on an Illumina HiSeq2000 instrument by BGI. Because of the sequencing of short fragment sizes, only the forward reads were used for the data analysis. For the second sequencing run, libraries were prepared for 175 specimens, and single‐end sequenced for 100 bp on an Illumina HiSeq 2500 instrument by the Genomic Services Lab at HudsonAlpha, using three sequencing lanes.
2.3. Read filtering and mapping
GNU parallel (Tange, 2011) was used for parallelization of all following steps. Reads were demultiplexed with GBSX 1.1.5 (Herten, Hestand, Vermeesch, & Houdt, 2015), allowing 1 mismatch in the barcode. Common adapter sequences, restriction site remnants, and intact restriction sites were trimmed with cutadapt 1.9.1 (Martin, 2011). Reads containing ambiguous bases and reads with an average base quality below 30 were discarded with prinseq‐lite 0.20.4 (Schmieder & Edwards, 2011). Sequence quality was checked with FastQC 11.7 (Andrews, 2010) and MultiQC 1.5 (Ewels, Magnusson, Lundin, & Käller, 2016).
Quality‐filtered reads were aligned to the reference genome (Ryan et al., 2013) with the BWA‐mem algorithm in BWA 0.7.17 (Li & Durbin, 2009). Mapped reads were filtered on minimum mapping quality 20, and supplementary reads were removed with SAMtools 1.8. (Li et al., 2009). Further analysis and filtering of the alignments were performed with custom AWK and R (3.4.3) scripts (R Core Team, 2017). To quantify the number of distinct GBS loci, we delineated stacks of reads with identical mapping positions. Stacks with read depth below six were flagged as missing data, and stacks with partially overlapping positions were grouped. Genomic coordinates of these features were stored in GFF format. We counted the number of loci per library as a function of the number of reads mapped per library (Figure S1a). Out of the 10 libraries created per enzyme, we selected the five libraries with the highest read count for that enzyme. To evaluate the completeness of datasets generated with different restriction enzymes, we analyzed for each enzyme the number of loci shared between samples using the five libraries with the highest read count (Figure S1b). We excluded samples with less than 40 k loci for genotyping of the sample collection (Figure S1c).
2.4. Genotype calling
Genotypes were called with GATK 3.7 using the HaplotypeCaller (McKenna et al., 2010). Multi‐allelic SNPs and indels were removed with VCFtools 0.1.14 (Danecek et al., 2011). The VCF file was annotated with the coordinates of GBS loci and predicted genes and exons (Ryan et al., 2013), using BEDtools 2.25.0 (Quinlan & Hall, 2010). With a custom python script, we converted the annotated VCF file to a simpler table format for subsequent analyses in R. SNP positions with less than 80% of the individuals covered after the GATK analysis were discarded. We evaluated Hardy–Weinberg Equilibrium (HWE) with the exact test implemented in Plink 1.9 (Chang et al., 2015) and removed SNPs with an excessive proportion of heterozygous genotype calls across all samples (p‐value HWE < 0.01 and H o > H e; Figure S2). Deviating SNPs with low H o may be fixed variants and were kept.
A substantial portion of our SNP dataset consisted of low‐frequency alleles. These are usually discarded for population analysis, because they are deemed uninformative and may contain errors (Roesti, Salzburger, & Berner, 2012). However, careful consideration of MAF filtering was recently recommended (Linck & Battey, 2019). Therefore, we compared the distribution of alleles over the geographical regions for MAF thresholds of minimum 1 and 5% (results not shown). Low‐frequency alleles in our datasets (between 1% and 5%) were unevenly distributed over the geographical regions. Therefore, these alleles represented relevant genetic diversity and we applied a MAF threshold of minimum 1% (Figure S3).
2.5. Outlier detection
To find SNPs that might be under natural selection, or linked to such loci, we used outlier detection. Individual outlier detection methods differ in their ability to identify outliers, and a combination of methods is recommended (Narum & Hess, 2011; Villemereuil, Frichot, Bazin, François, & Gaggiotti, 2014). We performed the PCA‐based outlier test implemented in PCAdapt 4.0.1 (Luu, Bazin, & Blum, 2017) and the F ST outlier test implemented in OutFLANK 0.1 (Whitlock & Lotterhos, 2015). PCAdapt correlates the genotypes of SNPs with principal components (PC) and does not require population priors. Clustering of the zero‐inflated genotype data was reduced by applying the SNP thinning algorithm, with default window size and R 2 threshold. The test statistic is based on regression of the scaled genotypes and k PCs that represent relevant population structure. The distribution of this test statistic is expected to follow a chi‐square distribution with k degrees of freedom when there are no outliers present. The genomic inflation factor (GIF) is the ratio of the observed and expected median of the test statistic, and can be used for rescaling inflated distributions. The F ST statistic of the analysis with OutFLANK was based on the geographical regions as prior populations (Table 1). The tails of the F ST distribution can be trimmed before parameterization. For both methods, we corrected for multiple testing with a threshold of 0.10 for false discovery rate (FDR; Benjamini & Hochberg, 1995). The q‐values for the PCAdapt analysis were calculated using the qvalue package 2.8.0 (Dabney, Storey, & Warnes, 2010). The neutral panel consisted of SNPs that were flagged as nonoutlier by both methods. To examine the distribution of outliers within the nonindigenous range in more detail, we repeated the analysis for a dataset excluding specimens from Chesapeake Bay.
2.6. Population genetic analysis
The mean allelic richness and mean expected and observed heterozygosity (A r, H e and H o) were calculated for the geographical regions (Table 1) using Hierfstat 0.04‐22 (Goudet, 2005). Population structure was analyzed using the panel of all SNPs and the panel of neutral SNPs, both of datasets including and excluding Chesapeake Bay. Analysis of molecular variance (AMOVA) based on Nei's genetic distance (Nei, 1972) was performed with pegas 0.10 (Paradis, 2010) and StAMPP 1.5.1 (Pembleton, Cogan, & Forster, 2013), using 100 permutations. Pairwise genetic differentiation between the regions was estimated with the unbiased F ST estimator θ (Weir & Cockerham, 1984), and pairwise 95% confidence intervals were calculated with StAMPP using 100 bootstraps. Negative F ST values were set to zero. The population structure and population assignment of individuals were further described with discriminant analysis of principle components (DAPC) implemented in Adegenet 2.1.0 (Jombart, 2008), using 20 PCs.
3. RESULTS
3.1. Optimization of GBS genotyping in M. leidyi
Of the six restriction enzymes tested, EcoT22I and EcoRI were excluded because gel electrophoresis showed insufficient DNA fragmentation. MseI was excluded because the sequence reads had very low GC content (approximately 35% on average). The read depth distribution of the three remaining enzymes was evaluated either using saturation curves showing the number of loci per sample as a function of the number of reads mapped per library or, alternatively, by analyzing the number of loci shared between libraries (Figure S1a). PstI yielded less than approximately 5 k GBS loci per library, independent of the number of reads used for mapping, while for ApeKI and MspI increasingly more loci were detected above the read depth threshold (6 reads) with increasing total number of reads mapped. These curves show that about 30 k loci are expected if at least 600 k reads per library are mapped, but that mapping higher numbers of reads may be required to reach saturation in the number of independent GBS loci for ApeKI or MspI. The number of loci shared between samples was determined per enzyme (Figure S1b). These curves indicated that MspI was more efficient to sequence common loci compared with ApeKI. Therefore, we decided to use MspI for GBS profiling of the sample collection.
3.2. Distribution of read data and SNPs
We obtained 140 libraries with more than 40 k GBS loci (Figure S1c) and discarded 35 libraries with less than 40 k GBS loci. The 40 k loci were detected with sufficient read depth (6 reads) in at least 80% of the 140 libraries and cover ca. 3.4 Mbp of the 156 Mbp reference genome sequence (2.2%). Approximately 162 k biallelic SNPs were called with GATK. We discarded approximately 5 k SNPs with excessive read depth (data not shown), approximately 1 k SNPs with excessive heterozygous genotype calls and significantly deviating from HWE (Figure S2), and around 82 k SNPs with a MAF below 1% (Figure S3). Of the remaining 74 k SNPs, 73% were located within the genes and 34% within the exons predicted by Ryan et al. (2013). No mitochondrial SNPs were detected.
3.3. Identification of outlier SNPs
The SNP thinning algorithm of PCAdapt reduced the SNP dataset including Chesapeake Bay from 74 to 52 k SNPs, and two relevant PCs were retained based on the clustering of samples (Figure S4a,b). The proportion of the variance captured by the first component (.17) was notably higher than the proportion captured by the second component (.02). The distribution of the test statistic was inflated (GIF 1.61); however, the fit to the expected chi‐square distribution was better without rescaling (Figure 2e). After correction for multiple testing, 14 k SNPs were identified as outliers (Figure 2i). OutFLANK was unable to identify outliers when using the default settings for trimming loci, because all loci with F ST above the upper trim point were marked as outliers. To resolve this issue, we incrementally increased the fraction of highest F ST values that was removed before parametrization of the F ST distribution. When 30% of the highest F ST values was removed (Figure 2a,c), 14 k outlier SNPs were identified, of which 12 k in common with PCAdapt (Figure 2i). Approximately 35 k SNPs (68%) were not flagged as outlier by both methods and were used as neutral SNP panel. The dataset of 69 k SNPs identified on specimens excluding Chesapeake Bay area was thinned to 45 k SNPs. PCAdapt recovered a single relevant PC (Figure S4c,d), and the GIF was 1.36. Again, no rescaling was applied (Figure 2f,h), and 3,236 outliers were identified (Figure 2j). OutFLANK was executed with default settings for trimming of loci, but very few additional outliers to PCAdapt were recovered (Figure 2b,d,j). For this dataset, the neutral SNP panel consisted of 42 k SNP (i.e., 93% of the SNP panel with all SNPs). For both datasets, no SNPs were flagged for having significantly low F ST values. The proportions of SNPs located in genes and exons were similar for the panels of outlier and neutral SNPs (data not shown).
Figure 2.
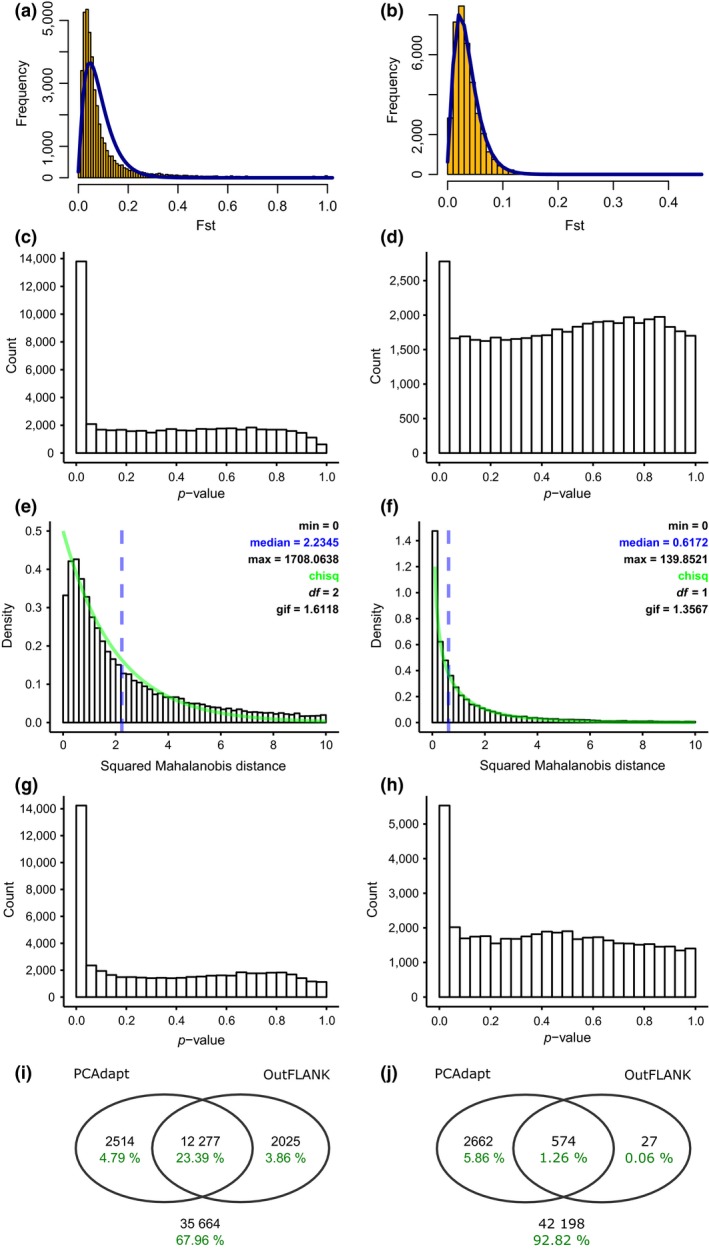
SNP outlier analysis with OutFLANK and PCAdapt. (a, b) The F ST distributions without sample size correction generated by OutFLANK for, respectively, the dataset including all seven regions and the dataset without Chesapeake Bay, and (c, d) corresponding p‐values. (e, f) The distributions of the squared Mahalanobis distance generated by PCAdapt for both datasets, and (g, h) corresponding p‐values. (i, j) Venn diagrams show the overlap of outlier SNPs between OutFLANK and PCAdapt for both datasets, in SNP counts (black) and proportion of the SNP panels with all SNPs. The values below the Venn diagrams show the number and proportion of SNPs that were not identified as outlier by both methods (i.e., the neutral SNP panels)
3.4. Genetic diversity, population structure, and population assignment of individuals
Mean H e and A r showed similar patterns among geographical regions (Figure 3). The highest diversity was measured for Chesapeake Bay, followed by the port of Ostend. Mean H o was generally lower than mean H e, except for the port of Dunkirk, which also had the highest mean H o of all nonindigenous regions. AMOVA indicated highly significant population structure between the seven regions (p < .001) for both panels (all SNPs or only neutral SNPs) and both the datasets including and excluding Chesapeake Bay (Table 2). Pairwise comparisons revealed significant differentiation of two regions, Chesapeake Bay and Ostend port, from all other regions (Table 3). Pairwise F ST values between the indigenous and all nonindigenous regions ranged between .36 and .39 for all SNPs, and between .11 and .12 for neutral SNPs. Pairwise differentiation between Ostend port and all other nonindigenous regions ranged between .03 and .04 for all SNPs, and between .01 and .02 for neutral SNPs. Similar results were obtained for the dataset excluding Chesapeake Bay (result not shown). The results of DAPC based on all SNPs (Figure 4) or based on the neutral SNPs alone (Figure S5) confirm the presence of three clusters: Chesapeake Bay, Ostend port, and all other North Sea regions. The assignment of individuals to regions clearly illustrated the distinctiveness of Chesapeake Bay and Ostend (Figure 5). In contrast, the remaining five regions showed a nearly equal contribution of loci to all individuals (Figure 5). Two specimens collected in Ostend port were assigned to the North Sea cluster (Figures 4b and 5).
Figure 3.
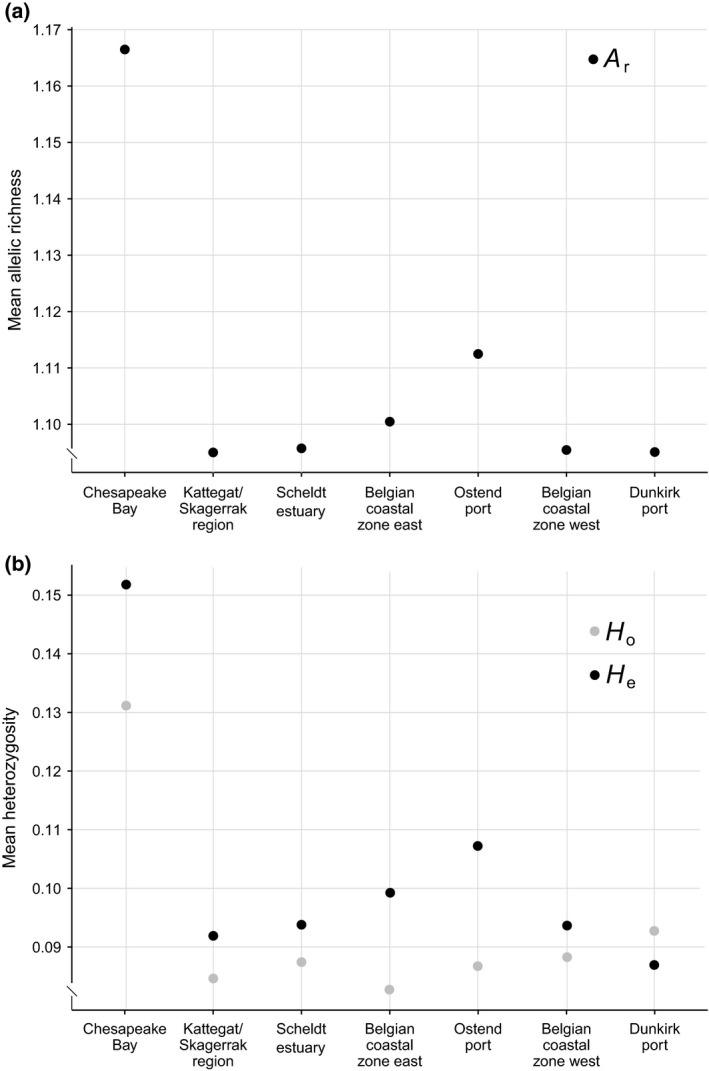
Summary statistics of genetic diversity for seven geographical regions based on 7 k SNPs with a minimum MAF of 1%, including (a) mean allelic richness (A r), and (b) mean expected (H e, black) and observed heterozygosity (H o, gray)
Table 2.
Analysis of molecular variance (AMOVA) of the datasets including and excluding the native region Chesapeake Bay, based on the SNP panels containing all 74 k SNPs or 35 k neutral SNPs separately
| df | SS | MSS | Variance (%) | σ 2 | p | |
|---|---|---|---|---|---|---|
| Including Chesapeake Bay | ||||||
| All SNPs | ||||||
| Between regions | 6 | 1.02 | .170 | 34.3 | .00835 | .00 |
| Within regions | 133 | 1.96 | .015 | 65.7 | .01472 | |
| Total | 139 | 2.98 | .021 | 100.0 | ||
| Neutral SNPs | ||||||
| Between regions | 6 | 0.29 | .048 | 9.3 | .00145 | .00 |
| Within regions | 133 | 2.84 | .021 | 90.7 | .02139 | |
| Total | 139 | 3.14 | .023 | 100.0 | ||
| Excluding Chesapeake Bay | ||||||
| All SNPs | ||||||
| Between regions | 5 | 0.16 | .031 | 6.0 | .00059 | .00 |
| Within regions | 127 | 2.45 | .019 | 94.0 | .01929 | |
| Total | 132 | 2.61 | .020 | 100.0 | ||
| Neutral SNPs | ||||||
| Between regions | 5 | 0.14 | .027 | 5.0 | .00033 | .00 |
| Within regions | 127 | 2.57 | .020 | 95.0 | .02024 | |
| Total | 132 | 2.71 | .021 | 100.0 | ||
Abbreviations: df, degrees of freedom; MSS, mean sum‐of‐squares; SS, sum‐of‐squares.
Table 3.
Pairwise F ST between regions and p‐values (between brackets) for all 74 k SNPs, and the neutral SNP panel of 35 k SNPs
| Chesapeake Bay | Kattegat/Skagerrak | Scheldt estuary | Belgian coastal zone east | Ostend port | Belgian coastal zone west | |
|---|---|---|---|---|---|---|
| All SNPs | ||||||
| Chesapeake Bay | – | – | – | – | – | – |
| Kattegat/Skagerrak | 0.38 (0.00) | – | – | – | – | – |
| Scheldt estuary | 0.38 (0.00) | 0.00 (1.00) | – | – | – | – |
| Belgian coastal zone east | 0.38 (0.00) | 0.00 (1.00) | 0.00 (0.02) | – | – | – |
| Ostend port | 0.36 (0.00) | 0.04 (0.00) | 0.04 (0.00) | 0.03 (0.00) | – | – |
| Belgian coastal zone west | 0.39 (0.00) | 0.00 (0.33) | 0.00 (0.00) | 0.00 (0.37) | 0.04 (0.00) | – |
| Dunkirk port | 0.37 (0.00) | 0.00 (1.00) | 0.00 (1.00) | 0.00 (1.00) | 0.03 (0.00) | 0.00 (1.00) |
| Neutral SNPs | ||||||
| Chesapeake Bay | – | – | – | – | – | – |
| Kattegat/ Skagerrak | 0.12 (0.00) | – | – | – | – | – |
| Scheldt estuary | 0.12 (0.00) | 0.00 (1.00) | – | – | – | – |
| Belgian coastal zone east | 0.11 (0.00) | 0.00 (1.00) | 0.00 (1.00) | – | – | – |
| Ostend port | 0.12 (0.00) | 0.02 (0.00) | 0.02 (0.00) | 0.01 (0.00) | – | – |
| Belgian coastal zone west | 0.12 (0.00) | 0.00 (1.00) | 0.00 (0.28) | 0.00 (1.00) | 0.02 (0.00) | – |
| Dunkirk port | 0.12 (0.00) | 0.00 (1.00) | 0.00 (1.00) | 0.00 (1.00) | 0.01 (0.00) | 0.00 (1.00) |
Pairwise comparisons with F ST above .01 and p‐value below .01 are indicated in bold.
Figure 4.
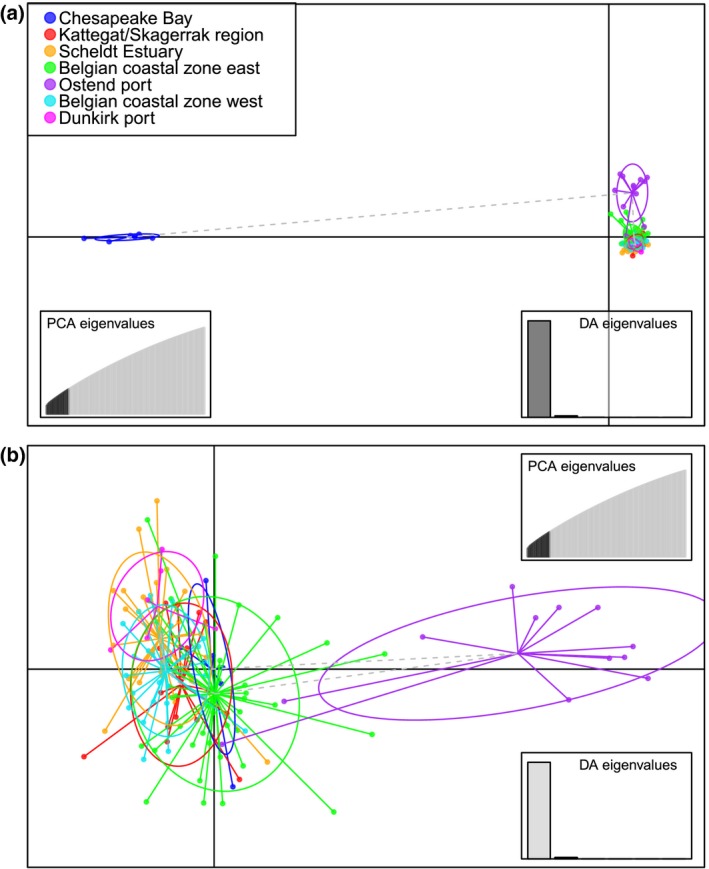
Population structure of M. leidyi as revealed by discriminant analysis of principal components (DAPC) based on the panel with all 74 k SNPs. (a) The first and the second discriminant, (b) the second and third discriminant. Colors indicate the geographical region of origin
Figure 5.
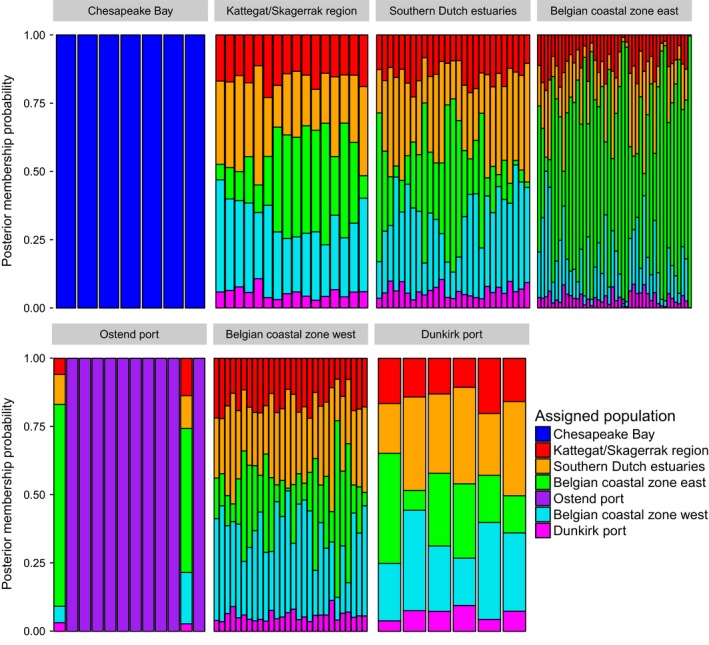
Population assignment of M. leidyi individuals based on DAPC of the SNP panel with all 74 k SNPs. Two individuals collected in the port of Ostend are related to the North Sea population in adjacent coastal areas
4. DISCUSSION
4.1. Genotyping‐by‐sequencing for marine population genetics
SNPs have proven to be effective for genetic characterization of marine populations (Benestan et al., 2015; Carreras et al., 2017; Hess, Campbell, Close, Docker, & Narum, 2013), including zooplankton populations (Blanco‐Bercial & Bucklin, 2016; Reitzel, Herrera, Layden, Martindale, & Shank, 2013) and invasive species (Jeffery et al., 2017; Tepolt & Palumbi, 2015). High‐density markers outperform other analytical techniques in detecting population genetic structure (Bradbury et al., 2015; Jeffries et al., 2016). Estimating an optimal marker density in advance is difficult, especially when genetic diversity and population history are unknown. Therefore, a dense genomic distribution of SNPs is preferred (Catchen et al., 2017; Lowry et al., 2017). We optimized a one‐enzyme GBS procedure (Elshire et al., 2011) for M. leidyi by comparing the performance of six restriction enzymes and opted for the frequent cutting enzyme MspI, based on marker density and data completeness.
4.2. Population connectivity among environmentally distinct regions in the Southern part of the North Sea
The recurrent presence of M. leidyi in the Southern part of the North Sea indicates the establishment of a persistent population (Vansteenbrugge et al., 2015). Mnemiopsis leidyi has been observed during the winter in the Scheldt estuary and ports along the Belgian coast, and the presence of larvae and high population densities suggested that reproduction events in these areas might populate the adjacent coastal zone (Vansteenbrugge et al., 2015). Our data provide clear evidence for the presence of two genetically distinct clusters in the Southern part of the North Sea. The first cluster represents a broadly distributed population, present in the Scheldt Estuary, the Belgian coastal zone, and Dunkirk port and is consistent with the suggested exchange of individuals between the Scheldt estuary, ports, and the North Sea. The second cluster represents a secluded population that was only sampled in the port of Ostend.
Adaptation to the local environment is an important driver of population differentiation in marine organisms (Gagnaire et al., 2015). However, since the population structure based on the neutral SNP panels was highly significant, much of the differentiation between these two clusters was driven by neutral processes. Genetic drift and limited gene flow due to physical barriers (e.g., sluices) might promote local differentiation of the Ostend port population. However, this port was not completely isolated as we identified two individuals of the North Sea population within this location. Also, fluctuating population size of the Ostend port population might reduce the effective population size and promote neutral differentiation (Kalinowski & Waples, 2002; Wright, 1938). It is unlikely that genetic bottlenecks recently occurred since the Ostend port population was more genetically diverse than any other region sampled in the indigenous range. Alternatively, recent reintroduction from distant populations or secondary spread from within the nonindigenous range might explain the difference between both genetic clusters in the Southern part of the North Sea.
Our data further show that Ostend port is probably not an important source area for the North sea, because no individuals collected in the adjacent coastal area were assigned to this population. The two other potential source areas, the Scheldt Estuary and Dunkirk port, were inhabited by the prevalent genetic cluster and are better candidate source populations. However, we did not detect a higher genetic diversity in the Scheldt Estuary and Dunkirk port compared to the coastal area. This can be explained by population expansion during the seasonal reproduction events.
4.3. Population connectivity between geographically distant regions of the North Sea and Baltic Sea
We investigated the population structure of M. leidyi over a large north–south range across the North Sea. We compared specimens collected in the Southern part of the North Sea in 2014 with specimens of the Kattegat/Skagerrak region that were collected in the same year. Although these regions are 500 km apart, both groups were indistinguishable. The lack of population differentiation in marine invertebrates is commonly explained by large population sizes (Deagle et al., 2015) and population connectivity due to limited physical barriers (Cowen & Sponaugle, 2009). Alternatively, similar invasion histories can also explain limited population differentiation between the nonindigenous regions. In the indigenous species range of M. leidyi, patterns of population subdivision concord with well‐established oceanographic boundaries. Distinct populations were found along the coastal zones north and south of the oceanographic front of Cape Hatteras (ca. 550 km apart; Bayha et al., 2015). Also, long‐term survival and dispersal in the open ocean were described in the indigenous species range (Bayha et al., 2015). Secondary spread via ocean currents is possibly an important process maintaining homogeneity (David et al., 2015; Grosholz, 1996). Recent expansion of the prevalent population type toward the Baltic Sea is supported by the local extinction of a genetically distinct population in the Baltic Sea population during 2012 and 2013 (Bolte et al., 2013; Jaspers et al., 2018). Last, anthropogenic transport might play an important role for invasive species (Pérez‐Portela, Arranz, Rius, & Turon, 2013). Transport via ballast water between the North and Baltic Sea is likely to occur, as the area is part of a heavily trafficked maritime transport network (Kaluza, Kölzsch, Gastner, & Blasius, 2010). Rapid recolonization of nonindigenous areas after local population extinction, either by natural dispersal via ocean currents or human‐mediated reintroduction, contributes to the invasive success of M. leidyi.
4.4. The introduction of M. leidyi in Northwestern Europe
Previous molecular studies of M. leidyi showed that the Northwestern European invasion originated from the indigenous species range along the Atlantic coast of North America. Nonindigenous populations often experience decreased genetic diversity due to founder effects. The ability to self‐fertilize and establish new populations in nonindigenous areas with an extremely small number of individuals could intensify this phenomenon. However, previous studies found no evidence of decreased genetic diversity of M. leidyi in the Northwestern Europe. This was attributed to the introduction of large numbers of ctenophores, possibly from recurrent introductions (Bayha et al., 2015; Ghabooli et al., 2011; Reusch et al., 2010). This issue was reevaluated in this study using high‐density molecular markers.
We showed the presence of extensive population structure across the North Atlantic Ocean, with significant neutral differentiation between all individuals of the nonindigenous area of the North Sea and the indigenous population of Chesapeake Bay. Furthermore, genetic diversity among regions in the nonindigenous range was lower than in the indigenous population, despite the much lower sampling size in the latter population. This suggests founder effects and limited reintroduction pressure from the indigenous range. However, these results should be interpreted with care. First, comparison among studies is complicated, since sampling dates span several years. The population in Chesapeake Bay may no longer represent the original population introduced in Northwestern Europe. This scenario is likely because local extinction and recolonization were also observed in the nonindigenous range (Jaspers et al., 2018). Secondly, it should be noted that our sample collection included only seven specimens from a single location, while reconstruction of the invasion histories and the identification of native source populations require extensive sampling in the indigenous species range (Gaither, Bowen, & Toonen, 2013; Muirhead et al., 2008).
5. CONCLUSION
Our results show that GBS is a powerful method to investigate fine‐scale structure among M. leidyi populations. We found evidence for the presence of two genetically distinct populations in the North Sea, with a secluded population present in a single port and a prevalent population present in environmentally distinct and geographically distant regions of the North Sea. Dispersal via ocean currents and anthropogenic transport are important factors in secondary spread of M. leidyi and a better understanding of these mechanisms is crucial for developing effective control measures and management strategies. Both nonindigenous populations were genetically distinct from a population sampled in the indigenous species range. More elaborate sampling in both the indigenous and the nonindigenous area would deepen our insight of introduction pathways and establishment of M. leidyi.
CONFLICT OF INTEREST
None declared.
AUTHOR CONTRIBUTION
CV, LV, HM, OH, TR, IRR, and KH planned the experiment. CV and TK carried out the laboratory experiments. CV and TR analyzed the NGS data. CV, LV, SD, and KH conducted the population genetic analysis. CV, LV, SD, OH, TR, IRR, and KH wrote the manuscript. All authors read and approved the final manuscript.
Supporting information
ACKNOWLEDGMENTS
The financial resources for this work were provided by the Flanders Research Institute for Agriculture, Fisheries and Food (ILVO). The authors thank Andre Cattrijsse and Michiel T'Jampens from the Flanders Marine Institute (VLIZ), and the captain and crew of the RV Simon Stevin for the practical support during sampling campaigns. Sincere thanks to Ronny Olemans for the samples collected in the Scheldt Estuary in 2014, David Vuylsteke for the samples collected in Ostend port in 2014, Lene Friis Møller for the samples of the Gullmar Fjord, Jamileh Javidpour for the samples of the Kattegat and Skaggerak sampling locations, Elvire Antajan for the samples of Dunkirk port and Chesapeake Bay, Andreas Vanden Bavière and Sarah Tilkin for their assistance collecting samples in the Belgian coastal zone, Stefan Hoffman for the DNA extractions of samples from 2013 and older, Ariane Staelens for the technical assistance in the laboratory, and Elisabeth Veeckman and Sabine Van Glabeke for the assistance with the data analysis.
Verwimp C, Vansteenbrugge L, Derycke S, et al. Population genomic structure of the gelatinous zooplankton species Mnemiopsis leidyi in its nonindigenous range in the North Sea. Ecol Evol. 2020;10:11–25. 10.1002/ece3.5468
DATA ACCESSIBILITY
The DNA sequences generated for this study are available at the NCBI sequence read archive under SRA accession numbers SRR6950721–SRR6950884.
REFERENCES
- Allendorf, F. W. , Hohenlohe, P. A. , & Luikart, G. (2010). Genomics and the future of conservation genetics. Nature Reviews Genetics, 11, 697 10.1038/nrg2844 [DOI] [PubMed] [Google Scholar]
- Andrews, K. R. , Good, J. M. , Miller, M. R. , Luikart, G. , & Hohenlohe, P. A. (2016). Harnessing the power of Radseq for ecological and evolutionary genomics. Nature Reviews Genetics, 17, 81 10.1038/nrg.2015.28 [DOI] [PMC free article] [PubMed] [Google Scholar]
- Andrews, S. (2010). FastQC 0.11.7: A quality control tool for high throughput sequence data. Available from http://www.bioinformatics.babraham.ac.uk/projects/fastqc
- Bayha, K. M. , Chang, M. H. , Mariani, C. L. , Richardson, J. L. , Edwards, D. L. , DeBoer, T. S. , … Caccone, A. (2015). Worldwide phylogeography of the invasive Ctenophore Mnemiopsis leidyi (Ctenophora) based on nuclear and mitochondrial DNA data. Biological Invasions, 17, 827–850. 10.1007/s10530-014-0770-6 [DOI] [Google Scholar]
- Benestan, L. , Gosselin, T. , Perrier, C. , Sainte‐Marie, B. , Rochette, R. , & Bernatchez, L. (2015). RAD genotyping reveals fine‐scale genetic structuring and provides powerful population assignment in a widely distributed marine species, the a Merican Lobster (H Omarus americanus). Molecular Ecology, 24, 3299–3315. 10.1111/mec.13245 [DOI] [PubMed] [Google Scholar]
- Benjamini, Y. , & Hochberg, Y. (1995). Controlling the false discovery rate: A practical and powerful approach to multiple testing. Journal of the Royal Statistical Society. Series B (Methodological), 57, 289–300. 10.2307/2346101 [DOI] [Google Scholar]
- Blanco‐Bercial, L. , & Bucklin, A. (2016). New view of population genetics of zooplankton: RAD‐Seq analysis reveals population structure of the North Atlantic Planktonic Copepod Centropages Typicus. Molecular Ecology, 25, 1566–1580. 10.1111/mec.13581 [DOI] [PubMed] [Google Scholar]
- Bolte, S. , Fuentes, V. , Haslob, H. , Huwer, B. , Thibault‐Botha, D. , Angel, D. , … Reusch, T. B. (2013). Population genetics of the invasive ctenophore Mnemiopsis leidyi in Europe reveal source–sink dynamics and secondary dispersal to the Mediterranean Sea. Marine Ecology Progress Series, 485, 25–36. 10.3354/meps10321 [DOI] [Google Scholar]
- Bradbury, I. R. , Hamilton, L. C. , Dempson, B. , Robertson, M. J. , Bourret, V. , Bernatchez, L. , & Verspoor, E. (2015). Transatlantic secondary contact in Atlantic salmon, comparing microsatellites, a single nucleotide polymorphism array and restriction‐site associated DNA sequencing for the resolution of complex spatial structure. Molecular Ecology, 24, 5130–5144. 10.1111/mec.13395 [DOI] [PubMed] [Google Scholar]
- Carlton, J. T. , & Geller, J. B. (1993). Ecological Roulette: The global transport of nonindigenous marine organisms. Science, 261, 78–82. 10.1126/science.261.5117.78 [DOI] [PubMed] [Google Scholar]
- Carreras, C. , Ordóñez, V. , Zane, L. , Kruschel, C. , Nasto, I. , Macpherson, E. , & Pascual, M. (2017). Population genomics of an endemic Mediterranean fish: Differentiation by fine scale dispersal and adaptation. Scientific Reports, 7, 43417 10.1038/srep43417 [DOI] [PMC free article] [PubMed] [Google Scholar]
- Catchen, J. M. , Hohenlohe, P. A. , Bernatchez, L. , Funk, W. C. , Andrews, K. R. , & Allendorf, F. W. (2017). Unbroken: RADseq remains a powerful tool for understanding the genetics of adaptation in natural populations. Molecular Ecology Resources, 17, 362–365. 10.1111/1755-0998.12669 [DOI] [PubMed] [Google Scholar]
- Chang, C. C. , Chow, C. C. , Tellier, L. C. , Vattikuti, S. , Purcell, S. M. , & Lee, J. J. (2015). Second‐generation Plink: Rising to the challenge of larger and richer datasets. Gigascience, 4, 7 10.1186/s13742-015-0047-8 [DOI] [PMC free article] [PubMed] [Google Scholar]
- Chown, S. L. , Hodgins, K. A. , Griffin, P. C. , Oakeshott, J. G. , Byrne, M. , & Hoffmann, A. A. (2015). Biological invasions, climate change and genomics. Evolutionary Applications, 8, 23–46. 10.1111/eva.12234 [DOI] [PMC free article] [PubMed] [Google Scholar]
- Collingridge, K. , van der Molen, J. , & Pitois, S. (2014). Modelling risk areas in the North Sea for blooms of the invasive comb jelly Mnemiopsis leidyi A. Agassiz, 1865. Aquatic Invasions, 9, 10.3391/ai.2014.9.1.02 [DOI] [Google Scholar]
- Costello, J. , Bayha, K. , Mianzan, H. , Shiganova, T. , & Purcell, J. (2012). Transitions of Mnemiopsis leidyi (Ctenophora: Lobata) from a native to an exotic species: A review. Hydrobiologia, 690, 21–46. 10.1007/s10750-012-1037-9 [DOI] [Google Scholar]
- Costello, J. , Sullivan, B. K. , Gifford, D. V. , Van Keuren, D. , & Sullivan, L. (2006). Seasonal refugia, shoreward thermal amplification, and metapopulation dynamics of the Ctenophore Mnemiopsis leidyi in Narragansett Bay, Rhode Island. Limnology and Oceanography, 51, 1819–1831. 10.4319/lo.2006.51.4.1819 [DOI] [Google Scholar]
- Cowen, R. K. , & Sponaugle, S. (2009). Larval dispersal and marine population connectivity. Annual Review of Marine Science, 1, 443–466. 10.1146/annurev.marine.010908.163757 [DOI] [PubMed] [Google Scholar]
- Cristescu, M. E. (2015). Genetic reconstructions of invasion history. Molecular Ecology, 24, 2212–2225. 10.1111/mec.13117 [DOI] [PubMed] [Google Scholar]
- Dabney, A. , Storey, J. D. , & Warnes, G. R. (2010). Qvalue: Q‐value estimation for false discovery rate control; R package version, 1.24.20.
- Danecek, P. , Auton, A. , Abecasis, G. , Albers, C. A. , Banks, E. , DePristo, M. A. , … Durbin, R. (2011). The variant call format and Vcftools. Bioinformatics, 27, 2156–2158. 10.1093/bioinformatics/btr330 [DOI] [PMC free article] [PubMed] [Google Scholar]
- Davey, J. W. , Hohenlohe, P. A. , Etter, P. D. , Boone, J. Q. , Catchen, J. M. , & Blaxter, M. L. (2011). Genome‐wide genetic marker discovery and genotyping using next‐generation sequencing. Nature Reviews Genetics, 12, 499–510. 10.1038/nrg3012 [DOI] [PubMed] [Google Scholar]
- David, C. , Vaz, S. , Loots, C. , Antajan, E. , van der Molen, J. , & Travers‐Trolet, M. (2015). Understanding winter distribution and transport pathways of the invasive Ctenophore Mnemiopsis leidyi in the North Sea: Coupling habitat and dispersal modelling approaches. Biological Invasions, 17, 2605–2619. 10.1007/s10530-015-0899-y [DOI] [Google Scholar]
- de Villemereuil, P. , Frichot, É. , Bazin, É. , François, O. , & Gaggiotti, O. E. (2014). Genome scan methods against more complex models: When and how much should we trust them? Molecular Ecology, 23, 2006–2019. 10.1111/mec.12705 [DOI] [PubMed] [Google Scholar]
- Deagle, B. E. , Faux, C. , Kawaguchi, S. , Meyer, B. , & Jarman, S. N. (2015). Antarctic krill population genomics: Apparent panmixia, but genome complexity and large population size muddy the water. Molecular Ecology, 24, 4943–4959. 10.1111/mec.13370 [DOI] [PubMed] [Google Scholar]
- Elshire, R. J. , Glaubitz, J. C. , Sun, Q. , Poland, J. A. , Kawamoto, K. , Buckler, E. S. , & Mitchell, S. E. (2011). A robust, simple genotyping‐by‐sequencing (Gbs) approach for high diversity species. PLoS ONE, 6, e19379 10.1371/journal.pone.0019379 [DOI] [PMC free article] [PubMed] [Google Scholar]
- Ewels, P. , Magnusson, M. , Lundin, S. , & Käller, M. (2016). MultiQC: Summarize analysis results for multiple tools and samples in a single report. Bioinformatics, 32, 3047–3048. 10.1093/bioinformatics/btw354 [DOI] [PMC free article] [PubMed] [Google Scholar]
- Fuentes, V. L. , Angel, D. L. , Bayha, K. M. , Atienza, D. , Edelist, D. , Bordehore, C. , … Purcell, J. E. (2010). Blooms of the invasive Ctenophore, Mnemiopsis leidyi, span the Mediterranean Sea in 2009 In Purcell J. E., & Angel D. L. (Eds.), Jellyfish blooms: New problems and solutions (pp. 23–37). Berlin, Germany: Springer. [Google Scholar]
- Gagnaire, P.‐A. , Broquet, T. , Aurelle, D. , Viard, F. , Souissi, A. , Bonhomme, F. , … Bierne, N. (2015). Using neutral, selected, and hitchhiker loci to assess connectivity of marine populations in the genomic era. Evolutionary Applications, 8, 769–786. 10.1111/eva.12288 [DOI] [PMC free article] [PubMed] [Google Scholar]
- Gaither, M. R. , Bowen, B. W. , & Toonen, R. J. (2013). Population structure in the native range predicts the spread of introduced marine species. Proceedings of the Royal Society B: Biological Sciences, 280, 20130409 10.1098/rspb.2013.0409 [DOI] [PMC free article] [PubMed] [Google Scholar]
- Ghabooli, S. , Shiganova, T. A. , Briski, E. , Piraino, S. , Fuentes, V. , Thibault‐Botha, D. , … MacIsaac, H. J. (2013). Invasion pathway of the ctenophore Mnemiopsis leidyi in the Mediterranean Sea. PLoS ONE, 8, e81067 10.1371/journal.pone.0081067 [DOI] [PMC free article] [PubMed] [Google Scholar]
- Ghabooli, S. , Shiganova, T. A. , Zhan, A. , Cristescu, M. E. , Eghtesadi‐Araghi, P. , & MacIsaac, H. J. (2011). Multiple introductions and invasion pathways for the invasive Ctenophore Mnemiopsis leidyi in Eurasia. Biological Invasions, 13, 679–690. 10.1007/s10530-010-9859-8 [DOI] [Google Scholar]
- Goudet, J. (2005). Hierfstat, a package for R to compute and test hierarchical F‐statistics. Molecular Ecology Notes, 5, 184–186. 10.1111/j.1471-8286.2004.00828.x [DOI] [Google Scholar]
- Grosholz, E. D. (1996). Contrasting rates of spread for introduced species in terrestrial and marine systems. Ecology, 77, 1680–1686. 10.2307/2265773 [DOI] [Google Scholar]
- Grosholz, E. (2002). Ecological and evolutionary consequences of coastal invasions. Trends in Ecology & Evolution, 17, 22–27. 10.1016/S0169-5347(01)02358-8 [DOI] [Google Scholar]
- Herten, K. , Hestand, M. S. , Vermeesch, J. R. , & Van Houdt, J. K. (2015). GBSX: A toolkit for experimental design and demultiplexing genotyping by sequencing experiments. BMC Bioinformatics, 16, 73 10.1186/s12859-015-0514-3 [DOI] [PMC free article] [PubMed] [Google Scholar]
- Hess, J. E. , Campbell, N. R. , Close, D. A. , Docker, M. F. , & Narum, S. R. (2013). Population genomics of Pacific Lamprey: adaptive variation in a highly dispersive species. Molecular Ecology, 22, 2898–2916. 10.1111/mec.12150 [DOI] [PubMed] [Google Scholar]
- Hohenlohe, P. A. (2004). Limits to gene flow in marine animals with planktonic larvae: Models of littorina species around point conception, California. Biological Journal of the Linnean Society, 82, 169–187. 10.1111/j.1095-8312.2004.00318.x [DOI] [Google Scholar]
- Hulme, P. E. (2009). Trade, transport and trouble: Managing invasive species pathways in an era of globalization. Journal of Applied Ecology, 46, 10–18. 10.1111/j.1365-2664.2008.01600.x [DOI] [Google Scholar]
- Jaspers, C. , Costello, J. H. , & Colin, S. P. (2014). Carbon content of Mnemiopsis leidyi eggs and specific egg production rates in Northern Europe. Journal of Plankton Research, 37, 11–15. 10.1093/plankt/fbu102 [DOI] [Google Scholar]
- Jaspers, C. , Huwer, B. , Antajan, E. , Hosia, A. , Hinrichsen, H.‐H. , Biastoch, A. , … Woźniczka, A. (2018). Ocean current connectivity propelling the secondary spread of a marine invasive comb jelly across Western Eurasia. Global Ecology and Biogeography, 27(7), 814–827. 10.1111/geb.12742 [DOI] [Google Scholar]
- Jaspers, C. , Møller, L. F. , & Kiørboe, T. (2015). Reproduction rates under variable food conditions and starvation in Mnemiopsis leidyi: Significance for the invasion success of a ctenophore. Journal of Plankton Research, 37, 1011–1018. 10.1093/plankt/fbv017 [DOI] [Google Scholar]
- Jeffery, N. W. , DiBacco, C. , Van Wyngaarden, M. , Hamilton, L. C. , Stanley, R. R. , Bernier, R. , … Bradbury, I. R. (2017). RAD sequencing reveals genomewide divergence between independent invasions of the European Green Crab (Carcinus maenas) in the Northwest Atlantic. Ecology and Evolution, 7, 2513–2524. 10.1002/ece3.2872 [DOI] [PMC free article] [PubMed] [Google Scholar]
- Jeffries, D. L. , Copp, G. H. , Lawson Handley, L. , Olsén, K. H. , Sayer, C. D. , & Hänfling, B. (2016). Comparing Rad Seq and microsatellites to infer complex phylogeographic patterns, an empirical perspective in the Crucian Carp, Carassius carassius, L. Molecular Ecology, 25, 2997–3018. 10.1111/mec.13613 [DOI] [PubMed] [Google Scholar]
- Johansson, M. L. , Alberto, F. , Reed, D. C. , Raimondi, P. T. , Coelho, N. C. , Young, M. A. , … Serrao, E. A. (2015). Seascape drivers of Macrocystis pyrifera population genetic structure in the northeast Pacific. Molecular Ecology, 24, 4866–4885. 10.1111/mec.13371 [DOI] [PubMed] [Google Scholar]
- Jombart, T. (2008). Adegenet: A R package for the multivariate analysis of genetic markers. Bioinformatics, 24, 1403–1405. 10.1093/bioinformatics/btn129 [DOI] [PubMed] [Google Scholar]
- Jones, G. P. , Planes, S. , & Thorrold, S. R. (2005). Coral reef fish larvae settle close to home. Current Biology, 15, 1314–1318. 10.1016/j.cub.2005.06.061 [DOI] [PubMed] [Google Scholar]
- Kalinowski, S. T. , & Waples, R. S. (2002). Relationship of effective to census size in fluctuating populations. Conservation Biology, 16, 129–136. 10.1046/j.1523-1739.2002.00134.x [DOI] [PubMed] [Google Scholar]
- Kaluza, P. , Kölzsch, A. , Gastner, M. T. , & Blasius, B. (2010). The complex network of global cargo ship movements. Journal of the Royal Society Interface, 7, 1093–1103. 10.1098/rsif.2009.0495 [DOI] [PMC free article] [PubMed] [Google Scholar]
- Katsanevakis, S. , Wallentinus, I. , Zenetos, A. , Leppäkoski, E. , Çinar, M. E. , Oztürk, B. , … Cardoso, A. C. (2014). Impacts of invasive alien marine species on ecosystem services and biodiversity: A Pan‐European review. Aquatic Invasions, 9, 391–423. 10.3391/ai.2014.9.4.01 [DOI] [Google Scholar]
- Li, H. , & Durbin, R. (2009). Fast and accurate short read alignment with burrows‐wheeler transform. Bioinformatics, 25, 1754–1760. 10.1093/bioinformatics/btp324 [DOI] [PMC free article] [PubMed] [Google Scholar]
- Li, H. , Handsaker, B. , Wysoker, A. , Fennell, T. , Ruan, J. , Homer, N. , … Durbin, R. (2009). The sequence alignment/map format and Samtools. Bioinformatics, 25, 2078–2079. 10.1093/bioinformatics/btp352 [DOI] [PMC free article] [PubMed] [Google Scholar]
- Linck, E. B. , & Battey, C. (2019). Minor allele frequency thresholds strongly affect population structure inference with genomic data sets. Molecular Ecology Resources, 19(3), 639–647. 10.1111/1755-0998.12995 [DOI] [PubMed] [Google Scholar]
- Lowry, D. B. , Hoban, S. , Kelley, J. L. , Lotterhos, K. E. , Reed, L. K. , Antolin, M. F. , & Storfer, A. (2017). Responsible Rad: Striving for best practices in population genomic studies of adaptation. Molecular Ecology Resources, 17, 366–369. 10.1111/1755-0998.12677 [DOI] [PMC free article] [PubMed] [Google Scholar]
- Luu, K. , Bazin, E. , & Blum, M. G. (2017). Pcadapt: An R package to perform genome scans for selection based on principal component analysis. Molecular Ecology Resources, 17, 67–77. 10.1111/1755-0998.12592 [DOI] [PubMed] [Google Scholar]
- Martin, M. (2011). Cutadapt removes adapter sequences from high‐throughput sequencing reads. Embnet.journal, 17, 10 10.14806/ej.17.1.200 [DOI] [Google Scholar]
- McKenna, A. , Hanna, M. , Banks, E. , Sivachenko, A. , Cibulskis, K. , Kernytsky, A. , … DePristo, M. A. (2010). The genome analysis toolkit: A mapreduce framework for analyzing next‐generation DNA sequencing data. Genome Research, 20(9), 1297–1303. 10.1101/gr.107524.110 [DOI] [PMC free article] [PubMed] [Google Scholar]
- Molnar, J. L. , Gamboa, R. L. , Revenga, C. , & Spalding, M. D. (2008). Assessing the global threat of invasive species to marine biodiversity. Frontiers in Ecology and the Environment, 6, 485–492. 10.1890/070064 [DOI] [Google Scholar]
- Muirhead, J. R. , Gray, D. K. , Kelly, D. W. , Ellis, S. M. , Heath, D. D. , & MacIsaac, H. J. (2008). Identifying the source of species invasions: Sampling intensity vs. genetic diversity. Molecular Ecology, 17, 1020–1035. 10.1111/j.1365-294X.2008.03669.x [DOI] [PubMed] [Google Scholar]
- Narum, S. R. , Buerkle, C. A. , Davey, J. W. , Miller, M. R. , & Hohenlohe, P. A. (2013). Genotyping‐by‐sequencing in ecological and conservation genomics. Molecular Ecology, 22, 2841–2847. 10.1111/mec.12350 [DOI] [PMC free article] [PubMed] [Google Scholar]
- Narum, S. R. , & Hess, J. E. (2011). Comparison of Fst outlier tests for Snp loci under selection. Molecular Ecology Resources, 11, 184–194. 10.1111/j.1755-0998.2011.02987.x [DOI] [PubMed] [Google Scholar]
- Nei, M. (1972). Genetic distance between populations. The American Naturalist, 106, 283–292. 10.1086/282771 [DOI] [Google Scholar]
- O'Connor, M. I. , Bruno, J. F. , Gaines, S. D. , Halpern, B. S. , Lester, S. E. , Kinlan, B. P. , & Weiss, J. M. (2007). Temperature control of larval dispersal and the implications for marine ecology, evolution, and conservation. Proceedings of the National Academy of Sciences of the United States of America, 104, 1266–1271. https://doi.org/10.1073pnas.0603422104 [DOI] [PMC free article] [PubMed] [Google Scholar]
- Oguz, T. , Fach, B. , & Salihoglu, B. (2008). Invasion dynamics of the alien Ctenophore Mnemiopsis leidyi and its impact on anchovy collapse in the Black Sea. Journal of Plankton Research, 30, 1385–1397. 10.1093/plankt/fbn094 [DOI] [Google Scholar]
- Ojaveer, H. , Galil, B. S. , Campbell, M. L. , Carlton, J. T. , Canning‐Clode, J. , Cook, E. J. , … Ruiz, G. (2015). Classification of non‐indigenous species based on their impacts: Considerations for application in marine management. PLoS Biology, 13, e1002130 10.1371/journal.pbio.1002130 [DOI] [PMC free article] [PubMed] [Google Scholar]
- Palumbi, S. R. (2003). Population genetics, demographic connectivity, and the design of marine reserves. Ecological Applications, 13, 146–158. 10.1890/1051-0761(2003)013[0146:PGDCAT]2.0.CO;2 [DOI] [Google Scholar]
- Paradis, E. (2010). Pegas: An R package for population genetics with an integrated–modular approach. Bioinformatics, 26, 419–420. 10.1093/bioinformatics/btp696 [DOI] [PubMed] [Google Scholar]
- Pembleton, L. W. , Cogan, N. O. , & Forster, J. W. (2013). StAMPP: An R package for calculation of genetic differentiation and structure of mixed‐ploidy level populations. Molecular Ecology Resources, 13, 946–952. 10.1111/1755-0998.12129 [DOI] [PubMed] [Google Scholar]
- Pérez‐Portela, R. , Arranz, V. , Rius, M. , & Turon, X. (2013). Cryptic speciation or global spread? The case of a cosmopolitan marine invertebrate with limited dispersal capabilities. Scientific Reports, 3, 3197 10.1038/srep03197 [DOI] [PMC free article] [PubMed] [Google Scholar]
- Purcell, J. E. , Shiganova, T. A. , Decker, M. B. , & Houde, E. D. (2001). The ctenophore Mnemiopsis in native and exotic habitats: US estuaries versus the Black Sea Basin. Hydrobiologia, 451, 145–176. 10.1023/A:1011826618539 [DOI] [Google Scholar]
- Puritz, J. B. , & Toonen, R. J. (2011). Coastal pollution limits pelagic larval dispersal. Nature Communications, 2, 226 10.1038/ncomms1238 [DOI] [PubMed] [Google Scholar]
- Quinlan, A. R. , & Hall, I. M. (2010). BEDTools: A flexible suite of utilities for comparing genomic features. Bioinformatics, 26, 841–842. 10.1093/bioinformatics/btq033 [DOI] [PMC free article] [PubMed] [Google Scholar]
- R Core Team (2017). R: A language and environment for statistical computing. Vienna, Austria: R Foundation for Statistical Computing. [Google Scholar]
- Rapoza, R. , Novak, D. , & Costello, J. (2005). Life‐stage dependent, in situ dietary patterns of the lobate Ctenophore Mnemiopsis leidyi Agassiz 1865. Journal of Plankton Research, 27, 951–956. 10.1093/plankt/fbi065 [DOI] [Google Scholar]
- Reitzel, A. , Herrera, S. , Layden, M. , Martindale, M. , & Shank, T. (2013). Going where traditional markers have not gone before: Utility of and promise for rad sequencing in marine invertebrate phylogeography and population genomics. Molecular Ecology, 22, 2953–2970. 10.1111/mec.12228 [DOI] [PMC free article] [PubMed] [Google Scholar]
- Reusch, T. B. , Bolte, S. , Sparwel, M. , Moss, A. G. , & Javidpour, J. (2010). Microsatellites reveal origin and genetic diversity of Eurasian invasions by one of the world's most notorious marine invader, Mnemiopsis leidyi (Ctenophora). Molecular Ecology, 19, 2690–2699. 10.1111/j.1365-294X.2010.04701.x [DOI] [PubMed] [Google Scholar]
- Ricciardi, A. , & MacIsaac, H. J. (2000). Recent mass invasion of the North American Great Lakes by Ponto‐Caspian Species. Trends in Ecology & Evolution, 15, 62–65. 10.1016/S0169-5347(99)01745-0 [DOI] [PubMed] [Google Scholar]
- Roesti, M. , Salzburger, W. , & Berner, D. (2012). Uninformative polymorphisms bias genome scans for signatures of selection. BMC Evolutionary Biology, 12, 94 10.1186/1471-2148-12-94 [DOI] [PMC free article] [PubMed] [Google Scholar]
- Rohland, N. , & Reich, D. (2012). Cost‐effective, high‐throughput DNA sequencing libraries for multiplexed target capture. Genome Research, 22, 939–946. 10.1101/gr.128124.111 [DOI] [PMC free article] [PubMed] [Google Scholar]
- Ruiz, G. M. , Fofonoff, P. W. , Carlton, J. T. , Wonham, M. J. , & Hines, A. H. (2000). Invasion of coastal marine communities in North America: Apparent patterns, processes, and biases. Annual Review of Ecology and Systematics, 31, 481–531. 10.1146/annurev.ecolsys.31.1.481 [DOI] [Google Scholar]
- Ryan, J. F. , Pang, K. , Schnitzler, C. E. , Nguyen, A.‐D. , Moreland, R. T. , Simmons, D. K. , … Baxevanis, A. D. (2013). The genome of the Ctenophore Mnemiopsis leidyi and its implications for cell type evolution. Science, 342, 1242592 10.1126/science.1242592 [DOI] [PMC free article] [PubMed] [Google Scholar]
- Sax, D. F. , Stachowicz, J. J. , Brown, J. H. , Bruno, J. F. , Dawson, M. N. , Gaines, S. D. , … Rice, W. R. (2007). Ecological and evolutionary insights from species invasions. Trends in Ecology & Evolution, 22, 465–471. 10.1016/j.tree.2007.06.009 [DOI] [PubMed] [Google Scholar]
- Schaber, M. , Haslob, H. , Huwer, B. , Harjes, A. , Hinrichsen, H.‐H. , Köster, F. W. , … Voss, R. (2011). The invasive ctenophore Mnemiopsis leidyi in the Central Baltic Sea: Seasonal phenology and hydrographic influence on spatio‐temporal distribution patterns. Journal of Plankton Research, 33, 1053–1065. 10.1093/plankt/fbq167 [DOI] [Google Scholar]
- Schmieder, R. , & Edwards, R. (2011). Quality control and preprocessing of metagenomic datasets. Bioinformatics, 27, 863–864. 10.1093/bioinformatics/btr026 [DOI] [PMC free article] [PubMed] [Google Scholar]
- Selkoe, K. A. , Aloia, C. C. , Crandall, E. D. , Iacchei, M. , Liggins, L. , Puritz, J. B. , … Toonen, R. J. (2016). A decade of seascape genetics: Contributions to basic and applied marine connectivity. Marine Ecology Progress Series, 554, 1–19. 10.3354/meps11792 [DOI] [Google Scholar]
- Sherman, C. , Lotterhos, K. , Richardson, M. , Tepolt, C. , Rollins, L. , Palumbi, S. , & Miller, A. (2016). What are we missing about marine invasions? Filling in the gaps with evolutionary genomics. Marine Biology, 163, 198 10.1007/s00227-016-2961-4 [DOI] [Google Scholar]
- Shiganova, T. A. , & Bulgakova, Y. V. (2000). Effects of gelatinous plankton on Black Sea and Sea of Azov Fish and their food resources. ICES Journal of Marine Science, 57, 641–648. 10.1006/jmsc.2000.0736 [DOI] [Google Scholar]
- Simberloff, D. , Martin, J.‐L. , Genovesi, P. , Maris, V. , Wardle, D. A. , Aronson, J. , … Vilà, M. (2013). Impacts of biological invasions: What's what and the way forward. Trends in Ecology & Evolution, 28, 58–66. 10.1016/j.tree.2012.07.013 [DOI] [PubMed] [Google Scholar]
- Tange, O. (2011). GNU parallel ‐ the command‐line power tool. The USENIX Magazine, 36(1), 42–47. 10.5281/zenodo.16303 [DOI] [Google Scholar]
- Tepolt, C. K. , & Palumbi, S. (2015). Transcriptome sequencing reveals both neutral and adaptive genome dynamics in a marine invader. Molecular Ecology, 24, 4145–4158. 10.1111/mec.13294 [DOI] [PubMed] [Google Scholar]
- Tiselius, P. , & Møller, L. F. (2017). Community cascades in a marine pelagic food web controlled by the non‐visual apex predator Mnemiopsis leidyi . Journal of Plankton Research, 39, 271–279. 10.1093/plankt/fbw096 [DOI] [Google Scholar]
- Vansteenbrugge, L. , Ampe, B. , De Troch, M. , Vincx, M. , & Hostens, K. (2015). On the distribution and population dynamics of the ctenophore Mnemiopsis leidyi in the Belgian part of the North Sea and Westerschelde Estuary. Marine Environmental Research, 110, 33–44. 10.1016/j.marenvres.2015.07.011 [DOI] [PubMed] [Google Scholar]
- Viard, F. , David, P. , & Darling, J. A. (2016). Marine invasions enter the genomic era: Three lessons from the past, and the way forward. Current Zoology, 62, 629–642. 10.1093/cz/zow053 [DOI] [PMC free article] [PubMed] [Google Scholar]
- Weir, B. S. , & Cockerham, C. C. (1984). Estimating F‐statistics for the analysis of population structure. Evolution, 38, 1358–1370. 10.1111/j.1558-5646.1984.tb05657.x [DOI] [PubMed] [Google Scholar]
- Whitlock, M. C. , & Lotterhos, K. E. (2015). Reliable detection of loci responsible for local adaptation: Inference of a null model through trimming the distribution of F St. The American Naturalist, 186, S24–S36. 10.1086/682949 [DOI] [PubMed] [Google Scholar]
- Wright, S. (1938). Size of population and breeding structure in relation to evolution. Science, 87, 430–431. [Google Scholar]
Associated Data
This section collects any data citations, data availability statements, or supplementary materials included in this article.
Supplementary Materials
Data Availability Statement
The DNA sequences generated for this study are available at the NCBI sequence read archive under SRA accession numbers SRR6950721–SRR6950884.