

Abstract
Microbiota play an important role in total tract nutrient digestion, especially when fibrous diets are fed to pigs. This study aimed to use metagenomics to predict faecal nutrient digestibility in grower‐finisher pigs. The study design consisted of 160 three‐way crossbreed grower‐finisher pigs (80 female and 80 male) which were either fed a diet based on corn/soybean meal or a more fibrous diet based on wheat/barley/by‐products. On the day before slaughter, faecal samples were collected and used to determine faecal digestibility of dry matter, ash, organic matter, crude protein, crude fat, crude fibre and non‐starch polysaccharides. The faecal samples were also sequenced for the 16S hypervariable region of bacteria (V3/V4) to profile the faecal microbiome. With these data, we calculated the between‐animal variation in faecal nutrient digestibility associated with variation in the faecal microbiome, that is the “microbiability”. The microbiability values were significantly greater than zero for dry matter, organic matter, crude protein, crude fibre and non‐starch polysaccharides, ranging from 0.58 to 0.93, as well as for crude fat with a value of 0.37, but not significantly different from zero for ash. Using leave‐one‐out cross‐validation, we estimated the accuracy of predicting digestibility values of individual pigs based on their faecal microbiota composition. The accuracies of prediction for crude fat and ash digestibility were virtually 0, and for the other nutrients, the accuracies ranged from 0.42 to 0.63. In conclusion, the faecal microbiota composition gave high microbiability values for faecal digestibility of dry matter, organic matter, crude protein, crude fibre and non‐starch polysaccharides. The accuracies of prediction are relatively low if the interest is in precisely predicting faecal nutrient digestibility of individual pigs, but are promising from the perspective of ranking animals in a genetic selection context.
Keywords: digestion, metagenomics, microbiota, pig
1. INTRODUCTION
Feed efficiency is important in the pork industry, as feed costs comprise the main cost of production. Feed efficiency is a complex trait; within‐diet variation in feed efficiency between pigs is phenotypically associated with feeding behaviour (Shirali, Varley, & Jensen, 2017), adipose, muscle and/or liver tissue gene expression (Horodyska, Hamill, et al., 2019; Horodyska et al., 2018; Horodyska, Reyer, et al., 2019) and faecal microbiota composition (Camarinha‐Silva et al., 2017; Tan et al., 2018; Verschuren et al., 2018; Vigors, O'Doherty, Kelly, O'Shea, & Sweeney, 2016; Yang et al., 2017). Another trait associated with variation in feed efficiency is faecal nutrient digestibility, as divergent selection for feed efficiency in a selection experiment resulted in lines of pigs showing differences in faecal nutrient digestibility values (Harris, Patience, Lonergan, Dekkers, & Gabler, 2012; Mauch et al., 2018). The nutrients which are not digested by the pigs’ digestive enzymes are in part fermented by gut microbiota residing in the gastrointestinal tract. Using metagenomics, which is the genomic analysis of microorganisms (Handelsman, 2004), it has been shown that gut microbiota contribute to within‐diet variation in faecal digestibility of nutrients in pigs, as faecal microbial operational taxonomic units (OTUs), phyla and genera have been correlated with digestibility of energy, crude protein (CP) and cell wall components (Le Sciellour, Labussière, Zemb, & Renaudeau, 2018; Niu et al., 2015). Focus on specific microbial OTUs, phyla or genera related to variation in faecal nutrient digestibility, however, ignores the complexity of the microbial coherence and interrelationship. Using a whole community approach, the percentage of phenotypic variation that is associated with differences in faecal microbiota composition, which has been termed microbiability (Difford, Lassen, & Lovendahl, 2016), can be estimated. This approach has successfully been used to associate faecal microbiota composition with complex traits in pigs (Camarinha‐Silva et al., 2017), chickens (Wen et al., 2019), cattle (Difford et al., 2016) and humans (Ross, Moate, Marett, Cocks, & Hayes, 2013). Using faecal microbiota composition to predict faecal nutrient digestibility could be an alternative to traditional methods to measure nutrient digestibility, which are more expensive to use on the large scale that is necessary for breeding.
This study investigated the use of metagenomics in grower‐finisher pigs to identify the proportion of phenotypic variance associated with and the accuracy of prediction of faecal nutrient digestibility values by faecal microbiota composition. We considered two diets that are representative for the main diets fed to pigs in commercial and breeding herds across the world.
2. MATERIAL AND METHODS
This study was carried out in strict accordance with the recommendations in the European Guidelines for accommodation and care of animals. The protocol was approved by the Animal Care and Use Committee of Schothorst Feed Research B.V, Lelystad, The Netherlands (Protocol Number: AVD 246002015120/132) and is in strict accordance with Directive 2010/63/EU.
2.1. Animals and experimental design
Pigs used in this study originated from a three‐way cross, that is Synthetic boar × (Large White × Landrace) sow. Phenotypic data were available for 160 pigs, 80 males and 80 females, coming from 21 litters. All pigs were kept under commercial conditions at the experimental facilities of Schothorst Feed Research B.V. Before the start of the study, pigs were housed per litter, with 22.5% of the pigs being cross‐fostered, and all pigs were fed the same diet. The pigs entered the study at 59–67 days of age (day 0), in two groups of 80, and experimental groups were set 20 days apart. Ten pigs were housed per pen and eight pens per compartment. One compartment was used per entrance date. Littermates were randomly distributed over the two diets and males and females were housed in separate pens, resulting in two pens per diet per sex per entrance date. At the start of the experiment, the pigs had an average BW of 22.3 kg and were kept in the facilities until they reached a live weight at slaughter of approximately 120 kg (mean age 168 days). Pigs were allowed a minimal space of 1 m2 per pig, and the pens had a concrete floor for 60% and a slatted floor for 40%.
2.2. Feeding strategy
Two diets were studied, a diet based on corn/soybean meal (CS) as typically fed to commercial grower‐finisher pigs and pig breeding herds in The Americas and a more fibrous diet based on wheat/barley/by‐products (WB) as typically fed to pigs in Europe. The pigs were fed ad libitum according to a three‐phase feeding program. The pigs were fed a starter diet from day 0 to day 25, a grower diet from day 26 to day 67 and a finisher diet from day 68 until they reached slaughter weight. The diets were formulated on a fixed ratio of standardized ileal (SID) lysine to net energy (NE). Diets in each of the three phases had a different SID lysine to NE ratio, being 1.12 g/MJ in the starter diet, 0.94 g/MJ in the grower diet and 0.73 g/MJ in the finisher diet. The decrease of SID lysine‐to‐NE ratio in grower and finisher diets was mainly achieved by exchanging soybean meal with corn for the CS diet, and peas with wheat for the WB diets. A premix was added to the finisher diet; this premix contained titanium dioxide as digestibility marker (0.25% at the level of the diets). The experimental diets were produced by ABZ Diervoeding, Leusden, The Netherlands.
2.3. Measurements and sampling
The experimental facilities (Schothorst Feed Research B.V.) were equipped with IVOG feeding stations (INSENTEC) that register individual feed intake of group housed pigs. All pigs had ear tags with unique incremental numbering; therefore, individual feed intake records were available for all pigs for each day on test. Pigs were weighted at day 0, day 56 and at the end of the study. One day before slaughter, individual faecal grab samples were collected immediately at defecation. Faecal samples destined for microbiota analysis were collected of 142 out of 160 pigs, due to death (6) and insufficient sample volume (12), immediately frozen in liquid nitrogen and stored at −80°C. Due to sample volume needed for the chemical analyses, faecal samples destined for nutrient analysis for digestibility determination were collected of 105 pigs, stored at 4°C and freeze‐dried, and dry samples were milled over a 1 mm sieve prior to chemical analyses. Diets and faecal samples were analysed in duplicate for moisture, ash, starch, crude protein, crude fat (CFat), crude fibre (CF) and titanium oxide marker using the following methods: ISO 6496, NEN 3329, NEN‐ISO 15914:2005 en, ISO/CD 15670, ISO/FDIS 6492 method B, ISO‐6865:2001 and EEG 26‐11‐1992 nr.L344/35‐37 (method based on Short, Gorton, Wiseman, and Boorman (1996)), respectively. Dry matter (DM) (g/kg as is) was calculated as
Organic matter (OM) (g/kg DM) was calculated as
and the non‐starch polysaccharides (NSP) fraction (g/kg DM) was calculated as
Faecal nutrient digestibility values were calculated in percentages based on concentrations of the marker and the nutrient in the diet and faeces as
2.4. Faecal microbiota analysis
For each sample, the faecal microbiome was profiled by sequencing the 16S hypervariable region of bacteria. For microbial DNA extraction, a standardized protocol was used and an optical density measurement to check the quality was performed on the Nanodrop (Agilent Technologies). PCR was used to amplify the 16S rDNA V3/V4 fragment using forward primer V3_F (CCTACGGGAGGCAGCAG) and reverse primer V4_R (GGACTACHVGGGTWTCT). Whereby the following PCR conditions were used: 2 min at 98°C, 15 × (10 s at 98°C, 30 s at 55°C, 10 s at 72°C), 7 min at 72°C. PCR efficiency was checked on agarose gel by visual inspection. Subsequently samples were sequenced by targeted‐amplicon 16S sequencing using the MiSeq sequencer (Illumina) and analysed for taxonomy profile per sample with clustering by profile using the open‐source software pipeline QIIME (Caporaso et al., 2010). Standard assembly based on amplicon with primer removal was performed. For quality filtration of the sequences, the following settings were used: (a) Phred >Q20 and (b) amplicons >100 bases. For the data analysis, pseudoreads were clustered into OTUs per sample at 97% similarity and chimeras were removed with Chimeraslayer (Haas et al., 2011). To get taxonomic information, sequences representative for every OTU were aligned against the Greengenes core set (13_8 release) (DeSantis et al., 2006; McDonald et al., 2012).
To investigate the difference in microbiota biodiversity of the faecal samples between the diets, sexes and litters (after cross‐fostering), we calculated the Shannon diversity index and the Chao richness index based on the OTU count data for each sample using R package “vegan” (Oksanen et al., 2017). Significance of differences in the diversity estimates between the diets, sexes and litters was determined using a linear model with diet, sex and litter modelled as fixed effects. The R package “car” (Fox & Weisberg, 2011) was used for estimating the p‐values, and least‐squares means were computed using the R package “lsmeans” (Lenth, 2016). The dissimilarity between the samples in their microbiota composition was investigated by calculating the Bray–Curtis distances based on OTU count data using R package “vegan” (Oksanen et al., 2017). The same R package was used to test for significance of differences in Bray–Curtis distances between diets, sexes and litters, by means of a permutational multivariate analysis of variance using distance matrices (ADONIS) with a maximum of 999 permutations (Oksanen et al., 2017). All previously described analyses were based on the entire OTU count data. For the following steps, relative abundance of OTUs was calculated and OTUs with average relative abundance smaller than 0.001% and present in <5% of the animals were discarded. The OTU table of relative abundance was analysed by discriminant analysis using principal components (DAPC) (Jombart, Devillard, & Balloux, 2010), to test the association of OTU relative abundance with diet, sex and litter, as described previously (Verschuren et al., 2018).
2.5. Phenotypic prediction using microbiota data
Nutrient digestibility was predicted based on microbial relationship matrices (Ross et al., 2013). This approach uses a model commonly used in breeding and genetics to predict breeding values based on pedigree or genomic relationships. In short, the metagenomic profiles (matrix X [n × m]), with n samples and m OTUs, were defined based on the relative abundance of OTUs. Considering relative abundance RAij for sample i and taxonomic unit j, (Ross et al., 2013). Subsequently, a metagenomic relation matrix was computed based on these metagenomic profiles as M = XX′/m.
The following mixed model was used for the estimation of the microbiability and the proportion of the variance explained by the common litter effect:
| (1) |
where y is the vector of phenotypes (one record per sample), X is the incidence matrix for the fixed effects for sex, diet and pen, b are the fixed effects, Z the incidence matrix for OTU effects, m the random effect estimate of OTU ~ N (0, M ), U the incidence matrix for common litter effect (foster dam in case of cross‐fostering), c the random effect estimate of common litter ~ N (0, I ), and e the random residuals estimate ~ N (0, I ). ASReml (Gilmour, Gogel, Cullis, Welham, & Thompson, 2015) was used to simultaneously estimate , , and from the following equation:
Solving the equations results in estimates for the fixed effects () as well as the effect for each metagenomic profile, such that has the dimensions n × 1. The microbiability was computed as (Difford et al., 2016) and the proportion of variance due to common litter effect as . To investigate whether effects on digestibility of metagenomic profiles and common litter were related, the model was additionally put to run including only the metagenomic profiles:
| (2) |
or only common litter:
| (3) |
where y, X, b, Z, m, U, c and e are as described for model 1. Significance of each of the random effects was tested by means of the log‐likelihood ratio test, using the test statistic , where L 2 is the likelihood of the model including a specific random effect and L 1 the likelihood of the model excluding this random effect, as provided by ASReml (Gilmour et al., 2015). This means that model 1 was compared with model 2 to test the significance of the common litter effect, and with model 3 to test the significance of the random effect of the metagenomic profiles. Likewise, both models 2 and 3 were compared to model 4 that included no random effect:
| (4) |
where y, X, b and e are as described for model 1. The distribution of the D test statistics is a mixture of two chi‐square distributions with 0 and 1 degrees of freedom (Self & Liang, 1987). Considering this, the D test statistics were used to calculate p‐values, where values <.05 were considered to be significant.
To assess the accuracy of the metagenomic predictions, the residuals from the above specified model 3 were used as precorrected phenotypes y* (corrected for fixed effects sex, diet and pen, and for the random common litter effects) in combination with leave‐one‐out cross‐validation. In each of the validation folds, the precorrected phenotype of one of the individuals was removed, and predicted using the remaining individuals. In this way, a metagenomic prediction for each of the individuals was obtained, based on the digestibility values of all other animals in the data and all metagenomic profiles. The model used for the leave‐one‐out cross‐validation was
| (5) |
where 1 n is a vector of ones; μ is the overall mean; Z, m and e are as described in model 1; and for each individual, the predicted precorrected phenotype obtained from model (5) is: The accuracy of the predictions was obtained by computing the correlation between observed precorrected phenotypes y* and metagenomic predictions of the nutrient digestibility values obtained from model (5). In addition, y* was regressed on to evaluate bias of the predictions. Whether or not the accuracy was significantly different from 0 was assessed by obtaining the distribution of the accuracy using 10,000 bootstrap samples to recompute the accuracy.
3. RESULTS
An overview of the faecal microbiota composition per diet and sex is given in Figure 1, and an overview per litter is provided in Figure 2. The considerable differences in faecal microbiota composition between diets, sexes and litters shown in Figure 1 and 2 were also visible in the microbial biodiversity indicators (Table 1). The Shannon diversity index was significantly higher for the pigs fed the CS diet and lowest for boars, whereas the Chao richness index was not significantly different between diets and sexes. Shannon diversity index and the Chao richness index indicated significant differences between litters. The Bray–Curtis distances indicated that the microbiota composition of samples was significantly different for diets (p = .001), sexes (p = .001) and litters (p = .001). The faecal microbiota composition, measured in relative abundance, was significantly associated with diet and sex (p = .011) when using two discriminators and 15 principle components describing 83% of the variation in microbiota composition (Figure 3). The DAPC analysis could also distinguish five litters from the other 21 litters (p < .05) based on the faecal microbiota composition when using three discriminators and 30 principle components, which captured 92% of the variation. The biodiversity and microbiota composition analyses indicate that the faecal microbiota was influenced by diet, sex and litter.
Figure 1.
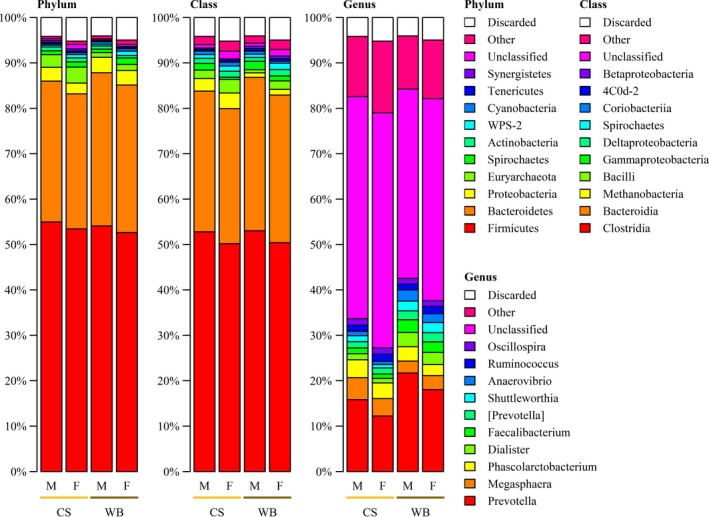
Relative abundance of 10 major bacterial phyla, classes and genera in the faeces of male (M) and female (F) pigs fed a corn/soybean meal diet (CS) or a wheat/barley/by‐products diet (WB). Data are mean percentage of total identified sequences
Figure 2.
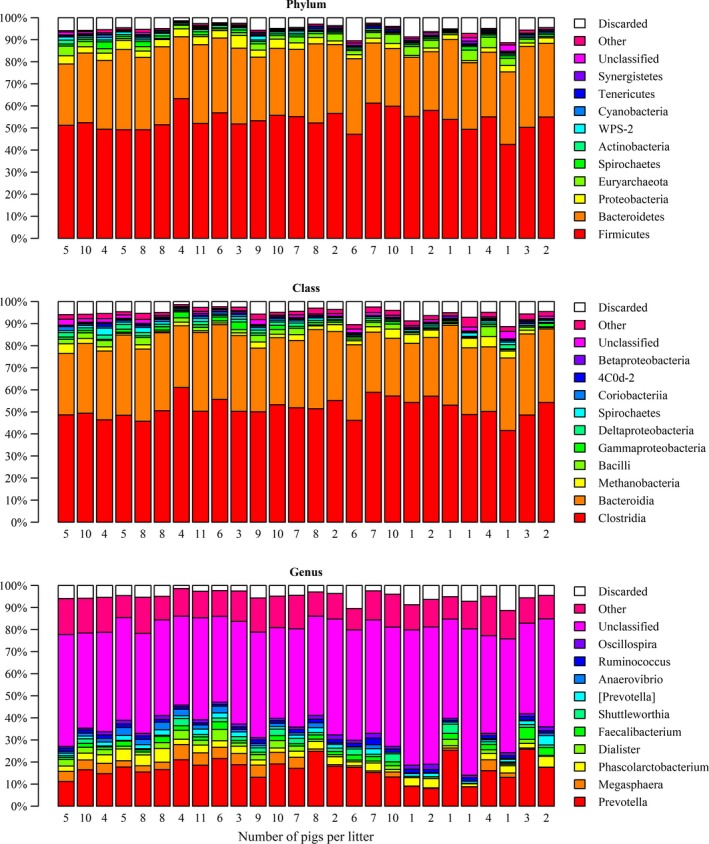
Relative abundance of 10 major bacterial phyla, classes and genera in the faeces of pigs raised in a common litter (after cross‐fostering). Data are mean percentage of total identified sequences, and every bar represents the means of one litter
Table 1.
Overview of faecal microbial biodiversity across animals per experimental diet and sex
| Index | Diet | Sex | Litter | ||||
|---|---|---|---|---|---|---|---|
| CSa | WBa | p‐Value | Boarsa | Giltsa | p‐Value | p‐Value | |
| Shannon diversity | 5.99 | 5.84 | .015 | 5.82 | 6.01 | .002 | .001 |
| Chao richness | 19,925 | 19,098 | .447 | 18,587 | 20,436 | .085 | <.001 |
Abbreviations: CS, corn/soybean meal diet; WB, wheat/barley/by‐products diet.
Values are least squares means.
Figure 3.
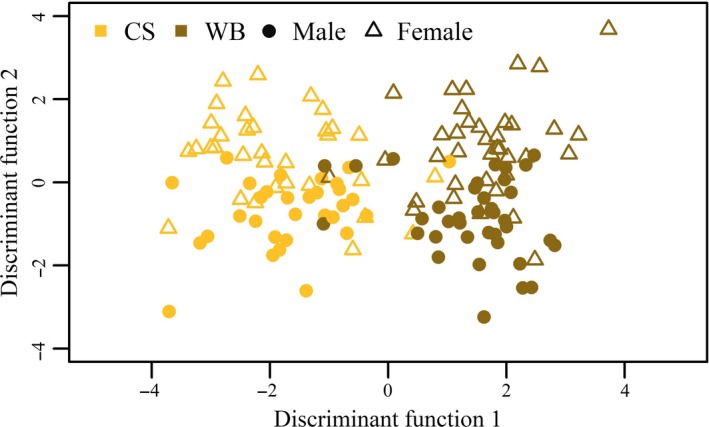
Gaussian kernel density estimation of the discriminant function as result of the discriminant analysis of principle components for male (circle) and female (triangle) pigs fed a corn/soybean meal diet (yellow) or a wheat/barley/by‐products diet (brown)
Average faecal nutrient digestibility values ranged from 25.7% for NSP of boars fed the CS diet to 88.3% for OM of gilts fed the CS diet (Table 2). Variation in faecal nutrient digestibility between pigs was lowest for OM of gilts fed the CS diet (SD = 1.1%), whereas CF of boars fed the WB diet had the highest variation (SD = 8.7%). p‐values of the fixed effects sex, diet and pen in all three of the models are presented in Table 3. Diet significantly influenced the faecal digestibility values of all nutrients in all models, whereas pen did not affect digestibility values of any of the nutrients in any of the models. In all models, sex significantly influenced faecal nutrient digestibility values of DM, OM, CP and CF. Sex did not affect faecal nutrient digestibility values of CFat and Ash in any of the three models, and for NSP, the effect of sex in the model tended to be significant.
Table 2.
Overview of (variation in) faecal nutrient digestibility (%) across animals per experimental diet and sex
| Nutrient | Corn/soybean meal diet | Wheat/barley/by‐products diet | ||||||||||
|---|---|---|---|---|---|---|---|---|---|---|---|---|
| Boars | Gilts | Boars | Gilts | |||||||||
| μ | σ | # | μ | σ | # | μ | σ | # | μ | σ | # | |
| Dry matter | 86.8 | 1.3 | 20 | 87.4 | 1.2 | 29 | 73.3 | 2.3 | 25 | 75.4 | 1.9 | 31 |
| Ash | 58.6 | 3.3 | 20 | 56.8 | 3.0 | 29 | 42.3 | 3.0 | 24 | 43.0 | 3.0 | 31 |
| Organic matter | 87.6 | 1.4 | 20 | 88.3 | 1.1 | 29 | 74.4 | 2.5 | 24 | 76.5 | 2.0 | 31 |
| Crude protein | 80.4 | 3.2 | 20 | 81.8 | 2.1 | 29 | 67.1 | 3.1 | 25 | 69.7 | 3.4 | 31 |
| Crude fat | 81.3 | 1.7 | 19 | 80.9 | 2.0 | 29 | 76.4 | 2.3 | 24 | 77.0 | 1.9 | 31 |
| Crude fibre | 49.9 | 5.5 | 20 | 54.4 | 5.9 | 29 | 29.4 | 8.7 | 25 | 38.2 | 6.6 | 31 |
| NSP | 25.7 | 8.0 | 19 | 29.3 | 7.6 | 29 | 41.3 | 6.3 | 24 | 46.7 | 4.8 | 31 |
Abbreviations: #, number of records; μ, average; NSP, non‐starch polysaccharides; σ, standard deviation.
Table 3.
p‐Values for the effect of sex, diet and pen on faecal nutrient digestibility with a model including microbiability and common litter effect (m 2 + c 2), and the models only including microbiability (m 2) or common litter effect (c 2)
| Nutrient | m 2 + c 2 | m 2 | c 2 | ||||||
|---|---|---|---|---|---|---|---|---|---|
| Sex | Diet | Pen | Sex | Diet | Pen | Sex | Diet | Pen | |
| Dry matter | .001 | <.001 | .194 | .001 | <.001 | .193 | <.001 | <.001 | .576 |
| Ash | .642 | <.001 | .280 | .713 | <.001 | .247 | .825 | <.001 | .281 |
| Organic matter | .002 | <.001 | .285 | .002 | <.001 | .285 | <.001 | <.001 | .762 |
| Crude protein | .003 | <.001 | .435 | .003 | <.001 | .435 | <.001 | <.001 | .817 |
| Crude fat | .331 | <.001 | .268 | .262 | <.001 | .157 | .572 | <.001 | .357 |
| Crude fibre | <.001 | <.001 | .251 | <.001 | <.001 | .251 | <.001 | <.001 | .474 |
| NSP | .054 | <.001 | .241 | .054 | <.001 | .241 | .004 | <.001 | .254 |
p‐Values below .05 indicate significant effect.
Abbreviation: NSP, non‐starch polysaccharides.
The estimates of m 2 and c 2 of all three models are presented in Table 4. When using the model including both microbiota and common litter information (model 1), m 2 ranged from 0.013 for ash to 0.932 for CP. However, the SE of the m 2 estimate of ash was higher than the m 2 estimate itself and was not significantly different from zero (p = .438). For CFat, the SE (0.24) was also high compared to m 2 (0.37). Using the same model including both microbiota and common litter information (model 1), c 2 estimates were zero for all of the nutrients except for CFat and CF, which had estimates of 0.12 and 0.02, respectively, and were not significantly different from zero. Comparing the results of the model including both metagenomic profile and common litter (model 1) with those of the models including only one of the information sources (model 2 and 3) did not change the overall result. Therefore, in this data set, there was no evidence that faecal nutrient digestibility of litter mates was similar due to encountering a common environment in their early life, including being nursed by the same sow. In contrast, the m 2 estimates of DM, OM, CP, CF and NSP were clearly significantly greater than zero, showing that the faecal microbiota composition is highly associated with the digestibility of these nutrients. The maximum individual OTU contribution to the estimated m 2 of faecal CP digestibility was 1.08% and the top 25 OTUs contributed 10% altogether (Table 5). All individual OTU contributions to the prediction of faecal nutrient digestibility values are provided in Table S1.
Table 4.
Microbiability (m 2) and common environmental effect (c 2) for faecal nutrient digestibility estimated by a model combining the effects (m 2 + c 2), and models only including microbiability (m 2) or common litter effect (c 2)
| Nutrient | m 2 + c 2 | m 2 | c 2 | |||||||||
|---|---|---|---|---|---|---|---|---|---|---|---|---|
| m 2 | SE | p‐Value | c 2 | SE | p‐Value | m 2 | SE | p‐Value | c 2 | SE | p‐Value | |
| Dry matter | 0.588 | 0.191 | <.001 | 0.000 | 0.000 | .494 | 0.588 | 0.191 | <.001 | 0.039 | 0.088 | .302 |
| Ash | 0.013 | 0.100 | .438 | 0.022 | 0.090 | .400 | 0.015 | 0.100 | .429 | 0.022 | 0.090 | .394 |
| Organic matter | 0.581 | 0.189 | <.001 | 0.000 | 0.000 | .500 | 0.581 | 0.189 | <.001 | 0.042 | 0.088 | .288 |
| Crude protein | 0.932 | 0.103 | <.001 | 0.000 | 0.000 | .500 | 0.932 | 0.103 | <.001 | 0.053 | 0.093 | .251 |
| Crude fat | 0.374 | 0.237 | .012 | 0.123 | 0.116 | .121 | 0.525 | 0.242 | .007 | 0.187 | 0.131 | .063 |
| Crude fibre | 0.653 | 0.191 | <.001 | 0.000 | 0.000 | .500 | 0.653 | 0.191 | <.001 | 0.022 | 0.083 | .383 |
| NSP1 | 0.664 | 0.198 | <.001 | 0.000 | 0.000 | .500 | 0.664 | 0.198 | <.001 | 0.008 | 0.085 | .460 |
Abbreviations: NSP, non‐starch polysaccharides; SE, standard error.
Table 5.
Taxonomic classification of individual operational taxonomic units (OTU) and their contribution (%) to the microbiability prediction of faecal crude protein digestibility
| out | Phylum | Class | Family | Genera | Contribution |
|---|---|---|---|---|---|
| OTU843086 | Bacteroidetes | Bacteroidia | [Paraprevotellaceae] | [Prevotella] | 1.08 |
| OTU130147 | Bacteroidetes | Bacteroidia | [Paraprevotellaceae] | [Prevotella] | 0.94 |
| OTU781124 | Bacteroidetes | Bacteroidia | [Paraprevotellaceae] | [Prevotella] | 0.85 |
| OTU753291 | Bacteroidetes | Bacteroidia | [Paraprevotellaceae] | [Prevotella] | 0.52 |
| OTU424454 | Bacteroidetes | Bacteroidia | [Paraprevotellaceae] | [Prevotella] | 0.49 |
| OTU259796 | Firmicutes | Clostridia | Ruminococcaceae | Unclassified | 0.45 |
| OTU773242 | Spirochaetes | Spirochaetes | Spirochaetaceae | Treponema | 0.42 |
| OTU234811 | Bacteroidetes | Bacteroidia | [Paraprevotellaceae] | [Prevotella] | 0.42 |
| OTU503912 | Firmicutes | Clostridia | Ruminococcaceae | Unclassified | 0.37 |
| OTU192454 | Firmicutes | Erysipelotrichi | Erysipelotrichaceae | RFN20 | 0.32 |
| OTU833234 | Firmicutes | Clostridia | Lachnospiraceae | Unclassified | 0.32 |
| OTU642390 | Firmicutes | Clostridia | Ruminococcaceae | Unclassified | 0.31 |
| OTU102918 | Firmicutes | Erysipelotrichi | Erysipelotrichaceae | RFN20 | 0.31 |
| OTU492945 | Firmicutes | Clostridia | Christensenellaceae | Unclassified | 0.29 |
| OTU208623 | Firmicutes | Clostridia | Ruminococcaceae | Unclassified | 0.29 |
| OTU81638 | Firmicutes | Clostridia | Ruminococcaceae | Unclassified | 0.28 |
| OTU822258 | Firmicutes | Clostridia | Unclassified | Unclassified | 0.28 |
| OTU276792 | Bacteroidetes | Bacteroidia | S24‐7 | Unclassified | 0.28 |
| OTU780633 | Firmicutes | Clostridia | Veillonellaceae | Unclassified | 0.27 |
| OTU162484 | Bacteroidetes | Bacteroidia | S24‐7 | Unclassified | 0.27 |
| OTU694133 | Bacteroidetes | Bacteroidia | [Paraprevotellaceae] | [Prevotella] | 0.27 |
| OTU463875 | Firmicutes | Erysipelotrichi | Erysipelotrichaceae | Unclassified | 0.26 |
| OTU151918 | Tenericutes | Mollicutes | Unclassified | Unclassified | 0.25 |
| OTU438107 | Firmicutes | Clostridia | Veillonellaceae | Dialister | 0.25 |
| OTU259950 | Firmicutes | Clostridia | Ruminococcaceae | Unclassified | 0.25 |
The results of the predictions of faecal nutrient digestibility based on faecal metagenomic profiles are presented in Table 6. The prediction generated accuracies up to 0.63 for CP. Based on the 95% confidence interval, the prediction accuracy of ash and CFat was not significantly different from zero. Despite the apparent significance of the m 2 for CFat (p = .012), both the standard error of the estimate and the accuracy of prediction suggest that variation in digestibility of CFat is hardly related to variation in faecal microbiota composition. The accuracies of prediction for faecal digestibility of all other nutrients (DM, OM, CF and NSP) ranged between 0.3 and 0.5 and were significantly different from zero. The intercepts of the regression of observed on predicted digestibilities for DM, OM, CP, CF and NSP were all close to zero, while the regression coefficients were close to one, indicating that the predicted values were unbiased.
Table 6.
Leave‐one‐out cross‐validation results for predicted faecal nutrient digestibility
| Nutrient | Accuracy | L‐CI | U‐CI | Intercept | Slope |
|---|---|---|---|---|---|
| Dry matter | 0.42 | 0.28 | 0.55 | 0.00 | 1.06 |
| Ash | −0.76 | −0.99 | −0.68 | 0.04 | −38 |
| Organic matter | 0.43 | 0.29 | 0.56 | 0.00 | 1.08 |
| Crude protein | 0.63 | 0.52 | 0.72 | 0.01 | 1.04 |
| Crude fat | 0.01 | −0.15 | 0.18 | 0.00 | 0.07 |
| Crude fibre | 0.42 | 0.29 | 0.55 | −0.01 | 1.04 |
| NSP | 0.43 | 0.31 | 0.55 | −0.03 | 1.06 |
Abbreviations: Accuracy, accuracy of prediction; Intercept, intercept of the regression of observed on predicted digestibility; L‐CI, lower bound of the confidence interval; NSP, non‐starch polysaccharide; Slope, slope of the regression of observed on predicted digestibility values; U‐CL, upper bound of the confidence interval.
4. DISCUSSION
4.1. Metagenomics
This study investigated the use of metagenomics to identify the proportion of variance in faecal nutrient digestibility values associated with faecal microbiota composition in pigs. Faecal microbiota composition and diversity was affected by diet, sex and litter, whereas faecal nutrient digestibility was affected by diet and sex, but not by litter. Despite the effects of diet, sex and litter, we found that the faecal digestibility of DM, OM, CP, CF and NSP in grower‐finisher pigs is associated with faecal microbiota composition, whereas no such association was observed for ash and CFat digestibility. Camarinha‐Silva et al. (2017) were the first to estimate microbiability for complex traits in pigs and found values of 0.28, 0.16 and 0.21 for average daily gain, feed intake and feed conversion rate respectively, which are lower than our m 2 estimates for faecal nutrient digestibility. Previous research found both positive and negative correlations between relative abundance of individual OTU and faecal digestibility of energy, CP and cell wall components as well, but only when pigs were fed a low fibre diet (Le Sciellour et al., 2018). The strongest correlation, between faecal digestibility of CP and an OTU classified as Clostridium, was ‐0.45 (Le Sciellour et al., 2018). A correlation of ‐0.45 suggests that the proportion of variance explained by this single OTU was 0.20, whereas we found a microbiability of 0.93 for CP. Niu et al. (2015) did not find a correlation between specific microbiota (phyla or genera) and faecal digestibility of CP in pigs. They did find a significant correlation with faecal digestibility of CF, NDF, ADF and hemicellulose, however, with the highest correlations being 0.61, 0.55, 0.65 and 0.45, respectively (Niu et al., 2015). These correlations correspond with explained proportions of variances of 0.20–0.37, which are lower but in the same order of magnitude as our estimates of microbiability for CF (0.65) and NSP (0.66). Our estimated contributions of individual OTU to the predictions are low, with the most important OTU contributing only 1.08% to m 2 of faecal CP digestibility. We used OTUs instead of a taxonomic rank for our predictions, which provided us with more information on the whole faecal microbial community, however, at the cost of taxonomic and functionality knowledge. Nevertheless, the OTUs contributing most to the m 2 of faecal CP digestibility belonged to the genus Prevotella, which was one of the most abundant genera in our samples. The limited power to estimate individual OTU effects was due to the size of the dataset. This limitation was overcome by including all microbiota simultaneously in the model, where modelling a variance component for microbiota implied that estimates of individual OTU effects were subject to shrinkage. Therefore, the lower association between faecal microbiota composition and faecal nutrient digestibility in literature compared to the relatively high microbiability values found in our study are likely due to the focus on specific microbiota compared to our focus on the whole community.
Pigs originating from the same litter may have similar performance both due to being genetically related and due to sharing a common environment during part of their life. This common environmental effect was modelled as a common litter effect. We found no effect of common litter on faecal digestibility of any of the nutrients. Ouweltjes et al. (2018) showed that common litter contributes up to 7.8% of the phenotypic variance of faecal digestibility of nutrients. The common litter effects measured in our study, although not significantly different from zero, are in the same order of magnitude. Arguably, common litter effects can be due to factors affecting gastrointestinal development during both the pre‐ and postnatal period, which might influence faecal digestibility of nutrients later in life. Before parturition, the intrauterine environment affects the growth and development of the gastrointestinal tract (Sangild, Fowden, & Trahair, 2000). After birth, the colostrum and milk composition greatly shape the growth, development and functioning of the gastrointestinal tract (Pluske, 2016). Microbiota affect intestinal functioning and development after parturition as well, as early life microbial colonization in pigs modulate the intestinal immune system (Weng & Walker, 2013), morphology, digestive enzyme activity (Arnal et al., 2014) and gene expression (Schokker et al., 2015) at later ages. Even though early life colonization in pigs is affected by the biological dam (Baker, Davis, Spencer, Moser, & Rehberger, 2013; Buddington, Williams, Kostek, Buddington, & Kullen, 2010; Paßlack, Vahjen, & Zentek, 2015), cross‐fostering experiments show that environment, including diet, is the most important factor (Bian et al., 2016; Thompson, Wang, & Holmes, 2008). In our study, the faecal microbial diversity and composition of grower‐finisher pigs later in life varied across litters, which may be due to similar early‐life colonization of littermates. Hence, if a common litter effect on faecal nutrient digestibility exists, postnatal common environment is likely more important than prenatal common environment. As common litter effects presented in literature are small (Ouweltjes et al., 2018) and we did not find evidence for a common litter effect on faecal digestibility of nutrients in our study, further studies are required to quantify and understand common litter effects on faecal digestibility of nutrients.
4.2. Prediction accuracies
Next to estimating the proportion of variance explained, this study also investigated the use of metagenomics to identify the accuracy of prediction of faecal nutrient digestibility values. We found that variation in faecal microbiota composition can be used to predict faecal digestibility of CP, DM, OM, CF and NSP and establish a rank among pigs that is useful for breeding purposes. The accuracy of prediction, however, is too low to reliably replace the golden standard in nutrition research for the determination of faecal nutrient digestibility via chemical analysis of faeces. In our case, the training data for the predictions in the leave‐one‐out cross‐validation contained only 105 animals with one observed value each. Increasing the size of the training data will inevitably lead to an increase in prediction accuracy, albeit that the increase in accuracy will be subject to diminishing returns. In fact, the maximum prediction accuracy is expected to be equal to , similar to the maximum accuracy of predicting phenotypes based on estimated breeding values is expected to be (Legarra, Robert‐Granié, Manfredi, & Elsen, 2008). This suggests that increasing the training data could lead to maximum expected prediction accuracies as high as 0.97 for CP, and 0.76 to 0.81 for CF, DM, OM and NSP. The prediction accuracy likely could also further be increased by using a dataset with more variation. The between‐diet variation in faecal nutrient digestibility values was larger than the within‐diet variation, which is in line with the conclusion of Ouweltjes et al. (2018) that diet is the most important factor explaining phenotypic variance in faecal nutrient digestibility. Especially, diets including different levels and sources of high fibre ingredients show large variation between diets in faecal digestibility of several nutrients beside fibre itself (Navarro, Bruininx, de Jong, & Stein, 2019). In addition, fibre inclusion level and composition have a pronounced effect on faecal microbiota composition (Castillo, Martín‐Orúe, Anguita, Pérez, & Gasa, 2007; Chen et al., 2014) but so does crude protein level (Fan, Liu, Song, Chen, & Ma, 2017; Zhou, Fang, Sun, Su, & Zhu, 2016). Diet composition had a pronounced effect on faecal microbiota composition in our study as well. Thus, the prediction accuracy of the model is expected to increase if the dataset is expanded by including faecal nutrient digestibility values and faecal microbiota composition of pigs fed diets of different nutrient composition and ingredient sources.
4.3. Implications
We showed that faecal nutrient digestibility can be predicted based on variation in microbiota composition. Several studies investigated differences in faecal digestibility of nutrients between pig breeds and only found differences when the pigs were fed a low fibrous diet (Kemp, Den Hartog, Klok, & Zandstra, 1991; Le Sciellour et al., 2018; Urriola & Stein, 2012; Zhao et al., 2018). Within‐breed genetic variation also appears to exist, as considerable sire effects on faecal digestibility of DM, OM, N and energy have been estimated (Noblet, Gilbert, Jaguelin‐Peyraud, & Lebrun, 2013). The ultimate goal is to disentangle the interplay between host genetics, microbiota genetics and faecal nutrient digestibility, using genomic and metagenomic information simultaneously, which requires a larger dataset than we used in the present study. With the models presented in our study, however, individual pigs’ faecal DM, OM, CP, CF and NSP digestibility can be predicted based on faecal microbiota composition. These predictions can then subsequently be used as phenotypes in genetic or genomic selection.
5. CONCLUSION
We obtained high microbiability values for faecal digestibility of DM, OM, CP, CF and NSP, which shows that variation in faecal nutrient digestibility is strongly associated with variation in faecal microbiota composition. The accuracies of predicting individual faecal digestibility of nutrients based on faecal microbiota composition were too low if the interest is in substituting the golden standard for measuring individual nutrient digestibility. From the perspective of ranking animals in a genetic or genomic selection context, however, the accuracies of prediction are promising. In conclusion, metagenomics applied on faecal samples can possibly be used to predict faecal digestibility of DM, OM, CP, CF and NSP, and the predictions can subsequently be used as phenotypes in genetic or genomic selection.
CONFLICT OF INTEREST
The authors declare that there is no conflict of interest regarding the publication of this article.
6.
Supporting information
ACKNOWLEDGEMENTS
This study was financially supported by the Dutch Ministry of Economic Affairs (TKI Agri & Food project 12039; Public–private partnership “Breed&Feed4Food” code BO‐22.04‐010‐001). We also thank Schothorst Feed Research and the Breed4Food partner Topigs Norsvin for providing data.
Verschuren LMG, Schokker D, Bergsma R, Jansman AJM, Molist F, Calus MPL. Prediction of nutrient digestibility in grower‐finisher pigs based on faecal microbiota composition. J Anim Breed Genet. 2020;137:23–35. 10.1111/jbg.12433
DATA AVAILABILITY STATEMENT
The data that support the findings of this study are available from the corresponding author upon reasonable request.
REFERENCES
- Arnal, M.‐E. , Zhang, J. , Messori, S. , Bosi, P. , Smidt, H. , & Lallès, J.‐P. (2014). Early changes in microbial colonization selectively modulate intestinal enzymes, but not inducible heat shock proteins in young adult swine. PLoS ONE, 9(2), e87967 10.1371/journal.pone.0087967 [DOI] [PMC free article] [PubMed] [Google Scholar]
- Baker, A. A. , Davis, E. , Spencer, J. D. , Moser, R. , & Rehberger, T. (2013). The effect of a Bacillus‐based direct‐fed microbial supplemented to sows on the gastrointestinal microbiota of their neonatal piglets. Journal of animal science, 91(7), 3390–3399. 10.2527/jas.2012-5821 [DOI] [PubMed] [Google Scholar]
- Bian, G. , Ma, S. , Zhu, Z. , Su, Y. , Zoetendal, E. G. , Mackie, R. , & Smidt, H. (2016). Age, introduction of solid feed and weaning are more important determinants of gut bacterial succession in piglets than breed and nursing mother as revealed by a reciprocal cross‐fostering model. Environmental Microbiology, 18(5), 1566–1577. 10.1111/1462-2920.13272 [DOI] [PubMed] [Google Scholar]
- Buddington, R. K. , Williams, C. H. , Kostek, B. M. , Buddington, K. K. , & Kullen, M. J. (2010). Maternal‐to‐infant transmission of probiotics: Concept validation in mice, rats, and pigs. Neonatology, 97(3), 250–256. 10.1159/000253756 [DOI] [PubMed] [Google Scholar]
- Camarinha‐Silva, A. , Maushammer, M. , Wellmann, R. , Vital, M. , Preuss, S. , & Bennewitz, J. (2017). Host genome influence on gut microbial composition and microbial prediction of complex traits in pigs. Genetics, 1637–1644, 10.1534/genetics.117.200782 [DOI] [PMC free article] [PubMed] [Google Scholar]
- Caporaso, J. G. , Kuczynski, J. , Stombaugh, J. , Bittinger, K. , Bushman, F. D. , Costello, E. K. , & Gordon, J. I. (2010). QIIME allows analysis of high‐throughput community sequencing data. Nature methods, 7(5), 335–336. 10.1038/nmeth.f.303 [DOI] [PMC free article] [PubMed] [Google Scholar]
- Castillo, M. , Martín‐Orúe, S. M. , Anguita, M. , Pérez, J. F. , & Gasa, J. (2007). Adaptation of gut microbiota to corn physical structure and different types of dietary fibre. Livestock Science, 109(1), 149–152. 10.1016/j.livsci.2007.01.129 [DOI] [Google Scholar]
- Chen, H. , Mao, X. B. , Che, L. Q. , Yu, B. , He, J. , Yu, J. , & Chen, D. W. (2014). Impact of fiber types on gut microbiota, gut environment and gut function in fattening pigs. Animal feed science and technology, 195, 101–111. 10.1016/j.anifeedsci.2014.06.002 [DOI] [Google Scholar]
- DeSantis, T. Z. , Hugenholtz, P. , Larsen, N. , Rojas, M. , Brodie, E. L. , Keller, K. , & Andersen, G. L. (2006). Greengenes, a chimera‐checked 16S rRNA gene database and workbench compatible with ARB. Applied and environmental microbiology, 72(7), 5069–5072. 10.1128/AEM.03006-05 [DOI] [PMC free article] [PubMed] [Google Scholar]
- Difford, G. , Lassen, J. , & Lovendahl, P. (2016). Genes and microbes, the next step in dairy cattle breeding. Paper presented at the 67th Annual Meeting of the European Federation of Animal Science. [Google Scholar]
- Fan, P. , Liu, P. , Song, P. , Chen, X. , & Ma, X. (2017). Moderate dietary protein restriction alters the composition of gut microbiota and improves ileal barrier function in adult pig model. Scientific reports, 7, 43412 10.1038/srep43412 [DOI] [PMC free article] [PubMed] [Google Scholar]
- Fox, J. , & Weisberg, S. (2011). An R companion to applied regression (2nd ed.). Thousand Oaks, CA: SAGE Publications. [Google Scholar]
- Gilmour, A. R. , Gogel, B. J. , Cullis, B. R. , Welham, S. J. , & Thompson, R. (2015). ASReml user guide release 4.1 functional specification. Hemel Hempstead, UK: VSN International Ltd. [Google Scholar]
- Haas, B. J. , Gevers, D. , Earl, A. M. , Feldgarden, M. , Ward, D. V. , Giannoukos, G. , & Sodergren, E. (2011). Chimeric 16S rRNA sequence formation and detection in Sanger and 454‐pyrosequenced PCR amplicons. Genome research, 494–504, 10.1101/gr.112730.110 [DOI] [PMC free article] [PubMed] [Google Scholar]
- Handelsman, J. (2004). Metagenomics: Application of genomics to uncultured microorganisms. Microbiology and molecular biology reviews, 68(4), 669–685. 10.1128/MMBR.68.4.669-685.2004 [DOI] [PMC free article] [PubMed] [Google Scholar]
- Harris, A. , Patience, J. F. , Lonergan, S. M. , Dekkers, J. C. M. , & Gabler, N. K. (2012). Improved nutrient digestibility and retention partially explains feed efficiency gains in pigs selected for low residual feed intake. Journal of animal science, 90(Supplement_4), 164–166. 10.2527/jas.53855 [DOI] [PubMed] [Google Scholar]
- Horodyska, J. , Hamill, R. M. , Reyer, H. , Trakooljul, N. , Lawlor, P. G. , McCormack, U. M. , & Wimmers, K. (2019). RNA‐seq of liver from pigs divergent in feed efficiency highlights shifts in macronutrient metabolism, hepatic growth and immune response. Frontiers in Genetics, 10(117), 10.3389/fgene.2019.00117 [DOI] [PMC free article] [PubMed] [Google Scholar]
- Horodyska, J. , Oster, M. , Reyer, H. , Mullen, A. M. , Lawlor, P. G. , Wimmers, K. , & Hamill, R. M. (2018). Analysis of meat quality traits and gene expression profiling of pigs divergent in residual feed intake. Meat science, 137, 265–274. 10.1016/j.meatsci.2017.11.021 [DOI] [PubMed] [Google Scholar]
- Horodyska, J. , Reyer, H. , Wimmers, K. , Trakooljul, N. , Lawlor, P. G. , & Hamill, R. M. (2019). Transcriptome analysis of adipose tissue from pigs divergent in feed efficiency reveals alteration in gene networks related to adipose growth, lipid metabolism, extracellular matrix, and immune response. Molecular Genetics and Genomics, 294(2), 395–408. 10.1007/s00438-018-1515-5 [DOI] [PubMed] [Google Scholar]
- Jombart, T. , Devillard, S. , & Balloux, F. (2010). Discriminant analysis of principal components: A new method for the analysis of genetically structured populations. BMC Genetics, 11(1), 1 10.1186/1471-2156-11-94 [DOI] [PMC free article] [PubMed] [Google Scholar]
- Kemp, B. , Den Hartog, L. , Klok, J. , & Zandstra, T. (1991). The digestibility of nutrients, energy and nitrogen in the Meishan and Dutch Landrace pig. Journal of Animal Physiology and Animal Nutrition, 65, 263–266. 10.1111/j.1439-0396.1991.tb00265.x [DOI] [Google Scholar]
- Le Sciellour, M. , Labussière, E. , Zemb, O. , & Renaudeau, D. (2018). Effect of dietary fiber content on nutrient digestibility and fecal microbiota composition in growing‐finishing pigs. PLoS ONE, 13(10), e0206159 10.1371/journal.pone.0206159 [DOI] [PMC free article] [PubMed] [Google Scholar]
- Legarra, A. , Robert‐Granié, C. , Manfredi, E. , & Elsen, J.‐M. (2008). Performance of genomic selection in mice. Genetics, 180(1), 611–618. 10.1534/genetics.108.088575 [DOI] [PMC free article] [PubMed] [Google Scholar]
- Lenth, R. V. (2016). Least‐squares means: The R package lsmeans. Journal of Statistical Software, 69(1), 1–33. 10.18637/jss.v069.i01 [DOI] [Google Scholar]
- Mauch, E. D. , Young, J. M. , Serão, N. V. L. , Hsu, W. L. , Patience, J. F. , Kerr, B. J. , & Dekkers, J. C. M. (2018). Effect of lower‐energy, higher‐fiber diets on pigs divergently selected for residual feed intake when fed higher‐energy, lower‐fiber diets. Journal of animal science, 96(4), 1221–1236. 10.1093/jas/sky065 [DOI] [PMC free article] [PubMed] [Google Scholar]
- McDonald, D. , Price, M. N. , Goodrich, J. , Nawrocki, E. P. , DeSantis, T. Z. , Probst, A. , & Hugenholtz, P. (2012). An improved Greengenes taxonomy with explicit ranks for ecological and evolutionary analyses of bacteria and archaea. The ISME journal, 6(3), 610–618. 10.1038/ismej.2011.139 [DOI] [PMC free article] [PubMed] [Google Scholar]
- Navarro, D. M. D. L. , Bruininx, E. M. A. M. , de Jong, L. , & Stein, H. H. (2019). Effects of inclusion rate of high fiber dietary ingredients on apparent ileal, hindgut, and total tract digestibility of dry matter and nutrients in ingredients fed to growing pigs. Animal feed science and technology, 248, 1–9. 10.1016/j.anifeedsci.2018.12.001 [DOI] [Google Scholar]
- Niu, Q. , Li, P. , Hao, S. , Zhang, Y. , Kim, S. W. , Li, H. , & Wu, W. (2015). Dynamic distribution of the gut microbiota and the relationship with apparent crude fiber digestibility and growth stages in pigs. Scientific reports, 5, 9938 10.1038/srep09938 [DOI] [PMC free article] [PubMed] [Google Scholar]
- Noblet, J. , Gilbert, H. , Jaguelin‐Peyraud, Y. , & Lebrun, T. (2013). Evidence of genetic variability for digestive efficiency in the growing pig fed a fibrous diet. Animal, 7(08), 1259–1264. 10.1017/S1751731113000463 [DOI] [PubMed] [Google Scholar]
- Oksanen, J. , Blanchet, F. G. , Friendly, M. , Kindt, R. , Legendre, P. , Minchin, P. R. , & Wagner, H. (2017). vegan: Community ecology package (version R package version 2.4‐4). Retrieved from https://CRAN.R-project.org/package=vegan [Google Scholar]
- Ouweltjes, W. , Verschuren, L. M. G. , Pijlman, J. , Bergsma, R. , Schokker, D. , Knol, E. F. , & Calus, M. P. L. (2018). The repeatability of individual nutrient digestibility in pigs. Livestock Science, 207, 63–67. 10.1016/j.livsci.2017.11.013 [DOI] [Google Scholar]
- Paßlack, N. , Vahjen, W. , & Zentek, J. (2015). Dietary inulin affects the intestinal microbiota in sows and their suckling piglets. BMC veterinary research, 11(1), 51 10.1186/s12917-015-0351-7 [DOI] [PMC free article] [PubMed] [Google Scholar]
- Pluske, J. (2016). Invited review: Aspects of gastrointestinal tract growth and maturation in the pre‐and postweaning period of pigs. Journal of animal science, 94(Supplement_3), 399–411. 10.2527/jas2015-9767 [DOI] [Google Scholar]
- Ross, E. M. , Moate, P. J. , Marett, L. C. , Cocks, B. G. , & Hayes, B. J. (2013). Metagenomic predictions: From microbiome to complex health and environmental phenotypes in humans and cattle. PLoS ONE, 8(9), e73056 10.1371/journal.pone.0073056 [DOI] [PMC free article] [PubMed] [Google Scholar]
- Sangild, P. T. , Fowden, A. L. , & Trahair, J. F. (2000). How does the foetal gastrointestinal tract develop in preparation for enteral nutrition after birth? Livestock Production Science, 66(2), 141–150. 10.1016/S0301-6226(00)00221-9 [DOI] [Google Scholar]
- Schokker, D. , Zhang, J. , Vastenhouw, S. A. , Heilig, H. G. H. J. , Smidt, H. , Rebel, J. M. J. , & Smits, M. A. (2015). Long‐lasting effects of early‐life antibiotic treatment and routine animal handling on gut microbiota composition and immune system in pigs. PLoS ONE, 10(2), e0116523 10.1371/journal.pone.0116523 [DOI] [PMC free article] [PubMed] [Google Scholar]
- Self, S. G. , & Liang, K.‐Y. (1987). Asymptotic properties of maximum likelihood estimators and likelihood ratio tests under nonstandard conditions. Journal of the American Statistical Association, 82(398), 605–610. 10.1080/01621459.1987.10478472 [DOI] [Google Scholar]
- Shirali, M. , Varley, P. , & Jensen, J. (2017). Longitudinal genetic dissection of feed efficiency and feeding behaviour in MaxGro pigs. Livestock Science, 199, 79–85. 10.1016/j.livsci.2017.03.017 [DOI] [Google Scholar]
- Short, F. J. , Gorton, P. , Wiseman, J. , & Boorman, K. N. (1996). Determination of titanium dioxide added as an inert marker in chicken digestibility studies. Animal feed science and technology, 59(4), 215–221. 10.1016/0377-8401(95)00916-7 [DOI] [Google Scholar]
- Tan, Z. , Wang, Y. , Yang, T. , Ao, H. , Chen, S. , Xing, K. , & Wang, C. (2018). Differences in gut microbiota composition in finishing Landrace pigs with low and high feed conversion ratios. Antonie van Leeuwenhoek, 1–13, 10.1007/s10482-018-1057-1 [DOI] [PMC free article] [PubMed] [Google Scholar]
- Thompson, C. L. , Wang, B. , & Holmes, A. J. (2008). The immediate environment during postnatal development has long‐term impact on gut community structure in pigs. The ISME journal, 2(7), 739–748. 10.1038/ismej.2008.29 [DOI] [PubMed] [Google Scholar]
- Urriola, P. E. , & Stein, H. H. (2012). Comparative digestibility of energy and nutrients in fibrous feed ingredients fed to Meishan and Yorkshire pigs. Journal of animal science, 90(3), 802–812. 10.2527/jas.2010-3254 [DOI] [PubMed] [Google Scholar]
- Verschuren, L. M. G. , Calus, M. P. L. , Jansman, A. J. M. , Bergsma, R. , Knol, E. F. , Gilbert, H. , & Zemb, O. (2018). Fecal microbial composition associated with variation in feed efficiency in pigs depends on diet and sex. Journal of animal science, 96(4), 1405–1418. 10.1093/jas/sky060 [DOI] [PMC free article] [PubMed] [Google Scholar]
- Vigors, S. , O'Doherty, J. V. , Kelly, A. K. , O'Shea, C. J. , & Sweeney, T. (2016). The effect of divergence in feed efficiency on the intestinal microbiota and the intestinal immune response in both unchallenged and lipopolysaccharide challenged ileal and colonic explants. PLoS ONE, 11(2), e0148145 10.1371/journal.pone.0148145 [DOI] [PMC free article] [PubMed] [Google Scholar]
- Wen, C. , Yan, W. , Sun, C. , Ji, C. , Zhou, Q. , Zhang, D. , & Yang, N. (2019). The gut microbiota is largely independent of host genetics in regulating fat deposition in chickens. The ISME journal, 10.1038/s41396-019-0367-2 [DOI] [PMC free article] [PubMed] [Google Scholar]
- Weng, M. , & Walker, W. (2013). The role of gut microbiota in programming the immune phenotype. Journal of developmental origins of health disease, 4(3), 203–214. 10.1017/S2040174412000712 [DOI] [PMC free article] [PubMed] [Google Scholar]
- Yang, H. , Huang, X. , Fang, S. , He, M. , Zhao, Y. , Wu, Z. , & Huang, L. (2017). Unraveling the fecal microbiota and metagenomic functional capacity associated with feed efficiency in pigs. Frontiers in microbiology, 8, 1555 10.3389/fmicb.2017.01555 [DOI] [PMC free article] [PubMed] [Google Scholar]
- Zhao, J. , Wang, Q. , Liu, L. , Chen, Y. , Jin, A. , Liu, G. , & Lai, C. (2018). Comparative digestibility of nutrients and amino acids in high‐fiber diets fed to crossbred barrows of Duroc boars crossed with Berkshire× Jiaxing and Landrace× Yorkshire. Asian‐Australasian journal of animal sciences, 31(5), 721 10.5713/ajas.17.0344 [DOI] [PMC free article] [PubMed] [Google Scholar]
- Zhou, L. , Fang, L. , Sun, Y. , Su, Y. , & Zhu, W. (2016). Effects of the dietary protein level on the microbial composition and metabolomic profile in the hindgut of the pig. Anaerobe, 38, 61–69. 10.1016/j.anaerobe.2015.12.009 [DOI] [PubMed] [Google Scholar]
Associated Data
This section collects any data citations, data availability statements, or supplementary materials included in this article.
Supplementary Materials
Data Availability Statement
The data that support the findings of this study are available from the corresponding author upon reasonable request.