

Abstract
Objective
Chronic traumatic encephalopathy (CTE) is a neurodegenerative disease associated with exposure to contact and collision sports, including American football. We hypothesized a dose–response relationship between duration of football played and CTE risk and severity.
Methods
In a convenience sample of 266 deceased American football players from the Veterans Affairs–Boston University–Concussion Legacy Foundation and Framingham Heart Study Brain Banks, we estimated the association of years of football played with CTE pathological status and severity. We evaluated the ability of years played to classify CTE status using receiver operating characteristic curve analysis. Simulation analyses quantified conditions that might lead to selection bias.
Results
In total, 223 of 266 participants met neuropathological diagnostic criteria for CTE. More years of football played were associated with having CTE (odds ratio [OR] = 1.30 per year played, 95% confidence interval [CI] = 1.19–1.41; p = 3.8 × 10⁻⁹) and with CTE severity (severe vs mild; OR = 1.14 per year played, 95% CI = 1.07–1.22; p = 3.1 × 10⁻⁴). Participants with CTE were 1/10th as likely to have played <4.5 years (negative likelihood ratio [LR] = 0.102, 95% CI = 0.100–0.105) and were 10 times as likely to have played >14.5 years (positive LR = 10.2, 95% CI = 9.8–10.7) compared with participants without CTE. Sensitivity and specificity were maximized at 11 years played. Simulation demonstrated that years played remained adversely associated with CTE status when years played and CTE status were both related to brain bank selection across widely ranging scenarios.
Interpretation
The odds of CTE double every 2.6 years of football played. After accounting for brain bank selection, the magnitude of the relationship between years played and CTE status remained consistent. ANN NEUROL 2020;87:116–131
Chronic traumatic encephalopathy (CTE) is a neurodegenerative disease associated with exposure to contact and collision sports (CCS), including American football, boxing, association football (soccer), rugby, and ice hockey.1, 2, 3, 4, 5, 6 Like most neurodegenerative diseases, CTE only can be definitively diagnosed by postmortem neuropathologic examination. A National Institute of Neurological Disease and Stroke (NINDS)/National Institute of Biomedical Imaging and Bioengineering (NIBIB) panel defined the pathognomonic lesion of CTE as the perivascular accumulation of hyperphosphorylated tau (p‐tau) in neurons and astrocytes in an irregular pattern, most prominent at the depths of the cortical sulci.7 The panel concluded that CTE is a unique disease that can be reliably distinguished from other neurodegenerative diseases, including Alzheimer disease and frontotemporal lobar degeneration. In the examination of 68 CTE cases, McKee and colleagues proposed a CTE staging scheme of progressive p‐tau pathology consisting of 4 stages (stage IV being most severe).3 Clinically, impulsivity, explosivity, depression, memory impairment, and executive dysfunction most commonly occur in CTE,5, 8, 9 although validated in vivo diagnostic criteria do not currently exist.
Most CTE cases have been diagnosed in former amateur and professional CCS athletes, but also in military veterans with blast exposure and others who have suffered from traumatic brain injury.3, 4, 5, 10, 11 Among 66 men from the Mayo Clinic Brain Bank with documented CCS exposure and 198 age‐matched participants (132 men, 66 women) without CCS exposure, 21 of the 66 (32%) CCS athletes, but none of the unexposed participants, had CTE.4 Among 202 American football players from the Veterans Affairs (VA)–Boston University (BU)–Concussion Legacy Foundation (CLF) Brain bank, 177 (88%) players had CTE, including 3 of 14 (21%) high school players, 48 of 53 (91%) college players, and 110 of 111 (99%) National Football League (NFL) players. The NFL players commonly (95 of 110 [86%]) had severe CTE (ie, stage III or IV).5
Notwithstanding these studies, the precise relationship between duration of American football participation and CTE neuropathology is unclear. We hypothesized that, as duration of American football played increased, CTE neuropathological risk and severity would correspondingly increase. We investigated these relationships in a convenience sample of former American football players from the VA‐BU‐CLF and the Framingham Heart Study (FHS) Brain Banks. It is well known that brain bank studies suffer from selection bias, and research on CTE has been criticized for this limitation.12, 13 To account for this bias, we adjusted for known predictors of selection into brain banks using inverse probability weighting (IPW).14 The inclusion criteria for brain donation to the VA‐BU‐CLF Brain Bank are based entirely on exposure to CCS, military service, or domestic violence; because of these unique criteria, we also conducted simulation analyses to quantify the conditions that might lead to selection bias. Importantly, this article focuses exclusively on measuring the relationship between the extent of American football play and CTE neuropathology. Given our incomplete understanding of clinicopathological correlation in CTE, it does not address how CTE pathology may mediate the relationship between football play and clinical manifestations.
Materials and Methods
Participant Recruitment and Selection into the Study
All participants came from the VA‐BU‐CLF or FHS Brain Banks. Recruitment and inclusion criteria for both studies have been detailed previously.3, 15, 16 Recruitment for the VA‐BU‐CLF Brain Bank occurred between 2008 and 2017. Since tracking began in 2014, recruitment occurred in the following ways: next‐of‐kin contacted the brain bank near the time of death (n = 194 [78%]), participants joined the BU Brain Donation Registry in life (n = 16 [6%]), a CLF representative contacted next‐of‐kin (n = 13 [5%]), or a medical examiner contacted the brain bank (n = 26 [11%]). To be eligible for brain bank donation, donors needed to have a history of CCS, military service, or domestic violence, regardless of whether symptoms manifested during life. Donors were excluded if postmortem interval exceeded 72 hours. Additional eligibility criteria, which prioritized younger players and players with more play, were introduced in 2014 due to limited resources. Specifically, American football players who died after the age of 35 years needed to have at least 2 years of college level play. Football players who died prior to age 35 years were accepted regardless of their level of play. The FHS Brain Bank includes participants from 2 generations of the FHS prospective surveillance study for incident cardiovascular disease, stroke, and dementia who agreed to donate their brain. The FHS study began in 1948, with the offspring cohort enrolled in 1971. The FHS Brain Bank is a voluntary subgroup of this cohort, with enrollment beginning in 1997.
For the current study, only male participants from either brain bank who played American football and whose age at death was ≥20 years were included. Figure 1 shows a flowchart for participant inclusion. Participants from both brain banks were included to improve power to detect associations and to have sufficient participant representation across years played and age at death. The selection criteria for the VA‐BU‐CLF Brain Bank prioritized younger players and players with more play. Because the FHS is a community‐based sample, players tended to be older and to have fewer years of American football play. Their addition resulted in more total players without CTE and in a similar distribution of age‐at‐death between players with and without CTE. Participants’ next‐of‐kin provided written consent for brain donation. No next‐of‐kin withdrew consent for participation after the pathologic studies were performed and/or reported. Next‐of‐kin gave permission to publish without identifying features at the time of donation before being made aware of the results. Institutional review board approval was obtained through Boston University Medical Campus and Bedford VA Hospital.
Figure 1.
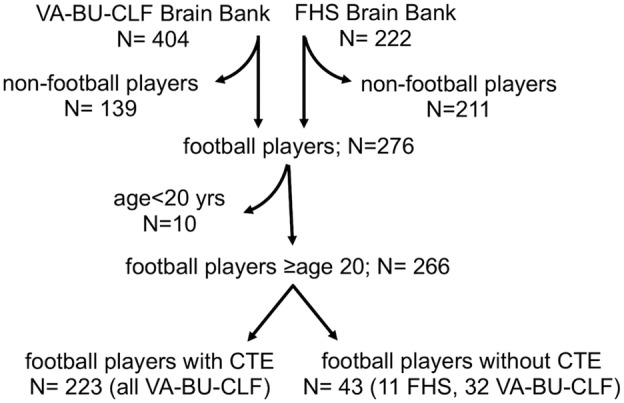
Flowchart showing participant inclusion. Curved arrows indicate excluded participants. Of the 155 donors enrolled between 2008 and 2013, 92 (81 with CTE, 11 without CTE) were included in the analytic set. Of the 249 donors enrolled between 2014 and 2017, 163 (142 with CTE, 21 without CTE) were included in the final analytic set. CTE = chronic traumatic encephalopathy; FHS: Framingham Heart Study; VA‐BU‐CLF: Veterans Affairs–Boston University–Concussion Legacy Foundation.
Collection of Athletic, Military, Traumatic Brain Injury, and Clinical Data
For the VA‐BU‐CLF brain bank, retrospective data collection from informants and medical record review was performed for all participants and has been detailed previously.8, 15 For American football and other organized CCS, informants provided the age the participant began playing, the levels the participant played (youth, high school, college, semiprofessional, professional), and the position(s) and total years the participant played at each level. For participants who played at the professional level, position and years played also were obtained from a public database.17 Informants also indicated whether participants served in the military and engaged in combat. A detailed traumatic brain injury history was obtained from informants, including the number of concussions the participant sustained. Due to evolution of study methodology, only informants for participants ascertained after January 2014 (n = 164) were read a formal definition of concussion18 prior to being asked about the number of concussions. Behavioral neurologists and neuropsychologists obtained a detailed clinical history from informants, including a timeline of cognitive, behavioral, mood, and motor symptomatology. Clinicians completed a form indicating whether particular symptoms were present (including depression) near the time of death, qualitatively summarized the participants’ clinical history (eg, presence and course of symptoms, functional independence, cause of death) into a narrative, and presented the case summary to a multidisciplinary clinical consensus meeting, during which it was determined whether the participant met criteria for dementia.8, 15 Clinicians were blinded to the neuropathological examination and conclusions. Informants were interviewed before receiving the results of the neuropathological examination.
For the FHS Brain Bank, athletic and military data were collected in an identical fashion as the VA‐BU‐CLF Brain Bank, via retrospective data collection from informants. Clinical data, including diagnoses of dementia and depression, were obtained prospectively as part of the FHS clinical assessment. Participants with clear or questionable deficits in one or more cognitive domains on neuropsychological testing were brought to a consensus meeting that included at least one neurologist and one neuropsychologist, during which it was determined whether the participant met criteria for dementia.19 Participants with a Center for Epidemiologic Studies Depression Scale score ≥ 16 at their last visit were considered depressed.20, 21
Neuropathological Assessment
All brains from either brain bank were processed and analyzed using identical methods. Neuropathologists (V.E.A., B.R.H., T.D.S., A.C.M.) were blinded to the participant's CCS exposure and clinical history. Neuropathological processing and gross and microscopic examination followed previously established methods.22, 23, 24 Staining included Luxol fast blue, hematoxylin and eosin, Bielschowsky silver, p‐tau (AT8; pSer202, pThr205), α‐synuclein, amyloid‐β, and phosphorylated transactive response DNA binding protein 43kDa. CTE was diagnosed using NINDS/NIBIB neuropathological criteria.7 All brain regions recommended by the criteria were sampled and evaluated. In selected cases, when pathology was suspicious for CTE, additional sampling was performed. In these cases, large coronal slabs of the cerebral hemispheres were also cut at 50μm on a sledge microtome and stained as free‐floating sections using AT8 or CP‐13. Participants diagnosed with CTE also were assigned a CTE stage (I–IV, increasing with severity) using criteria previously developed.3 Diagnosis and staging of CTE were agreed upon by consensus of all 4 neuropathologists. CTE severity was further dichotomized into mild CTE (stages I&II) and severe CTE (stages III&IV). Because CTE staging has not been independently validated, a measure of cumulative neurofibrillary tangle (NFT) burden was also considered. The neuropathologists recorded semiquantitative measures of NFT burden (by AT8 immunostaining) on a 0‐to‐3 scale (in increasing severity) across 11 regions commonly affected in CTE: dorsolateral frontal cortex, orbital frontal cortex, superior temporal cortex, inferior parietal cortex, CA1, CA2, and CA4 regions of the hippocampus, entorhinal cortex, amygdala, substantia nigra, and locus coeruleus. Cumulative NFT burden was defined as the sum of the semiquantitative measures of p‐tau burden across the regions. The neuropathologist assigned to the case was not significantly associated with NFT burden. Well‐established neuropathological criteria were used to diagnose all comorbid neurodegenerative diseases.25, 26, 27, 28, 29, 30, 31, 32, 33, 34
Defining Football‐Related Exposure Measures
Duration of American football played was defined as the total number of years of organized American football played. Primary player positions at the highest level played were classified in 2 different ways, consistent with previous studies35, 36, 37: (1) lineman and nonlineman; and (2) offensive lineman, running back, tight end, quarterback, wide receiver, defensive lineman, linebacker, and defensive back. Data obtained from the public database17 took precedence over data collected from informants. If exposure data were collected from multiple informants, the duration played and position reported by the plurality of informants were used. If no duration played was reported by a plurality, the average duration played across informants was used. If a participant played more than one position at the highest level (including playing both offensive and defensive positions), the position played most was used. Age of first exposure (AFE) to football was defined as the age that the participant first played organized American football.38, 39, 40, 41
Statistical Analyses
We evaluated the association of duration played with 3 dimensions of CTE pathology (CTE status, CTE severity, and cumulative NFT burden) in a series of separate analyses. We used logistic regression to estimate the relative odds of having CTE with increasing duration played, and among those with CTE, to estimate the relative odds of having severe (as opposed to mild) CTE with increasing duration played. Similarly, among those with CTE, we used linear regression to estimate differences in cumulative NFT burden with increasing duration played. All analyses were adjusted for age at death because of its known relationship with CTE pathology.3, 5, 41 Other potential covariates were considered (black race, concussion number, AFE to football in years, whether other contact sports were also played, primary football position [lineman vs nonlineman], study membership [VA‐BU‐CLF vs FHS] and comorbid neurodegenerative disease) in several multivariate models, each including 3 predictors: age at death, duration played, and the potential covariate. All of these potential covariates were ultimately excluded from the final models because they were not nominally associated with any of the primary outcomes. For the NFT burden analysis, participants with missing NFT data from any region were excluded (n = 51). We excluded participants rather than imputing outcome data because we were sufficiently powered without these participants. Furthermore, missingness was not associated with duration played after adjusting for age at death in a linear regression model and therefore estimated effects were unlikely to be biased by missing data. Probability values were Bonferroni corrected for the 3 primary outcomes.
In 4 separate sensitivity analyses, we repeated the above analyses limited to participants who played no other CCS beside American football, who had no comorbid neurodegenerative disease, who were participants from the VA‐BU‐CLF Brain Bank prior to 2014, and who were participants from the VA‐BU‐CLF Brain Bank from 2014 to 2017.
For each of the 3 primary analyses, we evaluated the linearity assumption in several ways. For the dichotomous outcomes (CTE status and CTE severity), (1) locally estimated scatterplot smoothing (LOESS) regression was used to fit a smooth curve to a model with duration played predicting the outcome; (2) the Hosmer–Lemeshow χ2 test was used to assess goodness of fit; and (3) a natural cubic spline with 3 knots at duration played at 10, 15, and 21 years (where visually there appeared to be potential changes in slope) was compared with the linear model. For the continuous outcome (NFT burden), (1) residuals by predicted values were plotted; and (2) a natural cubic spline with 3 knots at duration played at 10, 15, and 21 years was compared with the linear model.
We plotted a receiver operating characteristic (ROC) curve to observe how well duration played classified CTE status. We identified the thresholds of duration played that corresponded to negative and positive likelihood ratios [LRs] closest to 0.1 and 10, respectively, values that may produce sizable and often conclusive shifts from pre‐ to post‐test probability.42 We also identified a threshold that maximizes the sensitivity and specificity of duration played together using 3 approaches: the Youden index, the distance to the top left corner, and the concordance probability.43
Selection into the brain banks could have depended on duration played and CTE status, thereby possibly biasing our estimates of association between the two. To account for this possibility, we repeated the regression analyses, using IPW based on previously identified predictors of selection into a brain bank. The weight is the inverse estimated probability of selection. Weighting the observations creates a pseudosample that would have been observed had preferential selection according to these variables not occurred.14 Brain bank predictors included in the model were based on Haneuse et al and included age, race, dementia status, and depression status.12 Both education level and sex also predicted brain donation in Haneuse et al, but were excluded from the selection model because there were no women in this study and because education quality differs markedly for college and professional football players compared with nonathlete students. The decision to omit education was made a priori. For many college football athletes in the United States, athletic performance is prioritized over academic performance. Even if student‐athletes obtain a college diploma, the quality of their education (including college preparation in high school, grade‐point average, class participation and preparation, and perception of academic experience) often suffers.44
In using the IPW method above, we assumed that selection into the brain banks was influenced by similar factors and to a similar extent as in a brain bank used for neurodegenerative disease and aging research. However, because the factors influencing selection into the VA‐BU‐CLF Brain Bank are different, including the unique CCS exposure inclusion criteria, we also conducted simulation analyses to quantify the conditions under which selection bias could invalidate our findings. In particular, we focused on the relations of exposure (duration played) and outcome (CTE) with selection. We assume the probability of selection, P(S), is a function of duration played, D, CTE status, C, and their cross product, DC, in a logistic regression model, and that K is the log odds of selection when D, C, and DC are not associated with selection:
| (1) |
We set K = −1.17, the log odds of selection into a brain bank from a community‐based study.12 For individuals, i, we calculated P i (S) for a range of values of β D, β C, and β DC (0 to 2 in intervals of 0.1) and used 1/P i (S) as a weight in IPW analyses evaluating the association of duration played with CTE status. We limited β D, β C, and β DC to non‐negative values based on the assumption that greater duration played and the presence of CTE pathology may increase, but would not decrease probability of brain donation. Were these values negative, we would be evaluating the assumption that there is differentially more selection into the brain bank for participants who played less football and who did not have CTE pathology. We did not think that these conditions were at all realistic because the VA‐BU‐CLF Brain Bank has an over‐representation of players with high years of football played and most likely with CTE (although the lifetime cumulative incidence is unknown). For each set of values of β D, β C, and β DC, we estimated the effect of duration played on CTE status. Among cases only, we repeated this approach for both CTE severity and cumulative NFT burden.
We used R version 3.4.2 or SAS 9.4 to run all statistical analyses.
Results
The study included 223 participants with CTE (84%) and 43 without CTE (16%). Of the 223 participants with CTE, 29 (13%) had stage I CTE, 49 (22%) had stage II, 83 (37%) had stage III, and 62 (28%) had stage IV. Tables 1A and 1B show demographic, American football exposure, and neuropathological characteristics of participants stratified by no CTE, mild CTE (stages I&II), and severe CTE (stages III&IV). Tables 2A and 2B show these same characteristics stratified by membership in the FHS Brain Bank, membership in the VA‐BU‐CLF Brain Bank prior to 2014, and membership in the VA‐BU‐CLF Brain bank from 2014 to 2017. Figure 2 shows the distribution of duration played stratified by and representative images of CTE status (2A–C) and CTE severity (2D–F).
Table 1A.
Demographic, American Football Exposure and Neuropathological Characteristics of 266 Players Stratified by CTE Status
| Characteristic | No CTE (%) (n = 43) | Mild CTE (%) (n = 78) | Severe CTE (%) (n = 145) | All (%) (n = 266) |
|---|---|---|---|---|
| Sex | ||||
| Men | 43 (100%) | 78 (100%) | 145 (100%) | 266 (100%) |
| Women | 0 | 0 | 0 | 0 |
| Race | ||||
| White | 37 (86%) | 66 (85%) | 114 (79%) | 217 (82%) |
| Black | 4 (10%) | 11 (14%) | 30 (20%) | 45 (17%) |
| Pacific Islander | 0 | 0 | 1 (1%) | 1 (<1%) |
| Asian | 1 (2%) | 0 | 0 | 1 (<1%) |
| Other | 1 (2%) | 0 | 0 | 1 (<1%) |
| Unknown | 0 | 1 (1%) | 0 | 1 (<1%) |
| Mean age at death (SD) | 57.0 (23.1) | 48.9 (19.8) | 68.7 (12.9) | 61.0 (19.2) |
| Cause of death | ||||
| Neurodegenerativea | 8 (19%) | 11 (14%) | 66 (46%) | 85 (32%) |
| Cardiovascular disease | 8 (19%) | 10 (13%) | 29 (20%) | 47 (18%) |
| Suicide | 6 (14%) | 21 (27%) | 6 (4%) | 33 (12%) |
| Cancer | 5 (12%) | 5 (6%) | 11 (8%) | 21 (8%) |
| Motor neuron disease | 2 (4%) | 5 (6%) | 9 (6%) | 16 (6%) |
| Accidental overdose | 3 (7%) | 4 (5%) | 5 (3%) | 12 (4%) |
| Injury | 2 (4%) | 2 (3%) | 4 (3%) | 8 (3%) |
| Other | 8 (19%) | 20 (26%) | 15 (10%) | 43 (16%) |
| Unknown | 1 (2%) | 0 | 0 | 1 (<1%) |
| Median concussion count (IQR)b | ||||
| Concussion definition provided (n=162) | 10.0 (0‐65) | 90.0 (12.5‐200) | 40.0 (12‐125) | 47.5 (12‐150) |
| No concussion definition provided (n=85) | 4.5 (0‐9.25) | 3.0 (1‐8.5) | 8.0 (1.5‐18.5) | 5 (1‐10) |
| Mean AFE to football in years (SD) | 12.0 (3.2) | 11.3 (3.1) | 12.2 (2.7) | 11.9 (2.9) |
| Mean duration played in years (SD) | 7.3 (4.3) | 11.6 (4.9) | 15.6 (5.6) | 13.1 (6.0) |
Includes dementia‐related and parkinsonian‐related causes of death.
Beginning in January 2014, participants were read a definition of concussion prior to inquiry.
AFE = age of first exposure.
Table 1B.
Demographic, American Football Exposure and Neuropathological Characteristics of 266 Players Stratified by CTE Status
| Characteristic | No CTE (%) (n = 43) | Mild CTE (%) (n = 78) | Severe CTE (%) (n = 145) | All (%) (n = 266) |
|---|---|---|---|---|
| Highest level of play | ||||
| Youth | 1 (2%) | 3 (4%) | 1 (1%) | 5 (2%) |
| High school | 20 (47%) | 12 (15%) | 2 (2%) | 34 (13%) |
| College | 14 (33%) | 30 (38%) | 37 (25%) | 81 (30%) |
| Semi‐Professional | 5 (12%) | 4 (5%) | 1 (1%) | 10 (4%) |
| Professional (NFL, CFL) | 3 (6%) | 29 (37%) | 104 (71%) | 136 (51%) |
| Primary position at highest level of play | ||||
| Offensive Lineman | 9 (20%) | 15 (19%) | 33 (23%) | 57 (21%) |
| Defensive Lineman | 6 (14%) | 17 (22%) | 29 (20%) | 52 (20%) |
| Running Back | 5 (12%) | 10 (13%) | 27 (19%) | 42 (16%) |
| Linebacker | 2 (4%) | 13 (17%) | 15 (10%) | 30 (11%) |
| Defensive Back | 5 (12%) | 9 (12%) | 21 (14%) | 35 (13%) |
| Quarterback | 5 (12%) | 4 (5%) | 11 (8%) | 20 (8%) |
| Tight End | 5 (12%) | 3 (4%) | 6 (4%) | 14 (5%) |
| Wide Receiver | 1 (2%) | 3 (4%) | 1 (1%) | 5 (2%) |
| Kicker or Puntera | 0 | 2 (2%) | 0 | 2 (1%) |
| Unknown/Unreported | 5 (12%) | 2 (3%)c | 2 (1%) | 9 (3%) |
| Military veterans | 16 (37%) | 15 (19%) | 43 (30%) | 74 (28%) |
| Other contact sport play | 13 (30%) | 23 (30%) | 23 (16%) | 59 (22%) |
| Neuropathology | ||||
| Alzheimer's disease | 8 (19%) | 2 (3%) | 26 (18%) | 36 (14%) |
| Lewy body disease | 8 (19%) | 7 (9%) | 34 (23%) | 49 (18%) |
| Frontotemporal lobar degeneration | 5 (12%) | 9 (12%) | 12 (8%) | 26 (10%) |
| Motor neuron disease | 1 (2%) | 5 (6%) | 9 (6%) | 15 (6%) |
Both players played other positions, but kicker/punter was the primary position.
CFL = Canadian Football League; NFL = National Football League.
Table 2A.
Demographic, American Football Exposure and Neuropathological Characteristics of 266 Players Stratified by Brain Bank
| Characteristic | VA‐BU‐CLF pre‐2014 (%) (n = 91) | VA‐BU‐CLF 2014‐2017 (%) (n = 164) | FHS (%) (n = 11) | All (%) (n = 266) |
|---|---|---|---|---|
| Sex | ||||
| Men | 91 (100%) | 164 (100%) | 11 (100%) | 266 (100%) |
| Women | 0 | 0 | 0 | 0 |
| Race | ||||
| White | 79 (87%) | 127 (77%) | 11 (100%) | 217 (82%) |
| Black | 11 (12%) | 34 (20%) | 0 | 45 (17%) |
| Pacific Islander | 0 | 1 (1%) | 0 | 1 (<1%) |
| Asian | 0 | 1 (1%) | 0 | 1 (<1%) |
| Other | 0 | 1 (1%) | 0 | 1 (<1%) |
| Unknown | 1 (1%) | 0 | 0 | 1 (<1%) |
| Mean age at death (SD) | 58.4 (18.9) | 61.0 (19.0) | 82.2 (9.9) | 61.0 (19.2) |
| Cause of death | ||||
| Neurodegenerativea | 26 (28%) | 58 (35%) | 1 (9%) | 85 (32%) |
| Cardiovascular disease | 12 (13%) | 31 (19%) | 4 (36%) | 47 (18%) |
| Suicide | 14 (15%) | 19 (12%) | 0 | 33 (12%) |
| Cancer | 9 (10%) | 8 (5%) | 4 (36%) | 21 (8%) |
| Motor neuron disease | 10 (11%) | 6 (4%) | 0 | 16 (6%) |
| Accidental overdose | 6 (7%) | 6 (4%) | 0 | 12 (4%) |
| Injury | 6 (7%) | 2 (1%) | 0 | 8 (3%) |
| Other | 7 (8%) | 34 (20%) | 2 (18%) | 43 (16%) |
| Unknown | 1 (1%) | 0 | 0 | 1 (<1%) |
| Median concussion count (IQR)b | ||||
| Concussion definition provided | ‐ | 45 (12‐150) | 0 | 47.5 (12‐150) |
| No concussion definition provided | 5 (1‐10) | ‐ | ‐ | 5 (1‐10) |
| Mean AFE to football in years (SD) | 11.8 (2.6) | 11.8 (3.1) | 14.3 (2.4) | 11.9 (2.9) |
| Mean duration played in years (SD) | 13.0 (6.1) | 13.7 (5.8) | 4.6 (1.3) | 13.1 (6.0) |
Includes dementia‐related and parkinsonian‐related causes of death.
Beginning in January 2014, participants were read a definition of concussion prior to inquiry.
AFE = age of first exposure.
Table 2B.
Demographic, American Football Exposure and Neuropathological Characteristics of 266 Players Stratified by Brain Bank
| Characteristic | VA‐BU‐CLF pre‐2014 (%) (n = 91) | VA‐BU‐CLF 2014‐2017 (%) (n = 164) | FHS (%) (n = 11) | All (%) (n = 266) |
|---|---|---|---|---|
| Highest level of play | ||||
| Youth | 2 (2%) | 2 (1%) | 1 (9%) | 5 (2%) |
| High school | 16 (18%) | 12 (7%) | 6 (55%) | 34 (13%) |
| College | 20 (22%) | 57 (35%) | 4 (36%) | 81 (30%) |
| Semi‐Professional | 4 (4%) | 6 (4%) | 0 | 10 (4%) |
| Professional (NFL, CFL) | 49 (54%) | 87 (53%) | 0 | 136 (51%) |
| Primary position at highest level of play | ||||
| Offensive Lineman | 20 (21%) | 34 (21%) | 3 (27%) | 57 (21%) |
| Defensive Lineman | 20 (21%) | 32 (20%) | 0 | 52 (20%) |
| Running Back | 8 (9%) | 31 (19%) | 3 (27%) | 42 (16%) |
| Linebacker | 11 (12%) | 19 (12%) | 0 | 30 (11%) |
| Defensive Back | 14 (15%) | 21 (13%) | 0 | 35 (13%) |
| Quarterback | 5 (6%) | 13 (7%) | 2 (18%) | 20 (8%) |
| Tight End | 6 (7%) | 7 (4%) | 1 (9%) | 14 (5%) |
| Wide Receiver | 3 (4%) | 2 (1%) | 0 | 5 (2%) |
| Kicker or Puntera | 1 (1%) | 1 (1%) | 0 | 2 (1%) |
| Unknown/Unreported | 3 (4%) | 4 (2%) | 2 (18%) | 9 (3%) |
| Military veterans | 19 (21%) | 47 (29%) | 8 (73%) | 74 (28%) |
| Other contact sport play | 20 (22%) | 36 (22%) | 3 (27%) | 59 (22%) |
| Neuropathology | ||||
| Alzheimer's disease | 10 (11%) | 22 (13%) | 4 (36%) | 36 (14%) |
| Lewy body disease | 15 (17%) | 29 (18%) | 5 (45%) | 49 (18%) |
| Frontotemporal lobar degeneration | 10 (11%) | 15 (9%) | 1 (9%) | 26 (10%) |
| Motor neuron disease | 9 (10%) | 5 (3%) | 1 (9%) | 15 (6%) |
Both players played other positions, but kicker/punter was the primary position.
CFL = Canadian Football League; NFL = National Football League.
Figure 2.
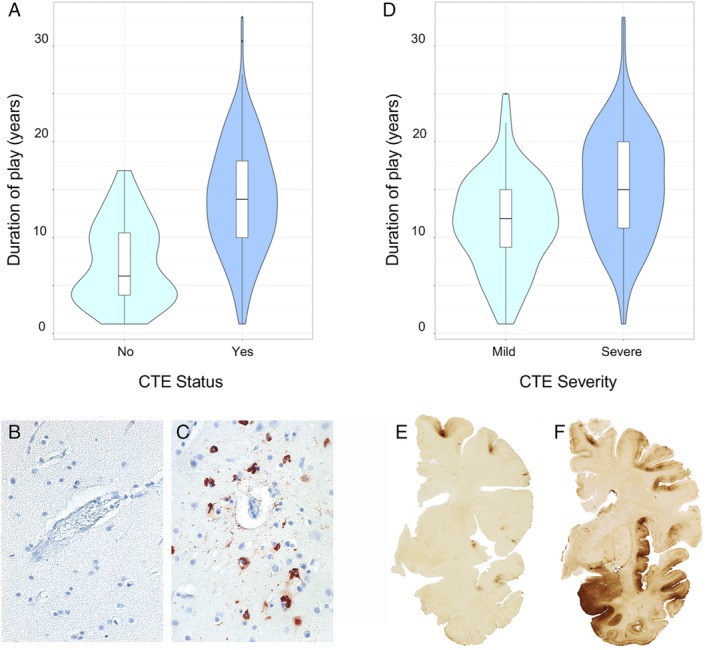
Distribution of duration played and representative images of chronic traumatic encephalopathy (CTE) status and CTE severity. (A) Violin plots of duration played stratified by CTE status. The colored areas show the distribution of duration played. The interior boxplots show the median, lower and upper quartiles, and 95% confidence intervals. (B, C) Ten‐micrometer paraffin‐embedded tissue sections were immunostained with microscopic mouse monoclonal antibody for phosphorylated tau (AT8; Pierce Endogen, Waltham, MA) and counterstained with hematoxylin. Positive p‐tau immunostaining appears dark red. (B) Normal blood vessel at the sulcal depth with no CTE pathology. (C) CTE perivascular lesion: neurofibrillary tangles and dotlike and threadlike neurites surround a small blood vessel at the sulcal depth. (D) Violin plots of duration played stratified by CTE severity among participants with CTE. The colored areas show the distribution of duration played. The interior boxplots show the median, lower and upper quartiles, and 95% confidence interval. (E, F) Fifty‐micrometer hemispheric tissue sections immunostained with mouse monoclonal antibody CP‐13, directed against tau phosphoserine 202 (courtesy of Peter Davies, PhD, Feinstein Institute for Medical Research; 1:200). (E) Mild CTE pathology with multiple perivascular p‐tau CTE lesions at depths of sulci of the frontal cortex without neurofibrillary degeneration in the medial temporal lobe. (F) Severe CTE pathology with multiple large CTE lesions in the frontal cortex and insula, and diffuse neurofibrillary degeneration in the medial temporal lobe.
In models adjusted for age at death, there was a dose–response relationship between longer duration played and having CTE; each additional year of play corresponded to 30% higher odds of having CTE at death (Bonferroni corrected p = 3.8 × 10⁻⁹; Table 3). Among participants with CTE, there was a dose–response relationship between longer duration played and having severe CTE; each additional year of play corresponded to 14% higher odds of having severe CTE at death (Bonferroni corrected p = 3.1 × 10⁻⁴). Among participants with CTE, there was a dose–response relationship between longer duration played and worse NFT burden across 11 brain regions; each additional year of play corresponded to a 0.05 standard deviation increase in NFT burden (Bonferroni corrected p = 6.0 × 10⁻⁶).
Table 3.
Primary and Sensitivity Analyses Assessing the Relationship between Duration Played and CTE Neuropathology
| Outcome | Effect Size (95% CI) |
|---|---|
| Primary analyses | |
| (A) Relationship between duration played and CTE neuropathology | |
| (1) CTE status (n = 223 with CTE, 43 without CTE), duration, per year | OR of having CTE: 1.30 (1.19–1.41) |
| (2) CTE severity (n = 223 with CTE), duration, per year | OR of having severe CTE: 1.14 (1.07–1.22) |
| (3) NFT burden (n = 172 with CTE), duration, per yeara | Standardized units higher in NFT burden: 0.05 (0.03–0.07) |
| Sensitivity analyses | |
| (B) Relationship between duration played and CTE neuropathology in participants who played no contact sports besides football | |
| (1) CTE status (n = 177 with CTE, 30 without CTE), duration, per year | OR of having CTE: 1.33 (1.19–1.48) |
| (2) CTE severity (n = 177 with CTE), duration, per year | OR of having severe CTE: 1.14 (1.05–1.23) |
| (3) NFT burden (n = 138 with CTE), duration, per year | Standardized units higher in NFT burden: 0.06 (0.03–0.08) |
| (C) Relationship between duration played and CTE neuropathology in participants with no comorbid neurodegenerative disease | |
| (1) CTE status (n = 134 with CTE, 27 without CTE), duration, per year | OR of having CTE: 1.21 (1.10–1.33) |
| (2) CTE severity (n = 134 with CTE), duration, per year | OR of having severe CTE: 1.18 (1.08–1.29) |
| (3) NFT burden (n = 101 with CTE), duration, per year | Standardized units higher in NFT burden: 0.05 (0.02–0.08) |
| (D) Relationship between duration played and CTE neuropathology in participants from the VA‐BU‐CLF Brain Bank prior to 2014 | |
| (1) CTE status (n = 81 with CTE, 11 without CTE), duration, per year | OR of having CTE: 1.26 (1.08–1.47) |
| (2) CTE severity (n = 81 with CTE), duration, per year | OR of having severe CTE: 1.07 (0.97–1.18) |
| (3) NFT burden (n = 49 with CTE), duration, per year | Standardized units higher in NFT burden: 0.06 (0.02–0.10) |
| (E) Relationship between duration played and CTE neuropathology in participants from the VA‐BU‐CLF Brain Bank from 2014 to 2017 | |
| (1) CTE status (n = 142 with CTE, 21 without CTE), duration, per year | OR of having CTE: 1.24 (1.11–1.39) |
| (2) CTE severity (n = 142 with CTE), duration, per year | OR of having severe CTE: 1.21 (1.09–1.33) |
| (3) NFT burden (n = 123 with CTE), duration, per year | Standardized units higher in NFT burden: 0.05 (0.03–0.07) |
Separate models were run for each outcome. Models were adjusted for age at death.
Fifty‐one participants had missing NFT data from at least 1 of 11 brain regions and were excluded.
CI = confidence interval; CTE = chronic traumatic encephalopathy; NFT = neurofibrillary tangle; OR = odds ratio; VA‐BU‐CLF = Veterans Affairs–Boston University–Concussion Legacy Foundation.
All primary models satisfied the linearity assumption. Specifically, for CTE status and CTE severity, (1) the LOESS regression plots of the log odds of the predicted probability by duration played appeared visually to be relatively linear (Fig 3A and B, respectively); (2) the Hosmer–Lemeshow χ2 test was not significant (p = 0.75 and p = 0.79, respectively), suggesting that the models fit the observed data well; and 3) compared with the linear models, the natural cubic splines had larger Akaike information criteria (AICs; 185.7 vs 184.4 and 214.8 vs 214.4, respectively) and did not have significantly better fit (p = 0.38 and p = 0.25, respectively) than the linear models in LR tests. For NFT burden, (1) the plot of the residuals by predicted values of the linear regression model appeared randomly scattered (see Fig 3C); and (2) compared with the linear model, the natural cubic spline had a similar R 2 value (0.40) and a larger AIC (846.6 vs 845.5), suggesting the natural cubic spline did not have better model fit.
Figure 3.
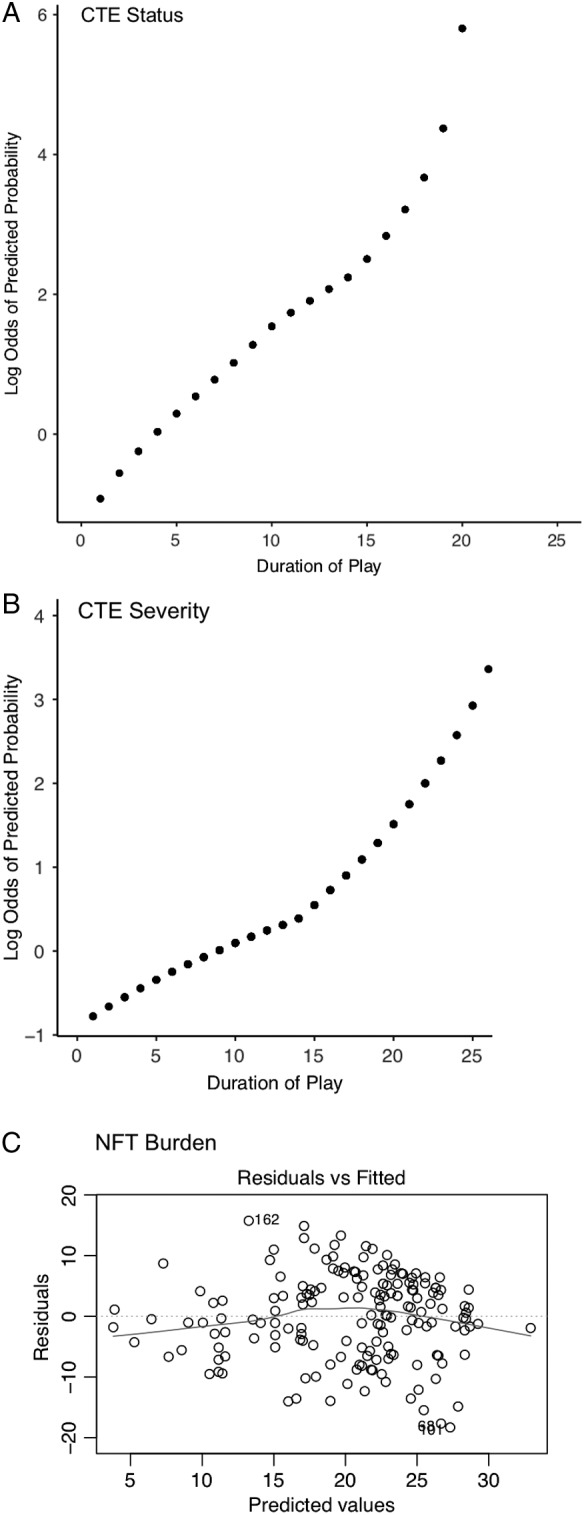
Evaluating the linearity assumption. (A) Locally estimated scatterplot smoothing (LOESS) regression plot of the log odds of the predicted probability of chronic traumatic encephalopathy (CTE) status by duration played. The plot appears visually to be relatively linear. (B) LOESS regression plot of the log odds of the predicted probability of CTE severity by duration played among participants diagnosed with CTE. The plot appears visually to be relatively linear. (C) Plot of the residuals by predicted values for the duration played–neurofibrillary tangle (NFT) burden linear regression model. The plot appears randomly scattered.
In sensitivity analyses, the effect sizes of the relationships between duration played and the 3 primary outcomes remained similar when we limited analyses to participants who played no CCS besides American football, who had no comorbid neurodegenerative disease, who were members of the VA‐BU‐CLF Brain Bank prior to 2014, and who were members of the VA‐BU‐CLF Brain Bank from 2014 to 2017 (see Table 3).
The area under the duration played–CTE status ROC curve was 0.84 (95% confidence interval [CI] = 0.77–0.89), suggesting that duration played is a good classifier of CTE status (Fig 4). Participants with CTE were 1/10th as likely to have played <4.5 years (negative LR = 0.102, 95% CI = 0.100–0.105, sensitivity = 0.96, specificity = 0.40) and were 10 times as likely to have played >14.5 years (positive LR = 10.1, 95% CI = 9.8–10.7, sensitivity = 0.48, specificity = 0.95) compared with participants without CTE. Three different approaches, the Youden index, the distance to the top left corner, and the concordance probability, identified the threshold that maximizes sensitivity and specificity together to be 12.25 years (sensitivity = 0.60, specificity = 0.88), 10.25 years (sensitivity = 0.73, specificity = 0.74), and 11.25 years (sensitivity = 0.67, specificity = 0.81), respectively.
Figure 4.
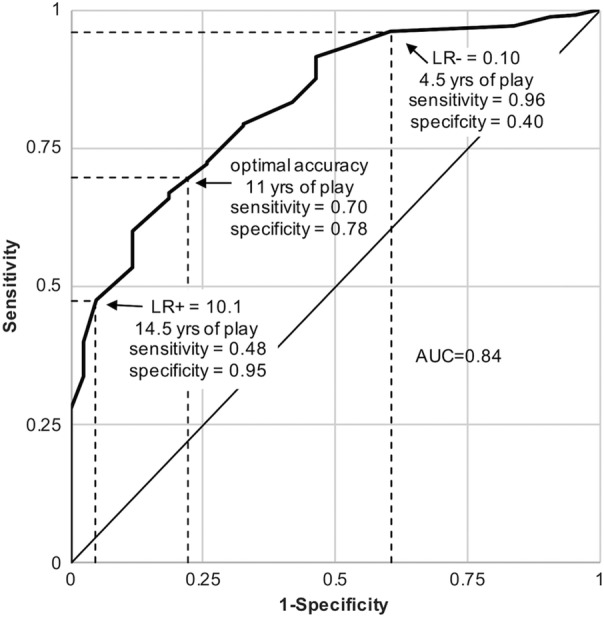
Receiver operating characteristic curve using duration played to classify chronic traumatic encephalopathy (CTE) status. Thresholds of duration played that corresponded to negative and positive likelihood ratios (LR−, LR+, respectively) closest to 0.1 and 10 were 4.5 years and 14.5 years, respectively. Diagnostic tests with these likelihood ratios may produce sizable and often conclusive shifts from pre‐ to post‐test probability.42 CTE classification sensitivity and specificity were maximized together at approximately 11 years played. AUC = area under the curve.
In models adjusted for selection using known predictors of brain bank participation (Fig 5A), the magnitude of the relationships between duration played and the primary outcomes remained similar and statistically significant (selection‐adjusted odds ratio [OR] of having CTE per year = 1.24, selection‐adjusted OR of having severe CTE per year = 1.17, selection‐adjusted standardized units higher in NFT burden per year = 0.06).
Figure 5.
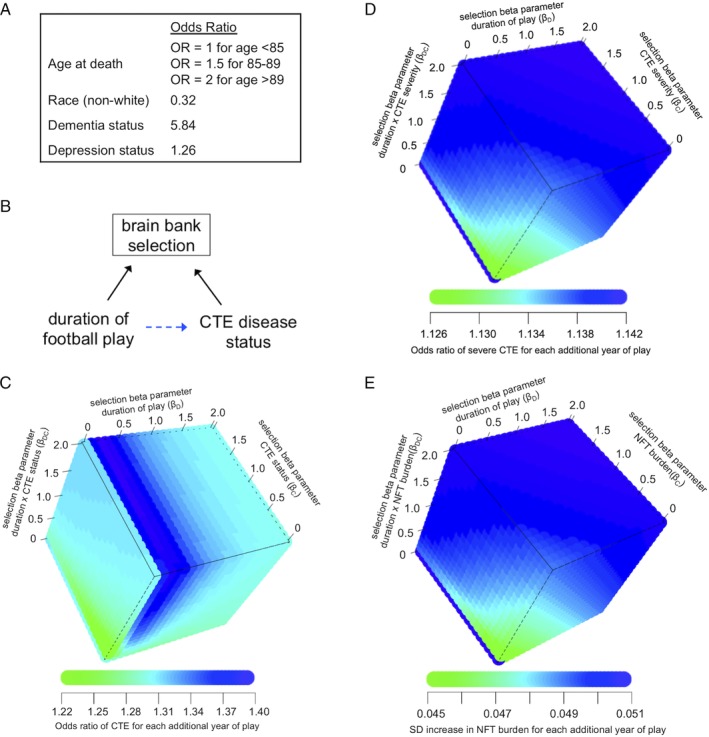
Evaluating selection bias. (A) Factors and their associations with the relative odds of brain donation status from a community‐based aging cohort that were included in the selection model (adapted from Haneuse et al12). Both education level and sex also predicted brain donation, but were excluded from the selection model because there were no women in this study and because education quality differs markedly for college and professional football players. OR = odds ratio. (B) Simplified directed acyclic graph demonstrating the relationship between duration of American football play, chronic traumatic encephalopathy (CTE) pathology, and brain bank selection. Brain bank selection will only bias the relationship between duration of American football play and CTE pathology (dotted blue arrow) if both duration played (or a cause of duration played) and CTE pathology (or a cause of CTE pathology) are related to brain bank selection. (C) Simulation analyses assessed how a range of non‐negative values for selection parameters for duration played (βD, ie, log odds of brain donation for each additional year played when CTE pathology is absent), CTE disease status (βC, ie, log odds of brain donation when CTE pathology is present compared with absent when duration played is approaching zero), and the duration played × CTE status cross product (βDC, ie, additional log odds of brain donation for each additional year played beyond βD, when CTE pathology is present) would affect the odds ratio for the relationship between duration played and CTE disease status. (D, E) Similar simulation analyses assessed how a range of non‐negative values for selection parameters would affect (D) the odds ratio for the relationship between duration played and CTE severity, and (E) the relationship between duration played and neurofibrillary tangle (NFT) burden. SD = standard deviation.
We conducted simulation analyses assessing how brain bank selection based on duration played, CTE status, and their cross product may bias the duration played–CTE pathology relationship (see Fig 5). Across all non‐negative values of selection regression coefficients, β D, β C, and β DC, the selection‐adjusted OR of having CTE for each additional year played ranged between 1.22 and 1.40. For large values of the selection regression coefficients (β D ≥ 2, β C ≥ 0.5, and β DC ≥ 0.5), the selection‐adjusted OR plateaued at 1.30. Among those with CTE, across all values of selection regression coefficients, the OR of having severe CTE for each additional year played ranged between 1.13 and 1.14. For large values of the selection regression coefficients (β D ≥ 0.5, β C ≥ 0.5, and β DC ≥ 0.5), the selection‐adjusted OR plateaued at 1.14. Among those with CTE, across all values of selection regression coefficients, the selection‐adjusted standardized increase in NFT burden for each additional year played ranged between 0.045 and 0.051. For large values of the selection regression coefficients (β D ≥ 0.5, β C ≥ 0.5, and β DC ≥ 0.5), the selection‐adjusted standardized increase plateaued at 0.051.
Discussion
We examined the relationship between duration played and CTE pathology in former American football players. Duration played was significantly associated with odds of CTE at death, with odds increasing 30% every year, doubling every 2.6 years, and increasing by >10‐fold every 9 years. Among those with CTE, duration played was also significantly associated with having severe CTE pathology and greater NFT burden. Duration played was a good classifier of CTE status based on ROC curve analysis.
Brain donation registries, including our own, are not representative of the general population. In the current study, the target population was the general population of former American football players. Selection into the brain bank may bias the estimated relationship between duration played and CTE pathology only if both duration played and CTE pathology are differentially related to selection (see Fig 5). Qualitatively, our experience is that symptoms thought to be associated with CTE pathology and high level of football play both motivate next‐of‐kin to donate. However, because we do not know the quantitative relationship between these factors and selection, we examined the effect of selection with 2 different approaches. First, we adjusted for selection using known predictors of brain bank participation from an aging population. Because predictors of brain donation among former American football players may be different than the general aging population, we also conducted a simulation analysis to quantify the conditions that might lead to selection bias, focusing on the relations of duration played, CTE outcomes, and their cross product on selection. We found that even under conditions of extreme selection into the brain bank, the OR for the relationships between duration played and CTE outcomes had consistent magnitudes. For instance, if in the absence of CTE (ie, C = 0 in Equation 1), brain donation were e2 = 7.4 times as likely for each additional year of play (ie, β D = 2), and in the presence of CTE (ie, C = 1 in Equation 1), brain donation were e4 = 55 times as likely for each additional year of play (ie, β D + β DC = 2 + 2 = 4), then the effect of duration played on CTE nonetheless would be nearly identical (OR = 1.31). These findings suggest that selection into the study is unlikely to meaningfully bias the estimated effect and that this effect may generalize to the target population.
We report duration played thresholds of 4.5 and 14.5 years that most closely correspond to negative and positive LRs of 0.1 and 10, respectively, for classifying CTE status. A diagnostic test with these LRs may produce sizable and often conclusive shifts from pre‐ to post‐test probability.42 Although the LRs that correspond to the thresholds are large, the thresholds do not classify CTE status perfectly. For instance, there were 9 participants with CTE who played <4.5 years, 6 of whom played other CCS. There were 2 participants without CTE who played >14.5 years. We also report a threshold of approximately 11 years that maximizes the sensitivity and specificity together. Interestingly, the clinical research criteria for CTE proposed in 2014 required 6 years of contact‐sport exposure, but was not limited to American football.9 This value was based on clinical experience and was not derived from empirical data. These thresholds will inform future criteria for the clinical diagnosis of CTE, but are imperfect classifiers and should not be considered thresholds below which CTE will not occur or above which CTE is guaranteed to occur.
In recent work that also utilized the VA‐BU‐CLF Brain Bank, Alosco et al found that AFE to American football was not associated with CTE pathological severity after accounting for duration played, but was associated with earlier symptom onset.41 The finding suggests that AFE to American football is not related to CTE pathology itself, but may reduce resiliency to CTE pathology. Similarly, in the current study, AFE to American football was not associated with any of the primary neuropathological outcomes and was left out of the final models. However, AFE to American football will be considered in future work that assesses clinical outcomes and resiliency.
Strengths of the study include the world's largest collection of brains from former American football players and an analytic approach that investigated whether brain bank selection was meaningfully biasing the estimated relationships. There are several limitations. (1) There is a comparatively small number of brains from former American football players without CTE. (2) The collection of brains is from a convenience sample and therefore only allows for estimating relative odds, but not cumulative incidence of CTE conditioned on duration played. (3) Informants may inaccurately recall reported duration played. For professional years played, an online database was used to reduce reporting error. Unfortunately, similar databases are not available for lower levels of play. (4) Although we hypothesize that football play leads to CTE pathology via repetitive head impact (RHI) exposure, years played serves as an imperfect proxy for RHI exposure from American football. For example, an athlete who played for 1 year as a starter on offense and defense may have had more exposure than an athlete who played only sparingly for 1 year. A more accurate composite measure that incorporates additional components of RHI exposure, such as helmet accelerometer data, may result in a better estimate of risk.45 We did consider several other components of RHI exposure as covariates (concussion number, AFE to football, whether other contact sports were played, primary football position). None of these was nominally associated with the primary outcomes, and all were left out of the final models. (5) This article focuses exclusively on establishing the relationship between exposure to American football play and CTE pathology. Pathology itself is of limited value unless it can be linked to clinical symptomatology. Although particular clinical symptoms have been described in CTE (most commonly impulsivity, explosivity, depression, memory impairment, and executive dysfunction5, 8, 9), it is unknown which clinical symptoms are most predictive of CTE pathology. Furthermore, there is evidence that CCS exposure is also linked to other non‐CTE neuropathologies (eg, Lewy bodies46) that can lead to similar clinical symptoms. Teasing apart clinicopathological relationships is critical before trying to understand how CTE pathology may mediate the relationship between CCS exposure and clinical syndromes. (6) A different study design that considered selection bias a priori (eg, random selection of cases [ie, those with CTE pathology and clinical manifestations] and controls [ie, those without CTE pathology or clinical manifestations], independent of duration played, from the full population of former football players) may have eliminated the need for IPW and simulation, but would have taken considerably more time and resources to conduct. (7) For the selection bias simulations, we made reasonable assumptions about the selection model (eg, linearity, the baseline value for the probability of selection [K], limiting the selection parameters [β D, β C, and β DC] to non‐negative values). Under other model assumptions, there may be conditions for which selection could invalidate the findings. When we expanded the simulation to include selection parameters with negative values, it was possible to observe the inverse association between duration played and CTE status. Negative selection parameters result in an increased probability of selection for individuals without CTE or with short duration played. These scenarios are inconsistent with the makeup of our sample, in which individuals with high duration played and CTE are likely over‐represented. For this reason, we did not consider negative selection parameters in the presented simulation.
Conclusions
Duration of American football played demonstrated a strong dose–response relationship with CTE neuropathology, doubling odds of disease every 2.6 years and doubling odds of severe disease among those with CTE every 5.3 years. Players with CTE were 1/10th as likely to have played <4.5 years and were 10 times as likely to have played >14.5 years compared with players without CTE. The sensitivity and specificity for classifying CTE based on duration played were maximized at approximately 11 years played. Even under conditions of extreme brain bank selection, the estimated magnitude of the relationship between duration played and CTE status remained consistent.
Author Contributions
J.M., D.H.D., Y.T., and A.C.M. contributed to the conception and design of the study; all authors contributed to the acquisition and analysis of data; J.M., B.A., Y.T., A.S.C., and A.C.M. contributed to drafting the text and preparing the figures.
Potential Conflicts of Interest
C.J.N. and R.A.S. receive nonfinancial support from the NFL Players Association (NFLPA) Mackey‐White Health & Safety Committee. The NFLPA is a union that looks out for the health, safety, and financial interests of current and former NFL players. C.J.N. receives nonfinancial support from Brock International, a firm that manufactures artificial turf designed to reduce football‐related head injuries from impacts with the ground.
Acknowledgment
This work was supported by the NIH National Institute of Neurological Disorders and Stroke (U01NS086659, U01NS093334, R01NS078337, R56NS078337, K23NS102399), NIH National Institute on Aging (P30AG13846; supplement 0572063345, R01AG057902, R01AG061028, K23AG046377, R01AG1649, R21HD089088, F32NS096803), Department of Veterans Affairs (I01 CX001135, CSP 501, B6796‐C), Department of Defense (W81XWH‐13‐2‐0095, W81XWH‐13‐2‐0064, W81XWH1810580, PRARP‐13267017), Alzheimer's Association (NIRG‐15‐362697, NIRG‐305779), National Operating Committee on Standards for Athletic Equipment, Nick and Lynn Buoniconti Foundation, Concussion Legacy Foundation, Andlinger Foundation, World Wrestling Entertainment, and NFL.
We thank VA Boston Healthcare System (Boston, MA) and the Edith Nourse Rogers Memorial Veterans Hospital (Bedford, MA) for the use of resources and facilities; all members of the Boston University CTE Center, the VA‐BU‐CLF Brain Bank (including Kerry Cormier, Carol Kubilus, Rebecca Mathias, Ray Nicks and Madeline Uretsky), and the Concussion Legacy Foundation (including Lisa McHale); and the individuals and families whose participation and contributions made this work possible.
References
- 1. Corsellis JA, Bruton CJ, Freeman‐Browne D. The aftermath of boxing. Psychol Med 1973;3:270–303. [DOI] [PubMed] [Google Scholar]
- 2. Omalu BI, DeKosky ST, Minster RL, et al. Chronic traumatic encephalopathy in a National Football League player. Neurosurgery 2005;57:128–134; discussion 128–134. [DOI] [PubMed] [Google Scholar]
- 3. McKee AC, Stern RA, Nowinski CJ, et al. The spectrum of disease in chronic traumatic encephalopathy. Brain J Neurol 2013;136(pt 1):43–64. [DOI] [PMC free article] [PubMed] [Google Scholar]
- 4. Bieniek KF, Ross OA, Cormier KA, et al. Chronic traumatic encephalopathy pathology in a neurodegenerative disorders brain bank. Acta Neuropathol 2015;130:877–889. [DOI] [PMC free article] [PubMed] [Google Scholar]
- 5. Mez J, Daneshvar DH, Kiernan PT, et al. Clinicopathological evaluation of chronic traumatic encephalopathy in players of American football. JAMA 2017;318:360–370. [DOI] [PMC free article] [PubMed] [Google Scholar]
- 6. Ling H, Morris HR, Neal JW, et al. Mixed pathologies including chronic traumatic encephalopathy account for dementia in retired association football (soccer) players. Acta Neuropathol 2017;133:337–352. [DOI] [PMC free article] [PubMed] [Google Scholar]
- 7. McKee AC, Cairns NJ, Dickson DW, et al. The first NINDS/NIBIB consensus meeting to define neuropathological criteria for the diagnosis of chronic traumatic encephalopathy. Acta Neuropathol 2016;131:75–86. [DOI] [PMC free article] [PubMed] [Google Scholar]
- 8. Stern RA, Daneshvar DH, Baugh CM, et al. Clinical presentation of chronic traumatic encephalopathy. Neurology 2013;81:1122–1129. [DOI] [PMC free article] [PubMed] [Google Scholar]
- 9. Montenigro PH, Baugh CM, Daneshvar DH, et al. Clinical subtypes of chronic traumatic encephalopathy: literature review and proposed research diagnostic criteria for traumatic encephalopathy syndrome. Alzheimers Res Ther 2014;6:68. [DOI] [PMC free article] [PubMed] [Google Scholar]
- 10. Goldstein LE, Fisher AM, Tagge CA, et al. Chronic traumatic encephalopathy in blast‐exposed military veterans and a blast neurotrauma mouse model. Sci Transl Med 2012;4:134ra60. [DOI] [PMC free article] [PubMed] [Google Scholar]
- 11. Ling H, Holton JL, Shaw K, et al. Histological evidence of chronic traumatic encephalopathy in a large series of neurodegenerative diseases. Acta Neuropathol 2015;130:891–893. [DOI] [PubMed] [Google Scholar]
- 12. Haneuse S, Schildcrout J, Crane P, et al. Adjustment for selection bias in observational studies with application to the analysis of autopsy data. Neuroepidemiology 2009;32:229–239. [DOI] [PMC free article] [PubMed] [Google Scholar]
- 13. Asken BM, Sullan MJ, DeKosky ST, et al. Research gaps and controversies in chronic traumatic encephalopathy: a review. JAMA Neurol 2017;74:1255–1262. [DOI] [PubMed] [Google Scholar]
- 14. Hernán MA, Hernández‐Díaz S, Robins JM. A structural approach to selection bias. Epidemiology 2004;15:615–625. [DOI] [PubMed] [Google Scholar]
- 15. Mez J, Solomon TM, Daneshvar DH, et al. Assessing clinicopathological correlation in chronic traumatic encephalopathy: rationale and methods for the UNITE study. Alzheimers Res Ther 2015;7:62. [DOI] [PMC free article] [PubMed] [Google Scholar]
- 16. Au R, Seshadri S, Knox K, et al. The Framingham Brain Donation Program: neuropathology along the cognitive continuum. Curr Alzheimer Res 2012;9:673–686. [DOI] [PMC free article] [PubMed] [Google Scholar]
- 17.Sports Statistics on http://justsportsstats.com. Available at: http://www.justsportsstats.com/. Accessed June 20, 2016.
- 18. Robbins CA, Daneshvar DH, Picano JD, et al. Self‐reported concussion history: impact of providing a definition of concussion. Open Access J Sports Med 2014;5:99–103. [DOI] [PMC free article] [PubMed] [Google Scholar]
- 19. Chêne G, Beiser A, Au R, et al. Gender and incidence of dementia in the Framingham Heart Study from mid‐adult life. Alzheimers Dement 2015;11:310–320. [DOI] [PMC free article] [PubMed] [Google Scholar]
- 20. Radloff LS. The CES‐D Scale: a self‐report depression scale for research in the general population. Appl Psychol Meas 1977;1:385–401. [Google Scholar]
- 21. Saczynski JS, Beiser A, Seshadri S, et al. Depressive symptoms and risk of dementia: the Framingham Heart Study. Neurology 2010;75:35–41. [DOI] [PMC free article] [PubMed] [Google Scholar]
- 22. Vonsattel JPG, del Amaya MP, Keller CE. Twenty‐first century brain banking. Processing brains for research: the Columbia University methods. Acta Neuropathol 2008;115:509–532. [DOI] [PMC free article] [PubMed] [Google Scholar]
- 23. Vonsattel JPG, Amaya M del P, Cortes EP, et al. Twenty‐first century brain banking: practical prerequisites and lessons from the past: the experience of New York Brain Bank, Taub Institute, Columbia University. Cell Tissue Bank 2008;9:247–258. [DOI] [PMC free article] [PubMed] [Google Scholar]
- 24. McKee AC, Cantu RC, Nowinski CJ, et al. Chronic traumatic encephalopathy in athletes: progressive tauopathy following repetitive head injury. J Neuropathol Exp Neurol 2009;68:709–735. [DOI] [PMC free article] [PubMed] [Google Scholar]
- 25. McKeith IG. Consensus guidelines for the clinical and pathologic diagnosis of dementia with Lewy bodies (DLB): report of the Consortium on DLB International Workshop. J Alzheimers Dis 2006;9(3 suppl):417–423. [DOI] [PubMed] [Google Scholar]
- 26. Braak H, Del Tredici K. Invited Article: Nervous system pathology in sporadic Parkinson disease. Neurology 2008;70:1916–1925. [DOI] [PubMed] [Google Scholar]
- 27. Hyman BT, Phelps CH, Beach TG, et al. National Institute on Aging‐Alzheimer's Association guidelines for the neuropathologic assessment of Alzheimer's disease. Alzheimers Dement 2012;8:1–13. [DOI] [PMC free article] [PubMed] [Google Scholar]
- 28. Montine TJ, Phelps CH, Beach TG, et al. National Institute on Aging‐Alzheimer's Association guidelines for the neuropathologic assessment of Alzheimer's disease: a practical approach. Acta Neuropathol 2012;123:1–11. [DOI] [PMC free article] [PubMed] [Google Scholar]
- 29. Dickson DW. Neuropathology of non‐Alzheimer degenerative disorders. Int J Clin Exp Pathol 2009;3:1–23. [PMC free article] [PubMed] [Google Scholar]
- 30. Mackenzie IRA, Neumann M, Bigio EH, et al. Nomenclature and nosology for neuropathologic subtypes of frontotemporal lobar degeneration: an update. Acta Neuropathol 2010;119:1–4. [DOI] [PMC free article] [PubMed] [Google Scholar]
- 31. Cairns NJ, Neumann M, Bigio EH, et al. TDP‐43 in familial and sporadic frontotemporal lobar degeneration with ubiquitin inclusions. Am J Pathol 2007;171:227–240. [DOI] [PMC free article] [PubMed] [Google Scholar]
- 32. Brownell B, Oppenheimer DR, Hughes JT. The central nervous system in motor neurone disease. J Neurol Neurosurg Psychiatry 1970;33:338–357. [DOI] [PMC free article] [PubMed] [Google Scholar]
- 33. Mirra SS, Heyman A, McKeel D, et al. The Consortium to Establish a Registry for Alzheimer's Disease (CERAD). Part II. Standardization of the neuropathologic assessment of Alzheimer's disease. Neurology 1991;41:479–486. [DOI] [PubMed] [Google Scholar]
- 34. Litvan I, Hauw JJ, Bartko JJ, et al. Validity and reliability of the preliminary NINDS neuropathologic criteria for progressive supranuclear palsy and related disorders. J Neuropathol Exp Neurol 1996;55:97–105. [DOI] [PubMed] [Google Scholar]
- 35. Baugh CM, Kiernan PT, Kroshus E, et al. Frequency of head‐impact‐related outcomes by position in NCAA Division I collegiate football players. J Neurotrauma 2015;32:314–326. [DOI] [PMC free article] [PubMed] [Google Scholar]
- 36. Crisco JJ, Wilcox BJ, Beckwith JG, et al. Head impact exposure in collegiate football players. J Biomech 2011;44:2673–2678. [DOI] [PMC free article] [PubMed] [Google Scholar]
- 37. Guskiewicz KM, McCrea M, Marshall SW, et al. Cumulative effects associated with recurrent concussion in collegiate football players: the NCAA Concussion Study. JAMA 2003;290:2549–2555. [DOI] [PubMed] [Google Scholar]
- 38. Stamm JM, Koerte IK, Muehlmann M, et al. Age at first exposure to football is associated with altered corpus callosum white matter microstructure in former professional football players. J Neurotrauma 2015;32:1768–1776. [DOI] [PMC free article] [PubMed] [Google Scholar]
- 39. Stamm JM, Bourlas AP, Baugh CM, et al. Age of first exposure to football and later‐life cognitive impairment in former NFL players. Neurology 2015;84:1114–1120. [DOI] [PMC free article] [PubMed] [Google Scholar]
- 40. Alosco ML, Kasimis AB, Stamm JM, et al. Age of first exposure to American football and long‐term neuropsychiatric and cognitive outcomes. Transl Psychiatry 2017;7:e1236. [DOI] [PMC free article] [PubMed] [Google Scholar]
- 41. Alosco ML, Mez J, Tripodis Y, et al. Age of first exposure to tackle football and chronic traumatic encephalopathy. Ann Neurol 2018;83:886–901. [DOI] [PMC free article] [PubMed] [Google Scholar]
- 42. Jaeschke R, Guyatt GH, Sackett DL. Users’ guides to the medical literature. III. How to use an article about a diagnostic test. B. What are the results and will they help me in caring for my patients? The Evidence‐Based Medicine Working Group. JAMA 1994;271:703–707. [DOI] [PubMed] [Google Scholar]
- 43. Liu X. Classification accuracy and cut point selection. Stat Med 2012;31:2676–2686. [DOI] [PubMed] [Google Scholar]
- 44. Vogel BL, Kress J, Jeske DR. Student‐athletes vs. athlete‐students: the academic success, campus involvement, and future goals of Division I student athletes who were university bound compared to those who would not have attended a university had they not been an athlete. 2019. Available at: http://thesportjournal.org/article/student-athletes-vs-athlete-students-the-academic-success-campus-involvement-and-future-goals-of-division-i-student-athletes-who-were-university-bound-compared-to-those-who-would-not-have-attended/. Accessed April 18, 2019.
- 45. Montenigro PH, Alosco ML, Martin B, et al. Cumulative head impact exposure predicts later‐life depression, apathy, executive dysfunction, and cognitive impairment in former high school and college football players. J. Neurotrauma 2017;34:328–340. [DOI] [PMC free article] [PubMed] [Google Scholar]
- 46. Adams JW, Alvarez VE, Mez J, et al. Lewy body pathology and chronic traumatic encephalopathy associated with contact sports. J Neuropathol Exp Neurol 2018;77:757–768. [DOI] [PMC free article] [PubMed] [Google Scholar]