

Abstract
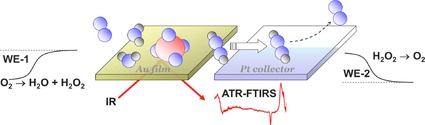
Aiming at a better understanding of correlations between the activity and selectivity of Au electrodes in the oxygen reduction reaction (ORR) under controlled transport conditions, we have investigated this reaction by combined electrochemical and in situ FTIR measurements, performed in a flow cell set‐up in an attenuated total reflection (ATR) configuration in acid and alkaline electrolytes. The formation of incomplete reduction products (hydrogen peroxyde/peroxyls) was detected by a collector electrode, the onset of OHad formation was probed by bulk CO oxidation. Using an electroless‐deposited, annealed Au film on a Si prism as working electrode and three different electrolytes for comparison (sulfuric acid, perchloric acid, sodium hydroxide solution), we could derive detailed information on the anion adsorption behavior, and could correlate this with the ORR characteristics. The data reveal pronounced effects of the anions and the pH on the ORR characteristics, indicated e. g., by a grossly different activity and selectivity for the 4‐electron pathway to water/hydroxyls, with the onset ranging from ca. 1.0 V in alkaline electrolyte to 0.6 V in sulfuric acid electrolyte, and the selectivity for the 4‐electron pathway ranging from 100 % (alkaline electrolyte, low overpotentials) to 40 % (acidic electrolytes, alkaline electrolyte at high overpotentials). In contrast, the effect of the ORR on the anion adsorption characteristics is small. Anion effects as well as correlations between anion adsorption and ORR are discussed.
Keywords: anion adsorption, gold-film electrode, oxygen reduction reaction, pH effect, spectroelectrochemistry
The oxygen reduction reaction (ORR) activity and selectivity of an annealed gold‐film electrode in sulfuric and perchloric acid as well as in sodium hydroxide electrolytes is investigated by in situ attenuated total reflection Fourier‐transform infrared spectroscopy (ATR‐FTIRS), using an electrode for H2O2 detection under continuous‐flow conditions, to identify the correlations between anion adsorption, electrolyte pH, and ORR characteristics.
1. Introduction
The oxygen reduction reaction (ORR), which is considered as the most important process in low‐temperature fuel cells, is commonly catalyzed by Pt‐based catalysts. They exhibit a high activity for the dissociative adsorption of O2 molecules and the four‐electron reduction to water, as compared to the non‐dissociative two‐electron reduction to hydrogen peroxide.1, 2 The ORR on Pt group metals and their alloys has been widely studied both experimentally3, 4, 5 and theoretically,6, 7, 8, 9, 10, 11, 12 aiming at a molecular level understanding as basis for the systematic, knowledge‐based development of catalysts with an improved performance. Adsorbed anions, which are often considered as spectator species, were found to strongly affect the ORR in the kinetic region, which was explained by site blocking effect, reducing the number of pairs of empty surface sites that are required for the dissociative adsorption of O2 molecules.5, 13, 14 Such effects are likely to affect also the ORR selectivity, by changing the ORR pathway from the almost exclusive reduction to water to increasing contributions from the highly undesirable reduction to hydrogen peroxide. This was studied extensively by rotating ring disk electrode measurements.3, 5, 15, 16, 17, 18
Compared to platinum, gold electrodes require much higher overpotential to activate the ORR in an acidic environment, where it predominantly results in hydrogen peroxide formation.19 Both ORR activity and selectivity toward the four‐electron oxygen reduction reaction are, however, considerably improved in alkaline electrolyte,20, 21 especially over Au(100)22, 23 and stepped Au electrodes.24, 25 The underlying reason(s), in particular for the high activity/selectivity of the (100) surface, are still under debate.22, 23, 24, 26, 27, 28, 29, 30, 31, 32, 33, 34, 35, 36, 37, 38, 39, 40, 41 A high ORR activity and selectivity for OH− formation was reported also for preferentially shaped Au nanocrystals,40, 42, 43 specifically treated polycrystalline Au films,43, 44, 45 and Au nanoparticles prepared by gold oxide reduction.43 In the latter case, the high ORR activity was proposed to arise from the defects formed during the oxide reduction derived nanoparticles.43 Other possible effects in addition to purely structural effects, which may be related, e. g., to the adsorption of anions, have in contrast received little attention.
This is topic of the present study, which aims at deriving correlations between the ORR activity and selectivity of Au electrodes and the presence and coverage of adsorbed species, in this case mainly adsorbed anions or interfacial water, under reaction conditions. We will employ in situ Fourier transform infrared spectroscopy in an attenuated reflection configuration (ATR‐FTIRS), in a flow cell configuration, to monitor and identify the nature and coverage of adsorbed species during reaction by direct spectroscopic detection under controlled and enforced mass transport conditions. The latter is particularly important as it had been demonstrated that mass transport effects can affect not only the measured reaction rate, but also the selectivity in the ORR.46, 47 This underlines the necessity of enforced mass transport in spectro‐electrochemical studies of the ORR, during simultaneous spectroscopic detection of adsorbed species or soluble reaction products. It should be noted that mass transport limitations are particularly cumbersome in electrocatalytic reactions involving dissolved gaseous reactants because of their low concentrations in the mM range. A polycrystalline Au film electrolessly deposited on a Si prism, which was subsequently annealed in a butane flame for better stability, serves as working electrode. Acidic (sulfuric or perchloric) and alkaline (sodium hydroxide) solutions with more strongly or more weakly adsorbing anions, respectively, are employed to explore the impact of the anions and the solution pH on the ORR activity and selectivity. The spectro‐electrochemical measurements are performed in a thin layer flow cell,48 equipped with a collector electrode for simultaneous detection of hydrogen peroxide formation.49 This approach was applied recently for studying the impact of adsorbed perfluoralkane phosphonate anions on the ORR activity and selectivity at a Pt film electrode combined with the in situ ATR‐FTIRS.50
Previous electrochemical studies on the influence of anions on the ORR on different low‐index Au surfaces had revealed significant effects of anions on the ORR on basal plane Au electrodes.28 The high activity of Au(100) face toward the four‐electron ORR in alkaline medium was mainly attributed to structural effects, allowing for more facile O−O bond splitting, and for a stronger adsorption of OH.34, 51 Earlier spectro‐electrochemical in situ studies on the ORR at Au electrodes were either performed under conditions where mass transport to/from the electrode is severely hindered, as in measurements in an external reflection configuration,52 or where it is limited over macroscopic distances, as in an internal reflection configuration without enforced mass transport.53, 54, 55 The external reflection in situ IR studies claimed to see the adsorbed superoxide at ca. 1250 cm−1, and OH, indicated by bands at 3680 and 3750 cm−1, which should be formed by decomposition of (adsorbed) HO2.52 In situ ATR‐FTIRS studies on polycrystalline Au film electrodes could identify adsorbed superoxide intermediates during the ORR,53, 54, 55 and comparable results were reported also from in situ surface enhanced Raman spectroscopy (SERS) studies on massive polycrystalline and Au(111) electrodes.31, 56
In the following we will present and discuss the spectro‐electrochemical results obtained for the ORR on a Au film working electrode in acidic and alkaline supporting electrolytes under continuous mass transport in the thin‐layer flow cell, monitoring simultaneously i) the overall ORR current, ii) the hydrogen peroxide formation at the working electrode by oxidation at the collector electrode, and iii) the nature and relative coverage of adsorbed species by in situ ATR‐FTIRS at the working electrode. In section 2.1 we present results of the electrochemical and IR spectroscopic characterization of the Au film electrode in the O2‐free electrolytes. This includes also potentiodynamic CO bulk oxidation measurements in CO‐saturated supporting electrolytes, to gain information on the onset of OHad formation in the anodic scan. Potentiodynamic ORR measurements will be presented in section 2.2. This is followed by ORR transients recorded at constant electrode potentials, monitoring the current upon electrolyte exchange from O2‐free to O2‐saturated supporting electrolyte and back again (section 2.3). In section 2.4 we present results of FTIRS measurements in O2‐saturated electrolytes to identify possible correlation between anion adsorption and ORR activity/selectivity. Finally, mechanistic insights resulting from these data will be discussed in section 2.5, followed by a brief summary.
2. Results and Discussion
2.1. CVs and in situ ATR‐FTIRS in Base Electrolyte
Cyclic voltammograms recorded on the annealed Au film in the double‐layer region and in an extended potential range, allowing AuOx formation and reduction in O2‐free supporting electrolytes, respectively, are plotted in Figures 1a, 2a and 3a. Since CVs in the double‐layer region are commonly recorded at higher scan rates, this first set was recorded at 100 mV s−1, while for the wider scans we applied a scan rate of 10 mV s−1. The pseudo‐capacitive current features for anion adsorption in the double‐layer region, and the steep initial AuO formation peak for the annealed film electrode are comparable to those reported for stepped gold single crystals in acidic (sulfuric and perchloric)57 and alkaline57, 58 solutions; they differ significantly from those obtained on low index single crystal electrodes.59, 60
Figure 1.
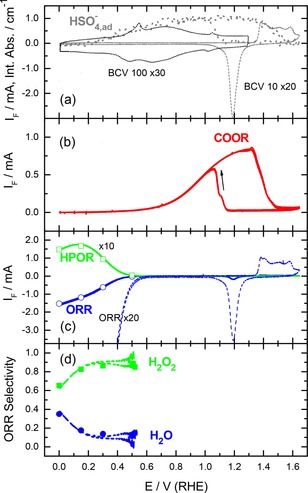
Electrochemical characterization of the annealed Au film electrode in sulfuric acid supporting electrolyte (0.5 M H2SO4, electrolyte flow rate ca. 40 μl s−1). (a) Magnified base CVs recorded in N2‐purged electrolyte at scan rates of 10 (BCV 10) and 100 (BCV 100) mV s−1, respectively, and integrated absorbance of adsorbed (bi‐)sulfate anions (reference spectra acquired at 0.6 V), (b) Faradaic current recorded during potentiodynamic CO bulk oxidation reaction (COOR) in CO‐saturated supporting electrolyte (10 mV s−1); (c) Faradaic current of the ORR (as measured and magnified) and the HPOR (as derived from the collector electrode current, ten‐fold magnified) recorded during potentiodynamic scans (10 mV s−1) in O2‐saturated electrolyte; (d) selectivity of the ORR for the four‐electron oxidation to water in the measurements in c) (lines). Symbols in c) and d) correspond to the steady‐state ORR and HPOR currents (Figure 2a) and the selectivity (Figure 2b) recorded at constant potentials in the transient measurements presented further in Figure 7.
Figure 2.
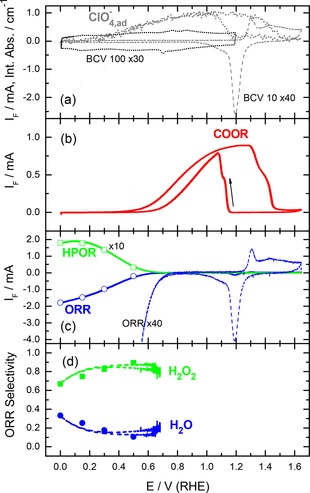
Electrochemical characterization of the annealed Au film electrode in perchloric acid supporting electrolyte (0.5 M HClO4, electrolyte flow rate ca. 40 μl s−1). (a) Magnified base CVs recorded in N2‐purged electrolyte at scan rates of 10 (BCV 10) and 100 (BCV 100) mV s−1, respectively, and integrated absorbance of adsorbed perchlorate (reference spectra acquired at 0.6 V), (b) Faradaic current recorded during potentiodynamic CO bulk oxidation reaction (COOR) in CO‐saturated supporting electrolyte (10 mV s−1); (c) Faradaic current of the ORR (as measured and magnified) and the HPOR (as derived from the collector electrode current, ten‐fold magnified) recorded during potentiodynamic scans (10 mV s−1) in O2‐saturated electrolyte; (d) selectivity of the ORR for the four‐electron oxidation to water in the measurements in c) (lines). Symbols in c) and d) correspond to the steady‐state ORR and HPOR currents (Figure 1b) and the selectivity (Figure 1d) recorded at constant potentials in the transient measurements presented in Figure S3.
Figure 3.
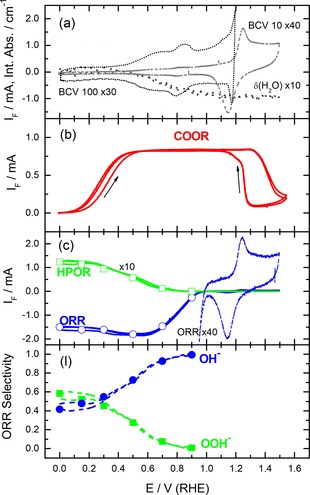
Electrochemical characterization of the annealed Au film electrode in alkaline supporting electrolyte (0.5 M NaOH, electrolyte flow rate ca. 40 μl s−1). (a) Magnified base CVs recorded in N2‐purged electrolyte at scan rates of 10 (BCV 10) and 100 (BCV 100) mV s−1, respectively, and integrated absorbance of the water bending band (reference spectra acquired at 0.6 V), (b) Faradaic current recorded during potentiodynamic CO bulk oxidation reaction (COOR) in CO‐saturated supporting electrolyte (10 mV s−1); (c) Faradaic current of the ORR (as measured and magnified) and the HPOR (as derived from the collector electrode current, ten‐fold magnified) recorded during potentiodynamic scans (10 mV s−1) in O2‐saturated electrolyte; (d) selectivity of the ORR for the four‐electron oxidation to water in the measurements in c) (lines). Symbols in c) and d) correspond to the steady‐state ORR and HPOR currents (Figure 1b) and the selectivity (Figure 1d) recorded at constant potentials in the transient measurements presented in Figure S4.
In sulfuric acid electrolyte, the current response in the double‐layer region (Figure 1a) reproduces the damped, almost symmetric surface restructuring and anion adsorption/desorption features typical for Au(111) electrodes, with an onset potential for (bi‐)sulfate adsorption of ∼0.35 V.60 While hydrogen adsorption features are absent, due to the low hydrogen adsorption energy at gold electrodes, oxygen adsorption/AuOx formation sets in at 1.3 V. The broad current feature includes 4 weak maxima, where the first one with a maximum at 1.38 V is slightly higher than the other ones, which are centered at 1.4, 1.51 and 1.58 V. The pronounced AuO formation feature typical for the extended Au(111) electrodes60 is largely missing. The negative‐going scan is dominated by a distinct, essentially symmetric reduction peak centered at ∼1.2 V.
Similar CVs recorded in perchloric acid solution (Figure 2a) exhibit a rather featureless double‐layer region, which is typical for Au(100)30 and stepped single crystals.57 In the Au oxide region the initial peak, here centered at ca. 1.3 V, starts earlier and is more pronounced than in sulfuric acid base electrolyte. It is followed by an ill‐resolved peak at ca. 1.43 V, and a shoulder at ca. 1.53 V. This closely resembles the gold oxide formation features on Au(100),30, 60 Au(110),60 and stepped Au single crystals57 in perchloric acid solution. The negative‐going scan shows the same dominant reduction peak, but in this case it is followed by a shoulder at lower potentials, which is again typical for Au(100) and Au(110) electrodes in diluted perchloric acid solutions,60 while it is less pronounced, for stepped Au single crystal electrodes.57
CVs recorded in alkaline solution on the annealed Au film electrode (Figure 3a) are more structured in the double‐layer region, with an onset of OH adsorption at around 0.4 V and a broad maximum at 0.8 V. Starting at 1.0 V the anodic current increases again, which is associated with ongoing OH adsorption/formation of Au surface oxide.58 The wide range CVs are again dominated by the oxygen adsorption/desorption and Au oxide formation/reduction features. In the anodic scan this starts with a steep current increase at 1.0 V, resulting in a pronounced peak centered at ca. 1.25 V. This is followed by the decay to a featureless plateau at potentials >1.3 V. Similar responses for the oxide formation were reported for (100), (110), (210), (311) and (610) orientations.25, 58 The cathodic scan is dominated by the reduction peak centered at ∼1.17 V, followed by an ongoing current signal and a second maximum at ca. 0.8 V. The peak at 0.8 V closely resemble the feature reported for Au(100) and Au(110) electrodes in alkaline solution.30, 61
In total, the base CVs in the different electrolytes showed that the adsorption/desorption is most pronounced in alkaline electrolyte, as based on the charge exchange up to the onset Au oxide formation, followed by sulfuric acid, while perchlorate adsorption is much less and hence much weaker. Based on the onset of anion adsorption, OH adsorption and (bi‐)sulfate adsorption are of comparable strength, while perchlorate adsorption is again much weaker. Finally, the data seem to have considerable overlap with (100)‐type and stepped surfaces, although there were also contributions characteristic for other orientations such as (111) and stepped surfaces. Unfortunately it was not possible to derive direct structural information rom SEM imaging and Pb underpotential deposition (Figure S1, Supporting Information). Our conclusion of a preferential (100)‐type orientation of the annealed film would be consistent also with a report of Breuer et al., who based on STM observations arrived at similar conclusions for an annealed Au foil.62
The IR absorption spectra recorded during the positive‐going scan are plotted in Figures 4a, 5a, and 6a, using the spectra acquired at 0.6 V in acidic electrolyte (Figures 4a, 5a) and at 0.9 V in alkaline electrolyte (Figure 6a) as reference. These reference potentials were selected because they are close to the onset potential of the ORR under the respective conditions (Figures 1c, 2c and 3c), which allows for a better identification of modifications during the ongoing ORR at lower potentials, as will be discussed further in section 2.4. Furthermore, they are close to the potential of zero charge of gold electrodes.
Figure 4.
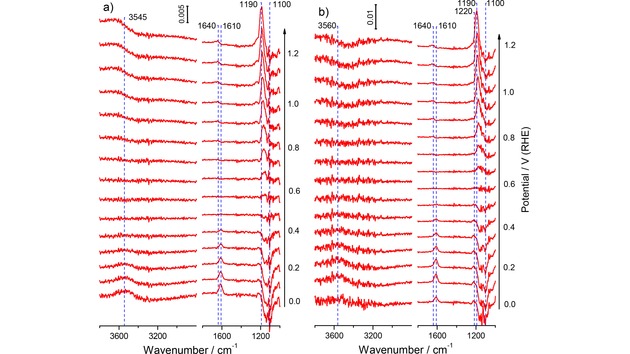
Selected potential‐dependent ATR‐FTIR spectra recorded during a) in O2‐free and b) in O2‐saturated sulfuric acid base electrolyte on the annealed Au film electrode during the positive‐going potentiodynamic scan (10 mV s−1) from 0.0 V to 1.2 V (0.5 M H2SO4, electrolyte flow rate ca. 40 μl s−1). For the measurements in O2‐saturated electrolyte the O2‐free supporting electrolyte was exchanged to the O2‐saturated electrolyte at 0.6 V. The spectra are plotted as difference spectra (see Experimental section), the background spectra were acquired at 0.6 V in O2‐free supporting electrolyte (spectral resolution 4 cm−1, time resolution 1 s−1, for clarity each 10th spectrum is shown).
Figure 5.
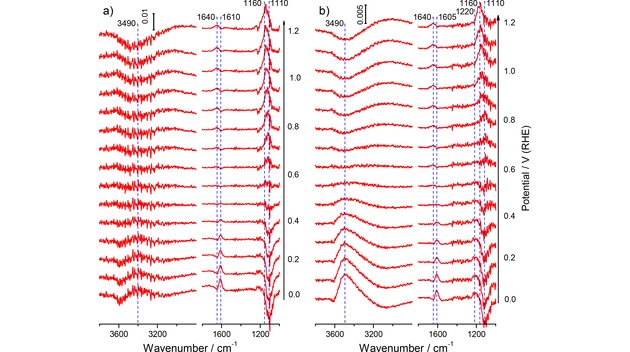
Selected potential‐dependent ATR‐FTIR spectra recorded during a) in O2‐free and b) in O2‐saturated perchloric acid base electrolyte on the annealed Au film electrode during the positive‐going potentiodynamic scan (10 mV s−1) from 0.0 V to 1.2 V (1.0 M HClO4, electrolyte flow rate ca. 40 μl s−1). For the measurements in O2‐saturated electrolyte the O2‐free supporting electrolyte was exchanged to the O2‐saturated electrolyte at 0.6 V. The spectra are plotted as difference spectra (see Experimental section), the background spectra were acquired at 0.6 V in O2‐free supporting electrolyte (spectral resolution 4 cm−1, time resolution 1 s−1, for clarity each 10th spectrum is shown).
Figure 6.
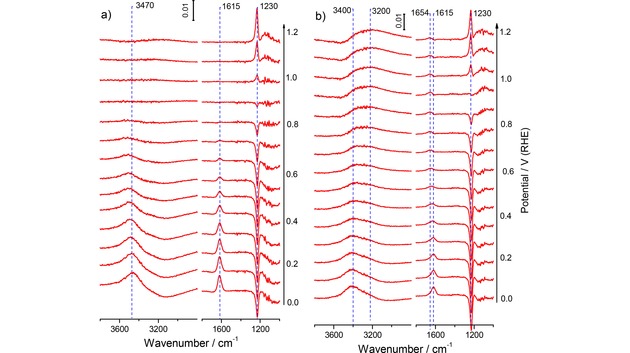
Selected potential‐dependent ATR‐FTIR spectra recorded during a) in O2‐free and b) in O2‐saturated alkaline base electrolyte on the annealed Au film electrode during the positive‐going potentiodynamic scan (10 mV s−1) from 0.0 V to 1.2 V (1.0 M NaOH, electrolyte flow rate ca. 40 μl s−1). For the measurements in O2‐saturated electrolyte the O2‐free supporting electrolyte was exchanged to the O2‐saturated electrolyte at 0.9 V. The spectra are plotted as difference spectra (see Experimental section), the background spectra were acquired at 0.9 V in O2‐free supporting electrolyte (spectral resolution 4 cm−1, time resolution 1 s−1, for clarity each 10th spectrum is shown).
In sulfuric acid supporting electrolyte, the IR spectra are characterized by the broad band of the stretch vibration of interfacial water in the wave number range from ca. 3600 to 3000 cm−1, the water scissoring (bending) vibrations at ca. 1610 cm−1 at low potentials and at ca. 1640 cm−1 at high potentials, and a broad band related to adsorbed (bi‐)sulfate at ca. 1190 cm−1. The band at 1610 cm−1 is attributed to interfacial water not in contact with coadsorbed anions, while that at 1640 cm−1 is due to water in contact with coadsorbed (bi‐)sulfate species.63, 64 At low potentials, in the absence of adsorbed (bi‐)sulfate species, the former band dominates, while at higher potentials, with increasing (bi‐)sulfate adsorption, the latter one prevails. The (bi‐)sulfate related band changes the polarity from negative at low potentials to positive at high potentials, reflecting lower/higher adsorbed (bi‐)sulfate coverage than obtained at the reference potential, respectively (Figure 4a). The (bi‐)sulfate absorption band consists of several contributions, which were assigned earlier to 1‐, 2‐ and 3‐fold coordinated adsorbed (bi‐)sulfate species previously.55, 63, 64 They display a shift of ca. 90 cm−1 V−1 from the contribution at 1100 cm−1, which dominates at low potentials, to that at 1190 cm−1 that is dominant at high potentials. One should keep in mind that this shift of the adsorbed (bi‐)sulfate absorption band is not solely caused by the electric field (Stark effect), but includes about an addition shift of about 15 % from a change in coverage, due to adsorbate – adsorbate interactions.65 The clear correlation between the potential dependent increase of the intensity of the (bi‐)sulfate band and the water bending mode at ca. 1640 cm−1 indicates that these water species are coadsorbed with the (bi‐)sulfate anions, in full agreement with previous data obtained for Au film electrodes.63, 64 Furthermore, we plotted the integrated intensity of adsorbed (bi‐)sulfate in Figure 1a as a function of the electrode potential. In this case we chose a reference potential of 0.0 V, where no anions are adsorbed. The related IR spectra, obtained in the positive‐going scan, are shown in the Supporting Information in Figure S2a. The intensity of the anion peak increases at potentials >0.3 V and reaches saturation at ca. 0.8 to 1.1 V, in agreement with previous findings.63 At higher potentials this gradually decays to the background level due to increasing Au oxide formation. In the negative‐going scan the signal re‐appears with the onset of Au oxide reduction at potentials <1.2 V.
A similar sequence of spectra recorded in perchloric acid electrolyte (see Figure 5a) shows the same bands related to interfacial water, in addition to a band attributed to adsorbed perchlorate at ca. 1110 cm−1 (Figure 5a). Since the reference spectrum was acquired at 0.6 V, where the perchlorate is already adsorbed at the electrode, the absorption band at ca. 1110 cm−1 for the Cl−O band of the adsorbed perchlorate appears increasingly more negative at lower potentials, and, correspondingly, positive at higher potentials (Figure 4a). The frequency changes from ca. 1110 cm−1 at 0.0 V to ca. 1160 cm−1 at 1.2 V, in good agreement with the Stark shift of ca. 55 cm−1 V−1 reported earlier for specifically adsorbed perchlorate on a Au film electrode.66 Here we would like to note that for the water‐related stretch band there is essentially no intensity in the lower wavenumber region, below 3300 cm−1, in contrast to previous reports for this electrolyte.66, 67 Bands in this region had been attributed to O−H vibrations in an ice‐like interfacial water layer.66, 67 We explain this discrepancy by differences in the Au film morphology (annealed Au film here and sputter‐deposited, non‐annealed films in the above references) and the forced electrolyte convection used in the present study. The latter is expected to not only reduce the thickness of the diffusion layer, but also to hinder the formation of a structurally well‐defined ice‐like water layer in the vicinity of the electrode, compared to the stagnant electrolytes used previously. This would reduce the intensity in the lower wavenumber region (<3300 cm−1), in agreement with our present findings.
The positive water bending band at ca. 1640 cm−1 gradually increases with potential at values positive of 0.6 V, together with the increase of the adsorbed perchlorate band, closely resembling the behavior obtained for sulfuric acid electrolyte as discussed above. The integrated intensity of the adsorbed perchlorate related band, evaluated again for a reference potential of 0.0 V (spectra see Supporting Information, Figure S2b), is plotted as a function of the electrode potential in Figure 2a. This plot shows an increase in intensity at potentials >0.3 V, reaching saturation at ca. 0.8 to 1.1 V, in agreement with previous findings.66 Similar to the (bi‐)sulfate signal (Figure 1a), at higher potentials it gradually decays to the background level due to Au oxide formation. In the negative‐going scan the band re‐appears upon Au oxide reduction, where it rapidly increases in intensity, followed by a continuous decay to the background level, which is reached at ca. 0.2 V. Note that at this potential the band intensity of adsorbed (bi‐)sulfate is still substantial (Figure 1a), in agreement with the general idea of a stronger adsorption of the latter species compared to perchlorate.
Finally, in the spectra recorded in 1.0 M NaOH (Figure 6a), the bands related to interfacial water appear again, one at ca. 1605 cm−1 as in the acid electrolytes, while the other one is down‐shifted to 3290 cm−1. Note that in this case we used a reference potential of 0.9 V, which results in an inverse (positive) polarity of the water bending mode at 1605 cm−1. This is different in the ATR‐FTIR spectra using the spectrum 0.0 V as the reference in the Supporting Information (Figure S2c), where this band is negative and increases steadily with increasing potential, starting at ∼0.3 V. The integrated absorption band intensity over the water bending region, using the reference spectrum at 0.0 V, is plotted as a function of the electrode potential in Figure 3a. It shows a gradual decay at potentials positive of ca. 0.4 V, reaching the base line at ca. 1.2 V. In the reverse scan, the intensity response is fully reversible. It is important to note, that the potential response of the water bending mode correlates with the previously discussed pseudo‐capacitive features in the double‐layer region, which were assigned to the adsorption/desorption of the hydroxyl anions. Obviously, OH adsorption induces a displacement of interfacial water. In addition to these bands related to the Au‐electrolyte interface, an absorption band appears at ca. 1220 cm−1, which has previously been attributed to a Si−O stretch mode.68, 69 Apparently, the Si substrate can be accessed through the porous Au film (Figure 6a). Note that the position of this band is close to that commonly assigned to adsorbed peroxo species formed during the ORR.53, 54, 55, 70
Overall, our ATR‐FTIRS measurements in different supporting electrolytes show a potential‐dependence of the adsorbed anion and interfacial water stretching and bending modes, which is fully consistent with previous spectro‐electrochemical ATR‐FTIRS measurements of adsorbed anions and interfacial water at Au film electrodes.54, 64, 66, 67
Since electrosorption of OHad from H2O cannot be distinguished from the pseudocapacitive double‐layer charging current, we probed the onset of OHad formation on the annealed Au film electrode by bulk CO oxidation (CO oxidation reaction – COOR), assuming that the latter is mainly controlled by the onset of OHad formation, while COad is available. This resembles the approach used by Blizanac et al.30 The COOR in sulfuric acid solution sets in at potentials positive of ca. 0.5 V, increases and reaches a saturation rate at ca. 1.2 V due to the limited mass transport (Figure 1b). Upon AuO formation it decays again in the positive‐going scan and finally disappears, while in the backward scan the COOR re‐appears upon AuO reduction. Hence, at potentials positive of 0.5 V the electrode surface is increasingly covered not only by (bi‐)sulfate anions (see Figure 1a), but also by adsorbed hydroxyl species, which are required for bulk CO oxidation to CO2. Consequences for the ORR will be discussed later in section 2.2.
Similar measurements performed in perchloric acid solution (Figure 2b) show that also in this case the COOR sets in at ca. 0.5 V, but reaches the mass transport limited current already at lower potential, compared to the reaction in sulfuric acid based electrolyte (Figure 2a), where the (bi‐)sulfate adsorption hinders the OHad adsorption more strongly than the weakly adsorbing perchlorate. This results in a wider range of the mass transport limited current, ranging from ca. 1.0 to 1.3 V. At higher potentials the current gradually decays due to gold oxide formation (Figure 2b). Apparently, 0.5 V is the inherent limit for formation of OHad from acid electrolyte on polycrystalline Au electrodes. In the negative‐going scan the COOR re‐appears again with the reduction of gold oxide and decays at lower potentials, reaching negligible values at ca. 0.6 V (Figure 2b). This behavior is fully consistent with results of previous rotating disk electrode measurements for bulk CO oxidation over single crystal Au electrodes30, 36, 71 and flow‐cell measurements on an annealed Au film electrode.72
Finally, for bulk CO oxidation reaction in alkaline solution we find a broad mass transport limited regime, which ranges over ca. 0.9 V, from 0.4 V to 1.3 V and extends into the AuO region during the positive‐going scan (Figure 3b). This result fully agrees with previous findings for bulk CO oxidation over single crystal Au electrodes.30, 36, 71 Apparently, the COOR can proceed at reasonable rates even on a partly Au oxide covered electrode, which seems to indicate that CO can react chemically with the oxide, by reducing this, while the oxide is continuously reformed electrochemically. This would be comparable to previous findings for CO oxidation on (oxidized) Pt group metals.48, 73, 74, 75, 76, 77, 78 Due to the much higher OH− concentration in the electrolyte compared to the acid electrolytes, the COOR can start already at ca. 0.1 V (Figure 3b), and also the mass transport limited COOR rates are reached already at much lower potential, at about 0.4 V.
Overall, the COOR measurements show a potential‐dependence of the onset and saturation behavior of the COOR rate that indicates that the 0.5 V is the lower limit for OHad formation in reasonably strong acidic electrolytes. Site blocking due to an increasing coverage of adsorbed anions mainly affects the increase of the COOR current with increasing potential and thus the onset of mass transport limitations. This is reached at higher potential in the more strongly adsorbing sulfuric acid than in perchloric acid solution. The down‐shift of the onset potential by 0.4 V in alkaline solution, from 0.5 V to 0.1 V, can be explained by the fact that the concentration of OH− species in the electrolyte is by many orders of magnitude higher than in acidic solution, and that adsorption from OH− does not require an activated adsorption step as necessary for dissociative adsorption of water.
2.2. Potentiodynamic Oxygen Reduction
Potentiodynamic ORR measurements in O2‐saturated base electrolyte lead to the following results: In sulfuric acid supporting electrolyte (Figure 1c), the ORR sets in at ca. 0.6 V, matching both the decay in coverage of adsorbed (bi‐)sulfate, as evidenced from the in‐situ ATR‐FTIRS measurements of the integrated band intensity for adsorbed (bi‐)sulfate (Figure 1a), and from the decay in OHad coverage probed in the bulk CO oxidation reaction (Figure 1b). With decreasing potential the ORR current increases gradually, but does not reach saturation at the lower potential limit of 0.0 V. The latter behavior would be expected if the reaction were purely or mainly mass transport limited under these conditions. The observed potential dependence can indicate both kinetic limitations and/or a continuous variation in the reaction selectivity, changing from a two‐electron pathway to a four‐electron pathway (Figure 1c). To address this latter issue, we simultaneously monitored the current resulting from the oxidation of the hydrogen peroxide during the ORR at a second Pt working electrode, which was biased at 1.2 V. The hydrogen peroxide oxidation reaction (HPOR) current (Figure 1c), which was magnified by factor of 10 for better visibility, increases with decreasing Au electrode potential. It largely mirrors the ORR current, except for a small HPOR current decay at E<0.15 V, where the overall ORR current still increases. Obviously, there is a change in the ORR selectivity in that potential range. This is reflected also in the quantitative evaluation of the selectivity from the measured ORR and HPOR currents (Figure 1c), as explained in the Experimental section, which clearly demonstrate that two electron reduction to hydrogen peroxide dominates over a broad potential range, from the ORR onset at ca. 0.5 V to 0.2 V (Figure 1d). Only at potentials lower than 0.2 V, the selectivity for H2O2 formation decreases somewhat, in agreement with previous RDE data on the ORR at sputter‐deposited Au film electrodes in the same electrolyte.79 Finally, it should also be noted that the ORR currents in the positive‐ and negative‐going scan are essentially identical (Figure 1b), indicating that the composition and coverage of the adlayer at a given potential only depends on the potential and not on the scan direction (see also below in the discussion of the transient measurements).
Analogous measurements performed in perchloric acid solution (Figure 2c) show an earlier onset of the ORR at ca. 0.80 V, compared to ca. 0.60 V in sulfuric acid solution (Figure 1c). This is followed by a similar S‐shaped increase in the ORR current up to the lower potential limit. A similar onset potential was reported for the ORR at a square‐wave treated and thus structurally modified Au film in a stagnant O2‐saturated perchloric acid electrolyte.55 The resulting hydrogen peroxide oxidation current at the Pt collector electrode in perchloric acid electrolyte (Figure 2c) also largely mirrors the ORR current, however, with a smaller decay of the collector current at the lower potential limit compared to sulfuric acid solution (Figure 1c). In agreement with previous results and interpretations for other Au electrodes,3, 30 the about 0.20 V more positive onset of the ORR in perchloric acid vs. sulfuric acid electrolyte is assigned to a weaker adsorption and lower hence tendency for site blocking by perchlorate compared to (bi‐)sulfate anions.
The ORR selectivity in perchloric acid solution (Figure 2d, dashed lines), which was calculated from the measured overall ORR current and the current for the H2O2 oxidation at the collector electrode (Figure 2c, solid lines) (see Experimental section), shows that the ORR is dominated by the two‐electron reduction to H2O2 from the onset of the ORR down to 0.0 V, with slightly lower hydrogen peroxide production at potentials below 0.3 V, which fully agrees with previous observations for Au(100) electrodes.22, 23, 30, 61 Under these conditions the adsorbed perchlorate and OHad coverages are negligible (Figure 2a, d), thus this can hardly be related to anion‐induced site blocking.
For the ORR in alkaline electrolyte (1.0 M NaOH solution) the reaction characteristics change considerably (Figure 3c), with a generally improved performance compared to an acidic environment (Figs. 1c, 2c). The onset of the ORR shifts to ca. 1.0 V (Figure 3c), which is comparable to the shift reported for Au(100) electrodes in alkaline electrolyte.22, 23, 30, 61 This shift also allows to reach a mass transport limited current at about 0.6 V, i. e., at a potential where the ORR current in acidic electrolyte is essentially zero. After the initial increase of the ORR current and passing through a broad maximum between 0.6 and 0.4 V, it slightly decays at lower potentials to an about constant value up to the lower potential limit. The general ORR characteristics resemble more those of stepped Au single crystal electrodes24, 25 than those of Au(100), as the latter exhibit a much more pronounced activity maximum.22, 23, 30, 61 The most striking finding is that the peroxyl formation during the ORR sets is essentially negligible at the onset of the ORR, which reflects a high selectivity of the ORR for a four‐electron O2 reduction to hydroxyl anions in the range of low overpotentials (Figure 3d). Accordingly, the ORR selectivity, calculated from the overall ORR current and the current for peroxyl oxidation at the Pt collector electrode (Figure 3c, dashed lines) (see Experimental section), shows that the ORR proceeds at ca. 100 % selectivity for the four‐electron reduction to hydroxyl at the onset of the ORR at high potentials (Figure 3d). This finding is opposite to the ORR selectivity in acidic solutions, which is close to 100 % toward hydrogen peroxide formation (Figure 1d, 2d). On the other hand, this behavior perfectly agrees with the highly selective four‐electron oxygen reduction reported for Au(100)22, 23, 30, 61 and stepped Au single crystals24, 25 or preferentially shaped Au nanocrystals40, 42, 43 in alkaline medium.
Overall, these data demonstrate that the ORR at a Au film electrode proceeds predominantly to superoxides in acidic electrolytes, both in sulfuric and perchloric acid solutions, but with a lower activity in the presence of more strongly adsorbing anions. This fully agrees with previous findings.28 In alkaline electrolyte the Au film electrode exhibits a significantly higher activity, with the onset of the reaction up‐shifted by about 0.4/0.2 V compared to acidic electrolyte, in sulfuric acid/perchloric acid solution, and a with a high selectivity for the four‐electron pathway at high electrode potentials, comparable to those reported for Au(100) and stepped Au electrodes,22, 23, 24, 26‐41 preferentially shaped Au nanocrystals,40, 42, 43 specifically treated polycrystalline Au films.43, 44, 45
2.3. Potentiostatic Oxygen Reduction Transients
To disentangle potential and time effects, we measured transients of the ORR and HPOR currents at different constant Au film electrode potentials between 0.0 and 0.5 V upon switching from N2‐saturated to O2‐saturated electrolyte, and calculated hydrogen peroxide yields/selectivities in these transients (Figure 7, S2, S3). In the sulfuric acid supporting electrolyte (Figure 7a) the ORR and HPOR approach ca. 90 % of the steady‐state currents within ca. 10 s after switching between the electrolytes, which essentially reflects the time required for the complete electrolyte exchange. This means, that adsorption processes governing or at least affecting the ORR activity are very fast on this time scale. Afterwards the currents remain constant (Figure 7a), which confirms also the absence of any contaminations that could modify the ORR activity and selectivity and thus a clean reaction environment.
Figure 7.
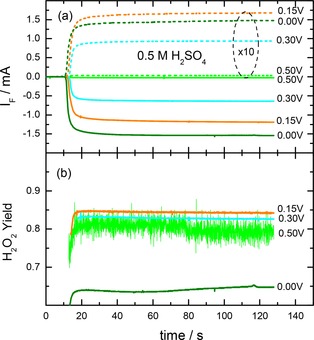
Potentiostatic current transients of a) the ORR and the HPOR and b) the resulting relative H2O2 yield in O2‐saturated sulfuric acid base electrolyte on the annealed Au film electrode at different potentials (0.5 M H2SO4, electrolyte flow rate ca. 40 μl s−1). The current transients were recorded upon switching from the O2‐free supporting electrolyte to O2‐saturated electrolyte at constant potential. For similar transients in HClO4 and NaOH electrolyte see Figures S3 and S4 in the Supporting Information.
Similar to the potentiodynamic measurements discussed above, the steady‐state ORR currents at constant potentials show a gradual increase with decreasing potential, whereas the HPOR increases until to 0.15 V, followed by a slight decrease at 0.0 V. The steady‐state current values of the ORR and the HPOR, which are plotted in Figure 1c as open symbols, and the calculated ORR selectivity (Figure 1d, filled symbols) perfectly match with the corresponding currents and the ORR selectivity in the potentiodynamic measurements (lines in Figure 1c), indicating that the potentiodynamic data essentially reflect steady‐state situations. This also agrees perfectly with the observation of hysteresis‐free ORR and HPOR currents, with the current traces essentially being on top of each other in the positive‐ and negative‐going potentiodynamic scans. For the adsorbed species this means that the composition and coverage of the adlayer at a given potential only depends on the electrode potential rather than on the scan direction or the scan rate (10 mV s−1 used in the potentiodynamic scans). The hydrogen peroxide yield, calculated from the HPOR and ORR current transients (Figure 7b), ranges at about 80 to 85 % at potentials 0.5 to 0.15 V, and decays to ca. 65 % at 0.0 V.
ORR and HPOR current transients recorded in perchloric acid electrolyte are plotted in Figure S2a, the steady‐state ORR and HPOR currents are included as open symbols in Figure 3c for comparison with the corresponding potentiodynamic currents. The general characteristics of the transients closely resemble those recorded in sulfuric acid electrolyte, with the only difference that the ORR onset appears at ca. 0.25 V more positive potential than in sulfuric acid, as expected from the potentiodynamic data. The steady‐state values of the ORR and HPOR currents and of the selectivity again agree perfectly with the potentiodynamic data, meaning that also in this electrolyte the potential dependent adlayer composition is equal in both experiments and hence independent of the scan rate. Similar to the ORR in sulfuric acid electrolyte, the ORR is also governed by the two‐electron reduction to hydrogen peroxide, with selectivities of ca. 83 % at 0.5 and 0.3 V, which decay to ca. 77 and 66 % at 0.15 and 0.0 V, respectively.
Finally, also the ORR and HPOR current transients recorded in O2‐saturated alkaline electrolyte show a fast increase of the ORR current to the steady‐state values (Figure S3a). Also in this case the steady‐state currents perfectly match the corresponding values obtained in the potentiodynamic measurements (see open symbols in Figure 3c). The same is true for the peroxyl yields calculated from the above steady‐state current transients, which increase from below 1 % at 0.9 V to ca. 60 % at 0.0 V, and the ORR selectivity calculated from the steady state currents transients (Figure 3d, filled symbols).
In summary, these results clearly indicate that in all three electrolytes anion adsorption/desorption processes are very fast on the time scale of the experiments, reaching quickly steady state conditions. As a result, the ORR steady‐state characteristics, mainly the ORR and HPOR currents and the selectivity fully resemble the results obtained in the potentiodynamic measurements, which were presented and discussed in the previous section 2.2.
2.4. In Situ ATR‐FTIR Spectroscopy during the ORR
For more information on the anion adsorption under ORR reaction conditions we performed in situ ATR‐FTIRS measurements during potentiodynamic scans in the different electrolytes. Sequences of spectra similar to those recorded in O2‐free base electrolyte, which were presented in Figs. 4a, 5a and 6a, are shown in Figs. 4b, 5b and 6b. For better comparison, the spectra are normalized in the same way as before, using also the spectra recorded in O2‐free electrolyte at 0.6/0.9 V (0.6 V in acidic solutions and 0.9 V in alkaline electrolyte), which were recorded before changing to the O2‐saturated electrolyte, as reference. In general, there is little difference in the two sets recorded in O2‐free and O2‐saturated electrolyte, with the following exceptions.
The ATR‐FTIR spectra recorded in O2‐saturated sulfuric acid electrolyte (Figure 4b) show in general spectral features similar to those obtained in O2‐free supporting electrolyte (Figure 4a), namely, the water stretching and bending modes and, dominant, the broad absorption band of adsorbed (bi‐)sulfate from ca. 1100 to ca. 1190 cm−1. Variations in these signals result from potential‐induced variations of the adsorption configuration and coverage.55, 63 Please note that for better comparison of the ATR‐FTIR spectra recorded in O2‐free and O2‐saturated electrolyte the scales were adjusted to about similar size of the (bi‐)sulfate bands in the two sets. Compared to the spectra shown in Figure 4a, the spectra in Figure 4b mainly differ by the appearance of a very weak band at ca. 1220 cm−1, in the potential range below 0.4 V. Since this band is absent in the O2‐free supporting electrolyte, it should be attributed to species produced during the ORR. A similar band had been detected earlier in ATR‐FTIR spectra recorded during the ORR at a Au film electrode in a stagnant electrolyte and assigned to adsorbed HO2 intermediates.54, 55
Similar spectra recorded during the positive‐going scan in O2‐saturated perchloric acid electrolyte (Figure 5b) also largely resemble those recorded during potentiodynamic scans in O2‐free electrolyte (Figure 5a). Also in this case the spectra were scaled to similar sizes of the adsorbed perchlorate bands. Careful inspection of Figure 5b indicates the development of a weak absorption band centered at ca. 1220 cm−1 (next to the displaced adsorbed perchlorate) during the ORR at low potentials below 0.4 V. The wavenumber of this band agrees rather well with that of the IR absorption band of adsorbed HO2 intermediates in the ORR in sulfuric acid electrolyte at ca. 1220 cm−1..54, 55 In an earlier ATR‐FTIRS study of the ORR at a Au film electrode in acidic electrolyte a band at 1615 cm−1, which appeared concomitantly with the onset of the ORR, was assigned to ‘isolated water species’.55 Since both in our experiments (Figure 5a) and also in other studies66, 67 a water bending band at 1610 cm−1 was observed both in O2‐free and O2‐saturated electrolyte, it is not possible to identify contributions from ORR products to this band from the present data. Most prominent difference to the spectra recorded in O2‐free electrolyte is the broad ν OH band at ca. 3490 cm−1, which starting from about 0.6 V increases in intensity with decreasing potential, together with the increasing ORR current (Figure 5b). This is much stronger in intensity than in O2‐free electrolyte (Figure 5a). The increase in intensity of this band correlates with the oxygen reduction current (Figure 2c), although the exact nature of the species responsible for this band is not clear at present. It should also be noted that this band was not observed in sulfuric acid electrolyte, although (bi‐)sulfate adsorption would be negligible at the rather low potentials.
Finally, for the set of spectra recorded in O2‐saturated alkaline electrolyte (Figure 6b), we find rather similar spectral characteristics as obtained in O2‐free electrolyte (Figure 6a), except for new positive water bending and stretching bands at ca. 1654 and 3200 cm−1, which develop at higher potentials under ORR conditions. The origin of these bands is, however, not clear. If they were related to coadsorbed OHad and water, they should appear also in O2‐free electrolyte, which is not the case. If they were related to coadsorption of water and an ORR product, specifically OOHad ions (OHad should be present in any case in this electrolyte) this band should be absent in at potentials >1.0 V, which is also not the case. Finally we would like to note that the expected spectral features of adsorbed superoxide or peroxyl at ca. 1230 cm−1[53,54] cannot be observed because of the stronger Si−O band appearing at this wavenumber region in strongly alkaline solution (Figure 6a).
2.5. Mechanistic Aspects
The results of the electrochemical and in situ FTIRS measurements presented in the previous sections, which were obtained under identical and well controlled reaction conditions, together with results of earlier studies, lead to the following picture of the ORR over an annealed Au film electrode.
In general, the ORR has only little effect on the anion adsorption characteristics in all electrolytes investigated (sulfuric acid and perchloric acid solutions, sodium hydroxide solution), while the anions and the pH severely affect the ORR.
In acid electrolyte the ORR activity of the Au film electrode is inherently low, with the onset of the reaction at about 0.75 V. In the presence of strongly adsorbing anions such as (bi‐)sulfate the ORR is additionally hindered by site blocking effects, caused e. g., by adsorbed (bi‐)sulfate species, as directly probed by in‐situ ATR‐FTIRS, and possibly also by small amounts of coadsorbed OHad, which according to separate CO bulk oxidation measurements can form at potentials >0.5 V. This results in an additional down‐shift of the onset of the ORR to about 0.6 V. Under these conditions the ORR mainly proceeds via the 2‐electron pathway, with about 80 % selectivity for hydrogen peroxide formation over a wide potential range, in agreement with previous reports.25 The adsorbed anions have only little impact on the selectivity in acidic electrolyte. For reaction in acidic electrolyte this reaction behavior can be explained by a coupled proton‐electron transfer in the rate determining step,33 which is supported by the observation of a kinetic H/D isotope effect in the reaction under these conditions.35
The annealed Au film displays a very high activity in alkaline electrolyte, with the ORR starting already at low overpotentials, at about 1.0 V. It and reaches the mass transport limit already at 0.6 V, hence, under conditions where the surface is largely covered by adsorbed OH, as concluded from additional CO bulk oxidation experiments and reflected by the displacement of interfacial water. Under these conditions and at low overpotentials the reaction is highly selective for the 4‐electron pathway (OH− formation). The 2‐electron pathway (OOH− formation) contributes significantly only at lower potentials (<0.7 V)/higher overpotentials. Obviously, OHad does not block the surface for the ORR, but allows and even promotes the ORR in alkaline medium. This indicates a reaction mechanism where OHad is involved in the reaction, which at higher potentials/high OHad coverages results in the 4‐electron pathway, while at lower potentials/lower OHad coverages the 2‐electron pathway contributes increasingly. This reaction behavior closely resembles previous findings for Au(100) electrodes,22, 23, 30, 61 which would be consistent also with the report of Breuer et al., who based on STM observations concluded on a preferential (100) orientation of their annealed Au film.62 The difference in reaction mechanism compared to the ORR in acidic electrolyte is documented also by the absence of a kinetic H/D isotope effect in alkaline electrolyte at potentials close to the onset of the reaction, meaning that under these conditions there is no coupled proton‐electron transfer acting as rate limiting step.35
The four‐electron reduction process in alkaline electrolyte would be consistent with an outer sphere reaction process or, alternatively, with a reaction process where the adsorbed OHad species are directly involved in the reaction. In the former case, the OH adlayer can be considered to provide a suitable template for the reaction, stabilizing e. g., the reaction intermediates and reducing the kinetic barriers, but does not directly participate in it, at least not in the rate limiting step. This would be in agreement with the proposals for the ORR on Au(100) in alkaline electrolyte in a recent theoretical study.32 Alternatively, the OHad could be directly involved in the reaction, for instance, by interaction of the OHad moiety with the activated water molecule, enabling a proton transfer to an adsorbed superoxide, as proposed recently.37 In another study, the authors proposed that double‐bridge sites as present on Au(100) promote the dissociation of adsorbed OOH in the 4‐electron ORR in alkaline electrolyte.34 Essentially similar conclusions were reported recently also by Jensen et al.80
Considering these proposals, the potential dependent variation of the ORR selectivity at a Au film electrode in alkaline electrolyte, from a 4‐electron pathway at high potentials/low overpotentials to a 2‐electron pathway at low potentials/high overpotentials, could be assumed to depend on the OHad coverage, favoring the 4‐electron ORR for high OHad coverages, whereas at lower OHad coverages, upon interaction with a single OHad species and a bare Au site, the ORR will procced via the 2‐electron reduction. The latter would resemble more the situation in acid electrolyte, only with a different anion. In that case, the ORR in alkaline medium can, in a simplified, formal scheme, be described as follows:
Simply, the overall reaction is split into two reaction steps, first adsorption of OH and then stabilization of adsorbed O2 by coadsorbed OH, which enhances the O2,ad dissociation. In the high potential region the coverage of OHad is sufficient to make this reaction pathway dominant, while in the low potential region (high overpotentials) this is no more the case and the 2‐electron pathway can contribute increasingly. Although we have no direct proof for such reaction pathway, it not only properly describes the decreasing selectivity for the 4‐electron pathway with decreasing potential/increasing overpotentials, but also agrees well with recent proposals and conclusions from theory. Li et al. proposed that the dissociation of adsorbed O2 is assisted by (two) coadsorbed OHad species, which they claimed explains the exceptional ORR activity and selectivity of Au(100) in alkaline electrolyte.34 A change in the ORR selectivity from four to two electron oxygen reduction due to a stabilization of the OOH intermediate by adsorbed OH was proposed recently also by Duan and Henkelman for Au(100).81
Finally, the generally good agreement between positive‐going and negative‐going scan and also with the data obtained in potentiostatic electrolyte exchange experiments, under steady‐state conditions point to a highly dynamic adlayer, which is solely determined by the potential and not by the history how this was reached. This is different from the Pt oxide formation /reduction, which exhibits a significant hysteresis.17, 18
In total, we could derive detailed correlations between the ORR reaction characteristics and the anion adsorption properties on an annealed Au film electrode in different electrolytes, including their dynamic changes. The insights gained demonstrate the potential of such kind of in situ spectro‐electrochemical studies performed under well‐controlled reaction and transport conditions.
3. Summary
From the results of a combined electrochemical and in situ IR spectroscopic study of the ORR at a Au film electrode in acidic (sulfuric or perchloric acid solutions) and alkaline (sodium hydroxide solutions) electrolyte, performed under continuous controlled electrolyte mass transport and with a collector electrode allowing for simultaneous detection of oxidizable products such as hydrogen peroxide, we arrived at a comprehensive picture of this reaction. While the ORR has little effect on the anion adsorption characteristics, this is different in the opposite direction: anion adsorption and pH have a strong effect on the ORR. Differences in the ORR in the different electrolytes can largely be rationalized by anion adsorption effects. In acidic electrolyte, strongly adsorbed (bi‐)sulfate anions block the surface at potentials where the ORR would be inherently active, as indicated by measurements in perchloric acid electrolyte. The high activity for the 4‐electron pathway in alkaline electrolyte is tentatively associated with a densely packed OHad adlayer, which can serve as template for the ORR, possible via an outer sphere ORR process, while at lower potentials and thus lower OHad coverages the reaction proceeds via interaction between O2,ad and Au substrate site, possibly stabilized by interaction with a single OHad species. In total, we could derive a detailed picture of correlations between the ORR reaction characteristics and the anion adsorption properties on a Au film electrode in different electrolytes, including their dynamic changes.
Experimental Details
A thin (∼50 nm) Au film was fabricated on the face plane of a hemi‐cylindrical Si prism by Au electroless deposition at room temperature, following a modified version of the procedure described in .82 The resulting surface was carefully annealed in a butane flame, in an approach derived from a previous one.83 For the annealing procedure the prism was placed face down in a glass cylinder, supported at the corners by the glass walls. The cylinder was continuously flushed with N2 to avoid overheating that could result in gold silicide formation. The Au film was structurally characterized by scanning electron microscopy imaging, using a Zeiss‐Leo‐1550 instrument. The Au film covered Si prism (exposed are of ca. 1 cm2) was installed in a dual spectro‐electrochemical thin‐layer flow cell,48 which is equipped with a Pt collector electrode (biased at 1.2 V for the ORR measurements) located downstream for simultaneous detection of hydrogen peroxide formation.49, 50 The cell contains two Pt counter electrodes, one at the inlet and one at the outlet of the cell, a reversible hydrogen electrode served as reference. A collection efficiency of ca. 20 % was determined for H2 evolution on the Au film generator electrode and evolved hydrogen oxidation on a Pt collector electrode biased at 0.4 V in separate potential step experiments. The quantitative evaluation for calculating the peroxide yield Y in the ORR was similar to that used in a Rotating Ring Disk Electrode configuration17
where I(d) and I(r) denote the measured disk and ring currents, respectively, and N is the collection efficiency. A computer interfaced bi‐potentiostat (model AFRDE5, Pine Instruments) was used to control the potential of the working electrode and for the data acquisition. The thin‐layer flow cell was installed within a home made mirror accessory path in the sample chamber of a Varian 670i FTIR spectrometer, which was equipped with a p‐polarizer and a liquid N2 cooled mercury cadmium telluride detector (for details see72). The IR intensities are plotted as absorbance, log(R0/R), where R0 and R describe the reflectance at the reference potential and sample potential (potentiodynamic measurements), or in O2‐free and O2‐saturated electrolyte at the same potential (electrolyte exchange measurements), respectively. N2 (Westfalen Gas, N4.8), CO (Westfalen Gas, N4.7) or O2 (Westfalen Gas, N6.0) saturated solutions of 0.5 M sulfuric (Merck, Suprapur), 1.0 M perchloric (Merck, Suprapur) acids or 1.0 M sodium hydroxide (Sigma‐Aldrich, semiconductor grade) in Millipore MilliQ water (>18.2 MΩ cm) were used as a supporting electrolyte, CO bulk oxidation or oxygen reduction experiments under continuous flow of electrolytes. For Pb‐upd measurements PbO (Alfa Aesar, 99.99 %) was dissolved in 1.0 M HClO4 to reach 1.0 mM concentration of Pb2+ ions.
Conflict of interest
The authors declare no conflict of interest.
Supporting information
As a service to our authors and readers, this journal provides supporting information supplied by the authors. Such materials are peer reviewed and may be re‐organized for online delivery, but are not copy‐edited or typeset. Technical support issues arising from supporting information (other than missing files) should be addressed to the authors.
Supplementary
Acknowledgements
The authors are grateful to A. Minkow (Institute of Micro‐ and Nanomaterials, Ulm University) for SEM measurements. ZJ acknowledges financial support from the German Federal Ministry of Education and Research (BMBF) in the projects 03X4636C and 03EK3051C This work contributes to the research performed at CELEST (Center for Electrochemical Energy Storage Ulm‐Karlsruhe).
Z. Jusys, R. J. Behm, ChemPhysChem 2019, 20, 3276.
References
- 1. Müller L., Nekrassow L., Electrochim. Acta 1964, 9, 1015–1023. [Google Scholar]
- 2. Wroblowa H., Pan Y.-C., Razumney G., J. Electroanal. Chem. 1964, 69, 195–201. [Google Scholar]
- 3.Adzic R. R. Electrocatalysis; Wiley-VCH, Inc.: New York, 1998; Chapter 5, pp. 197–242.
- 4. Markovic N. M., P. N. Ross Jr. , Interfacial Electrochemistry, Theory, Experiment and Applications; Marcel Dekker: New York, 1999; p. 821. [Google Scholar]
- 5. Markovic N. M., P. N. Ross Jr. , Surf. Sci. Rep. 2002, 45, 117–229. [Google Scholar]
- 6. Norskov J. K., Rossmeisl J., Logadottir A., Lindqvist L. R. K. J., Kitchin J. R., Bligaard T., Jonsson H., J. Phys. Chem. B 2004, 108, 17886–17892. [Google Scholar]
- 7. Janik M. J., Taylor C. D., Neurock M., J. Electrochem. Soc. 2009, 156, B126-B135. [Google Scholar]
- 8. Greeley J., Nørskov J. K., J. Phys. Chem. C 2009, 113, 4932–4939. [Google Scholar]
- 9. Nilekar A. U., Xu Y., Zhang J., Vukmirovic M. B., Sasaki K., Adzic R. R., Mavrikakis M., Top. Catal. 2007, 46, 276–284. [Google Scholar]
- 10. Keith J. A., Jacob T., Angew. Chem. Int. Ed. 2010, 49, 9521–9525; [DOI] [PubMed] [Google Scholar]; Angew. Chem. 2010, 122, 9711–9716. [Google Scholar]
- 11. Viswanathan V., Hansen H. A., Rossmeisl J., Jaramillo T. F., Pitsch H., Nørskov J. K., J. Phys. Chem. C 2012, 116, 4698–4704. [Google Scholar]
- 12. Viswanathan V., Hansen H. A., Rossmeisl J., Nørskov J. K., J. Phys. Chem. Lett. 2012, 3, 2948–2951. [DOI] [PubMed] [Google Scholar]
- 13. Adzic R., Wang J. X., Electrochim. Acta 2000, 45, 4203–4210. [Google Scholar]
- 14. Wang J. X., Markovic N. M., Adzic R. R., J. Phys. Chem. B 2004, 108, 4127–4133. [Google Scholar]
- 15. Stamenkovic V. R., Fowler B., Mun B. S., Wang G., Ross P. N., Lucas C. A., Markovic N. M., Science 2007, 315, 493–497. [DOI] [PubMed] [Google Scholar]
- 16. Stamenkovic V. R., Mun B. S., Arenz M., Mayrhofer K. J. J., Lucas C. A., Wang G., Ross P. N., Markovic N. M., Nat. Mater. 2007, 6, 241–247. [DOI] [PubMed] [Google Scholar]
- 17. Paulus U. A., Schmidt T. J., Gasteiger H. A., Behm R. J., J. Electroanal. Chem. 2001, 495, 134–145. [Google Scholar]
- 18. Paulus U. A., Wokaun A., Scherer G. G., Schmidt T. J., Stamenkovic V., Radmilovic V., Markovic N. M., P. N. Ross Jr. , J. Phys. Chem. B 2002, 106, 4181–4191. [Google Scholar]
- 19. Genshaw M. A., Damjanovic A., Bockris J. O., J. Electroanal. Chem. 1967, 15, 163–172. [Google Scholar]
- 20. Frumkin A. N., Nekrasov L., Levich V. G., Ivanov J., J. Electroanal. Chem. 1959, 1, 84–90. [Google Scholar]
- 21. Damjanovic A., Genshaw M. A., Bockris J. O., J. Electrochem. Soc. 1967, 114, 466–472. [Google Scholar]
- 22. Markovic N. M., Adic R. R., Vesovic V. B., J. Electroanal. Chem. Interfacial Electrochem. 1984, 165, 121–133. [Google Scholar]
- 23. Adic R. R., Markovic N. M., Vesovic V. B., J. Electroanal. Chem. Interfacial Electrochem. 1984, 165, 105–120. [Google Scholar]
- 24. Anastasijevic N. A., Strbac S., Adzic R. R., J. Electroanal. Chem. Interfacial Electrochem. 1988, 240, 239–252. [Google Scholar]
- 25. Strbac S., Adzic R. R., J. Electroanal. Chem. 1996, 403, 169–181. [Google Scholar]
- 26. Markovic N. M., Ross P. N., J. Electrochem. Soc. 1994, 141, 2590–2598. [Google Scholar]
- 27. Strbac S., Adzic R. R., Electrochim. Acta 1996, 41, 2903–2908. [Google Scholar]
- 28. Prieto A., Hernandez J., Herrero E., Feliu J. M., J. Solid State Electrochem. 2003, 7, 599–606. [Google Scholar]
- 29. Xu Y., Mavrikakis M., J. Phys. Chem. B 2003, 107, 9298–9307. [Google Scholar]
- 30. Blizanac B. B., Lucas C. A., Gallagher M. E., Arenz M., Ross P. N., Markovic N. M., J. Phys. Chem. B 2004, 108, 625–634. [Google Scholar]
- 31. Kim J., Gewirth A. A., J. Phys. Chem. B 2006, 110, 2565–2571. [DOI] [PubMed] [Google Scholar]
- 32. Quaino P., Luque N. B., Nazmutdinov R., Santos E., Schmickler W., Angew. Chem. Int. Ed. 2012, 51, 12997–13000; [DOI] [PubMed] [Google Scholar]; Angew. Chem. 2012, 124, 13171–13174. [Google Scholar]
- 33. Koper M. T. M., Chem. Sci. 2013, 4, 2710–2723. [Google Scholar]
- 34. Li H., Li Y., Koper M. T. M., Calle-Vallejo F., J. Am. Chem. Soc. 2014, 136, 15694–15701. [DOI] [PubMed] [Google Scholar]
- 35. Mei D., Da He Z., Zheng Y. L., Jiang D. C., Chen Y. X., Phys. Chem. Chem. Phys. 2014, 16, 13762–13773. [DOI] [PubMed] [Google Scholar]
- 36. Rodriguez P., Koper M. T. M., Phys. Chem. Chem. Phys. 2014, 16, 13583–13594. [DOI] [PubMed] [Google Scholar]
- 37. Staszak-Jirkovsky J., Subbaraman R., Strmcnik D., Harrison K. L., Diesendruck C. E., Assary R., Frank O., Kobr L., Wiberg G. K. H., Genorio B., Connell J. G., Lopes P. P., Stamenkovic V., Curtiss L., Moore J. S., Zavadil K. R., Markovic N. M., ACS Catal. 2015, 5, 6600–6607. [Google Scholar]
- 38. Ignaczak A., Nazmutdinov R., Goduljan A., de Campos Pinto L. M., Juarez F., Quaino P., Santos E., Schmickler W., Nano Energy 2016, 29, 362–368. [Google Scholar]
- 39. Ignaczak A., Nazmutdinov R., Goduljan A., de Campos Pinto L. M., Juarez F., Quaino P., Belletti G., Santos E., Schmickler W., Electrocatalysis 2017, 8, 554–564. [Google Scholar]
- 40. Lu F., Zhang Y., Liu S., Lu D., Su D., Liu M., Zhang Y., Liu P., Wang J. X., Adzic R. R., J. Am. Chem. Soc. 2017, 139, 7310–7317. [DOI] [PubMed] [Google Scholar]
- 41. Kulkarni A., Siahrostami S., Patel A., Nørskov J. K., Chem. Rev. 2018, 118, 2302–2312. [DOI] [PubMed] [Google Scholar]
- 42. Hernandez J., Solla-Gullón H., Herrero E., J. Electroanal. Chem. 2004, 574, 185–196. [Google Scholar]
- 43. Min X., Chen Y., Kanan M. W., Phys. Chem. Chem. Phys. 2014, 16, 13601–13604. [DOI] [PubMed] [Google Scholar]
- 44. Paliteiro C., Martins N., Electrochim. Acta 1998, 44, 1359–1368. [Google Scholar]
- 45. Srejic I., Smiljanic M., Rakocevic Z., Strbac S., Int. J. Electrochem. Sci. 2016, 11, 10436–10448. [Google Scholar]
- 46. Schneider A., Colmenares L., Seidel Y. E., Jusys Z., Wickman B., Kasemo B., Behm R. J., Phys. Chem. Chem. Phys. 2008, 10, 1931–1943. [DOI] [PubMed] [Google Scholar]
- 47. Seidel Y. E., Schneider A., Jusys Z., Wickman B., Kasemo B., Behm R. J., Faraday Discuss. 2008, 140, 167–184. [DOI] [PubMed] [Google Scholar]
- 48. Heinen M., Chen Y. X., Jusys Z., Behm R. J., Electrochim. Acta 2007, 52, 5634–5643. [Google Scholar]
- 49. Jusys Z., Kaiser J., Behm R. J., Electrochim. Acta 2004, 49, 1297–1305. [Google Scholar]
- 50. Heider E., Jusys Z., Behm R. J., Jörissen L., Zeis R., J. Phys. Chem. C 2015, 119, 18859–18869. [Google Scholar]
- 51. Adzic R. R., Markovic N. M., Vesovic V. B., J. Electroanal. Chem. Interfacial Electrochem. 1984, 165, 105–120. [Google Scholar]
- 52. Brooker J., Christensen P. A., Hamnett A., He R., Paliteiro C. A., Faraday Discuss. 1992, 94, 339–360. [Google Scholar]
- 53. Shao M. H., Adzic R. R., J. Phys. Chem. B 2005, 109, 16563–16566. [DOI] [PubMed] [Google Scholar]
- 54. Ohta N., Nomura K., Yagi I., J. Phys. Chem. C 2012, 116, 14390–14400. [Google Scholar]
- 55. Chen D. J., Xu B., Sun S.-G., Tong Y. Y., Catal. Today 2012, 182, 46–53. [Google Scholar]
- 56. Li X., Gewirth A. A., J. Am. Chem. Soc. 2003, 125, 7086–7099. [DOI] [PubMed] [Google Scholar]
- 57. Hamelin A., Martins A. M., J. Electroanal. Chem. 1996, 407, 13–21. [Google Scholar]
- 58. Hamelin A., Sottomayor M. J., Silva F., Chang S. C., Weaver M. J., J. Electroanal. Chem. Interfacial Electrochem. 1990, 295, 291–300. [Google Scholar]
- 59. Angerstein-Kozlowska H., Conway B. E., Hamelin A., Stoicoviciu L., Electrochim. Acta 1986, 31, 1051–1061. [Google Scholar]
- 60. Hamelin A., J. Electroanal. Chem. 1996, 407, 1–11. [Google Scholar]
- 61. Schmidt T. J., Stamenkovic V., Arenz M., Markovic N. M., P. N. Ross Jr. , Electrochim. Acta 2002, 47, 3765–3776. [Google Scholar]
- 62. Breuer N., Funtikov A. M., Stimming U., Vogel R., Surf. Sci. 1995, 335, 145–154. [Google Scholar]
- 63. Ataka K., Osawa M., Langmuir 1998, 14, 951–959. [Google Scholar]
- 64. Garcia-Araez N., Rodriguez P., Navarro V., Bakker H. J., Koper M. T. M., J. Phys. Chem. C 2011, 115, 21249–21257. [Google Scholar]
- 65. Pfisterer J. H. K., Zhumaev U. E., Cheuquepan W., Feliu J. M., Domke K. F., J. Chem. Phys. 2019, 150, 041709. [DOI] [PubMed] [Google Scholar]
- 66. Ataka K., Yotsuyangi T., Osawa M., J. Phys. Chem. B 1996, 100, 10664–10672. [Google Scholar]
- 67. Garcia-Araez N., Rodriguez P., Bakker H. J., Koper M. T. M., J. Phys. Chem. C 2012, 116, 4786–4792. [Google Scholar]
- 68. Philipsen H. G. G., Ozanam F., Allongue P., Kelly J. J., Chazalviel J. N., J. Electrochem. Soc. 2016, 163, H327-H338. [Google Scholar]
- 69. Morhart T. A., Unni B., Lardner M. J., Burgess I. J., Anal. Chem. 2017, 89, 11818–11824. [DOI] [PubMed] [Google Scholar]
- 70. Shao M. H., Liu P., Adzic R. R., J. Am. Chem. Soc. 2006, 128, 7408–7409. [DOI] [PubMed] [Google Scholar]
- 71. Blizanac B. B., Arenz M., Ross P. N., Markovic N. M., J. Am. Chem. Soc. 2004, 126, 10130–10141. [DOI] [PubMed] [Google Scholar]
- 72. Jusys Z., Behm R. J., J. Electroanal. Chem. 2017, 800, 60–76. [Google Scholar]
- 73. Stonehart P., J. Electroanal. Chem. 1967, 15, 239–244. [Google Scholar]
- 74. Bergelin M., Herrero E., Feliu J. M., Wasberg M., J. Electroanal. Chem. 1999, 467, 74–84. [Google Scholar]
- 75. Koper M. T. M., Schmidt T. J., Markovic N. M., Ross P. N., J. Phys. Chem. B 2001, 105, 8381–8386. [Google Scholar]
- 76. Mayrhofer K. J. J., Arenz M., Blizanac B. B., Stamenkovic V., Ross P. N., Markovic N. M., Electrochim. Acta 2005, 50, 5144–5154. [Google Scholar]
- 77. Manzhos R. A., Maksimov Y., Podlovchenko B. I., Russ. J. Electrochem. 2005, 41, 832–837. [Google Scholar]
- 78. Zhang D., Deutschmann O., Seidel Y. E., Behm R. J., J. Phys. Chem. C 2011, 115, 468–478. [Google Scholar]
- 79. Sarapuu A., Tammeveski K., Tenno T. T., Sammelselg V., Kontturi K., Schiffrin D. J., Electrochem. Commun. 2001, 3, 446–450. [Google Scholar]
- 80. Jensen K. D., Tymoczko J., Rossmeisl J., Bandarenka A. S., Chorkendorff I., Escudero-Escribano M., Stephens I. E. L., Angew. Chem. Int. Ed. 2018, 57, 2800–2805; [DOI] [PubMed] [Google Scholar]; Angew. Chem. 2018, 130, 2850–2855. [Google Scholar]
- 81. Duan Z., Henkelman G., ACS Catal. 2019, 9, 5567–5573. [Google Scholar]
- 82. Miyake H., Ye S., Osawa M., Electrochem. Commun. 2002, 4, 973–977. [Google Scholar]
- 83. Nogues C., Wanunu M., Surf. Sci. 2004, 573, L383-L389. [Google Scholar]
Associated Data
This section collects any data citations, data availability statements, or supplementary materials included in this article.
Supplementary Materials
As a service to our authors and readers, this journal provides supporting information supplied by the authors. Such materials are peer reviewed and may be re‐organized for online delivery, but are not copy‐edited or typeset. Technical support issues arising from supporting information (other than missing files) should be addressed to the authors.
Supplementary