

Abstract
Background
The ‘Prediction Of Survival in Advanced Sorafenib‐treated HCC’ (PROSASH) model addressed the heterogeneous survival of patients with hepatocellular carcinoma (HCC) treated with sorafenib in clinical trials but requires validation in daily clinical practice. This study aimed to validate, compare and optimize this model for survival prediction.
Methods
Patients treated with sorafenib for HCC at five tertiary European centres were retrospectively staged according to the PROSASH model. In addition, the optimized PROSASH‐II model was developed using the data of four centres (training set) and tested in an independent dataset. These models for overall survival (OS) were then compared with existing prognostic models.
Results
The PROSASH model was validated in 445 patients, showing clear differences between the four risk groups (OS 16.9‐4.6 months). A total of 920 patients (n = 615 in training set, n = 305 in validation set) were available to develop PROSASH‐II. This optimized model incorporated fewer and less subjective parameters: the serum albumin, bilirubin and alpha‐foetoprotein, and macrovascular invasion, extrahepatic spread and largest tumour size on imaging. Both PROSASH and PROSASH‐II showed improved discrimination (C‐index 0.62 and 0.63, respectively) compared with existing prognostic scores (C‐index ≤0.59).
Conclusions
In HCC patients treated with sorafenib, individualized prediction of survival and risk group stratification using baseline prognostic and predictive parameters with the PROSASH model was validated. The refined PROSASH‐II model performed at least as good with fewer and more objective parameters. PROSASH‐II can be used as a tool for tailored treatment of HCC in daily practice and to define pre‐planned subgroups for future studies.
Keywords: hepatocellular carcinoma, model, prediction, prognosis, sorafenib, survival
Abbreviations
- 95% CI
95% confidence interval
- AIC
akaike information criterion
- ALBI
albumin‐bilirubin
- APF
alpha‐foetoprotein
- AST
asparatate transaminase
- BCLC
barcelona clinic liver cancer
- CT
computed tomography
- DCP
des‐gamma‐carboxyprothrombin
- ECOG PS
Eastern Cooperative Oncology Group performance status
- HAP
hepatoma arterial‐embolization prognostic
- HCC
hepatocellular carcinoma
- JIS
Japan Integrated Staging (JIS) score
- LR
likelihood ratio
- MRI
magnetic resonance imaging
- NLR
neutrophil‐to‐lymphocyte ratio
- OS
overall survival
- PROSASH
Prediction Of Survival in Advanced Sorafenib‐treated Hepatocellular carcinoma
- SAP
sorafenib advanced hepatocellular carcinoma prognostic
- SD
standard deviation
- SIRT
selective internal radiation therapy
Key Points.
Patients with incurable liver cancer (hepatocellular carcinoma) can be treated with sorafenib to expand their life expectancy, but the prognosis with this drug varies between patients.
In this large international study, we tested and further improved a statistical method that allows clinicians to estimate the survival chances of an individual patient.
This facilitates the communication with the patient when considering this treatment and will help further research to find better drugs.
1. INTRODUCTION
Hepatocellular carcinoma (HCC) is the most common primary liver cancer and the second leading cause of cancer‐related death worldwide.1 Most patients with HCC present with, or eventually progress to, advanced stage disease which bears a poor prognosis. Sorafenib, a multikinase inhibitor, was the first treatment to show a survival benefit in patients with advanced stage HCC. In two randomized‐controlled trials, sorafenib improved the median overall survival (OS) by 2‐3 months compared with placebo.2, 3 Since then, sorafenib has been the standard treatment for patients with advanced stage HCC who are ineligible for loco‐regional treatment and have preserved (Child‐Pugh A) liver function.
However, there is significant heterogeneity in outcomes in patient treated with sorafenib with an OS ranging from <3 months to 2‐3 years.2, 3, 4 This indicates that the survival benefit offered by sorafenib varies between individual patients. Select subgroups may have similar or more benefit from alternative options such as lenvatinib,5 best supportive care or clinical trials.
The variety in survival is inadequately captured by the currently available staging systems (ie Barcelona Clinic Liver Cancer [BCLC]). Therefore, guidelines have recommended exploration of further stratification of patients with intermediate (BCLC‐B) and advanced stage HCC (BCLC‐C).6 Previous studies have identified markers of liver function (ie albumin, bilirubin), clinical parameters (ie performance status, body composition) and tumour characteristics (ie alpha‐foetoprotein [AFP], macrovascular invasion, tumour extent) that may aid in prognostic stratification prior to sorafenib treatment.7, 8, 9, 10, 11, 12, 13, 14, 15 Predictive factors, that is, those associated with improved survival benefit over placebo, included absence of extrahepatic spread, presence of hepatitis C virus and a low neutrophil‐to‐lymphocyte ratio (NLR).16 Based on the combination of baseline factors, several scoring systems have been proposed for survival stratification of patients with advanced HCC treated with sorafenib.17, 18, 19, 20 Limitations of these models include the use of factors that either have a degree of subjectivity (ie infiltrative tumour growth, ascites) or are not commonly available (ie Des‐gamma‐carboxyprothrombin [DCP]). A recently proposed model, the ‘Prediction Of Survival in Advanced Sorafenib‐treated HCC’ (PROSASH), provided individualized survival prediction with excellent risk group discrimination based on nine parameters (age, macrovascular invasion, extrahepatic spread, performance status, disease aetiology, albumin, creatinine, aspartate transaminase (AST) and AFP).21 The PROSASH model was built and validated on the data from patients treated with sorafenib in two clinical trials,22, 23 but has not yet been validated in patients treated in routine clinical practice. Multiple studies in various tumour types have underlined the limited applicability of data from the strictly selected and homogeneous patients treated in clinical trials to the more heterogeneous population in routine clinical practice.24, 25, 26, 27, 28 Moreover, the PROSASH model has not yet been compared with the currently existing prognostic scores (BCLC, Child‐Pugh). Consequently, it remains unknown whether this new model outperforms the existing models and whether risk stratification of sorafenib‐treated patients might be further refined using data from ‘real‐life’ patients.
Therefore, this study aimed to (1) validate the PROSASH model in HCC patients treated with sorafenib in daily clinical practice and (2) improve the PROSASH based on patients treated in clinical practice. Subsequently, PROSASH, the improved model (PROSASH‐II) and existing prognostic models were compared to determine the utility for clinicians to predict the survival of these patients.
2. MATERIALS AND METHODS
2.1. Study population
Patients with HCC treated with sorafenib were recruited consecutively at five tertiary European centres with specialist multidisciplinary services for HCC management: Bordeaux (n = 306) and Rennes (n = 129), France; Freiburg (n = 183), Germany; Amsterdam (n = 156) and Rotterdam (n = 167), the Netherlands. The data were collected after obtaining the relevant authorization from the institutional review boards and this retrospective study was performed under ethically approved protocols (REC reference 12/LO/1088 and W17_420#17.488). Patients were diagnosed with HCC by histological or radiological criteria in accordance with international guidelines.6, 29 Exclusion criteria included patients receiving combination treatments (ie selective internal radiation therapy [SIRT] with sorafenib) or those with an Eastern Cooperative Oncology Group performance status (ECOG PS) >2. Patients received sorafenib with a target dose of 400 mg BID, with toxicity‐adjusted dosing and patient management according to the local practice.
2.2. Data collection and outcomes
Commonly available clinical, imaging and serum variables prior to sorafenib treatment were collected by members of the research team. Imaging parameters were obtained from the most recent radiological imaging prior to first dose of sorafenib. Radiological staging included a multiphasic contrast‐enhanced computed tomography (CT) or dynamic magnetic resonance imaging (MRI). The main outcome measure, OS, was defined from the date of start of treatment to date of death or censored on the date of last follow‐up.
Patients were staged according to the PROSASH model.21 To assess whether improved prediction may be possible using data from daily practice, a new model was built and validated (PROSASH‐II, detailed below). The utility of both models was compared with existing prognostic scores that could be assessed in the dataset, including the BCLC staging system, Child‐Pugh classification, albumin‐bilirubin (ALBI) grade,30 Japan Integrated Staging (JIS) score,31 hepatoma arterial‐embolization prognostic (HAP)32 and the Sorafenib Advanced HCC Prognostic (SAP) score.18 With the exception of BCLC stage and Child‐Pugh classification, which are commonly used in daily practice and were coded by the individual investigators, all prognostic scores were calculated using the raw data.
2.3. Statistical methods
Continuous variables were described as means with standard deviation (SD) or medians with interquartile range in case of highly skewed distributions. Categorical variables were described as absolute and relative frequencies. The Kaplan‐Meier method was used to generate and compare survival curves, and to estimate median OS with 95% confidence interval (95% CI). For all analyses, a two‐tailed P < .05 was considered statistically significant. Statistical analysis was performed using SPSS Statistics for Windows Version 24.0 (IBM Corp) and STATA/SE 14.1 (StataCorp).
2.3.1. Model building, testing and external validation
For the building of a prognostic model from patients treated in daily practice, the data of four centres were clustered into a training dataset and the largest independent dataset (Bordeaux) was used as an external validation set. Baseline variables that were considered clinically relevant and available in both datasets were included in the model building process (Table S1). Highly skewed variables were log‐transformed. BCLC stage and Child‐Pugh grade were excluded from the model building process owing to multicollinearity with factors used in these scoring systems. Multiple imputations (10x) using chained equations were performed to account for missing key parameters that were missing at random in the training dataset.33, 34 Model performance, derived coefficients and P values of imputed data were compared with complete case data.
In the training set, the association between OS and baseline variables was assessed in an exploratory univariable and subsequent multivariable flexible parametric survival analysis.35, 36, 37 The advantages of a flexible parametric analysis over the more commonly used Cox proportional hazard analysis were previously described.21, 37 Risk factors were reported with hazard ratio (HR) and corresponding P values. The multivariable model was built using a stepwise forward selection procedure of variables significant at the 5% level. The model was reported according to the TRIPOD guidelines38 as well as tested, optimized and validated using the methods described by Royston and Altman.39 Any time‐dependent effects and potential proportional hazard violations by variables in the model were examined using the likelihood ratio (LR) test.37 The LR test was also used to optimize the degrees of freedom (number of knots) for the restricted cubic spline function.37 Lastly, Martingale residuals were plotted against continuous variables to check the functional form and non‐linearity.
A linear predictor was derived using the coefficients of the model variables. Four risk groups were generated by applying the previously suggested cut‐offs at the 16th, 50th and 84th centiles of the training set's linear predictor.39 The model, including the linear predictor and the centile‐based risk group stratification, was applied to the external validation set.
The calibration of survival prediction was visually assessed by comparing the similarity between the observed and predicted survival curves in both the training and validation set. The observed and predicted survival‐percentage at 12 months were also compared. Model discrimination was visually inspected by examining the separation survival curves of the four risk groups. In addition, survival rates between the risk groups were compared using HRs or log‐rank test and the accompanying P values. Lastly, subgroup analyses of the new model were performed in patients with Child‐Pugh A or Child‐Pugh B because current guidelines recommend selecting patients with Child‐Pugh A patients only.6, 29
2.3.2. Model comparison
The PROSASH model incorporates the variable ‘aspartate transaminase (AST)’ which was not available in the Rennes (training) and Bordeaux (validation) datasets. Therefore, model comparisons were performed in three subgroups of patients:
The imputed training dataset,
The external validation set, with complete data for all prognostic models except for the PROSASH model and.
Patients with complete data for all prognostic scores.
For each prognostic model, the utility and discriminative performance was quantified using the Akaike Information Criterion (AIC) Harrell's C‐index and Royston‐Sauerbrei's R2 D 40, 41 A lower AIC indicates a better goodness of fit, whereas a higher Harrell's C‐index indicates a larger proportion of patient pairs has agreement between the survival prediction and observed survival outcome in terms of rank. A higher R2 D reflects a better explained variation on the log relative hazard scale. Most prognostic models consist of a linear predictor or point‐based system with a risk group categorization which can lead to loss of information (ie ALBI‐score and ALBI grade 1, 2 and 3). To assess the difference, the performance of each model as a linear predictor or points and risk groups was assessed. Because of lacking data, the number of Child‐Pugh points could not be calculated, thus only the Child‐Pugh classes (A, B and C) were assessed.
3. RESULTS
3.1. Study population
In total, 941 patients who received sorafenib for advanced HCC between February 2003 and December 2016 were identified for this study. Of these, 21 patients (2%) were excluded because they received a combination of sorafenib with loco‐regional treatment (n = 20) or due an ECOG PS >2 (n = 1). Subsequently, 920 patients were included in this study, of whom 615 (67%) patients were included in the training cohort and 305 patients (33%) in the external validation cohort. The baseline characteristics of both cohorts are summarized in Table 1. Both cohorts had similar baseline features except that in the external validation cohort, more patients had ECOG PS 0 (65% vs 45%, P < .001) and alcohol‐induced liver disease was more common (64% vs 35%, P < .001) compared with the training cohort, respectively. The median OS was 8.3 months (95% CI 7.6‐9.2) in all patients. There was no statistically significant difference in survival between the training and validation cohort (HR 1.05, 95% 0.91‐1.21, P = .128; Figure S1).
Table 1.
Baseline characteristics
| Variables | Entire cohort | Training‐set | External validation | P value |
|---|---|---|---|---|
| n = 920 | n = 615 | n = 305 | ||
| Demographics | ||||
| Age, y (SD) | 65 (10.5) | 64 (10.8) | 66 (9.5) | .003 |
| Male sex (%) | 787 (86) | 512 (83) | 275 (90) | .005 |
| Liver disease | ||||
| Aetiology (%, multiple possible) | ||||
| HBV | 94 (10) | 77 (13) | 17 (6) | .001 |
| HCV | 153 (17) | 86 (14) | 67 (22) | .002 |
| Alcohol | 407 (44) | 213 (35) | 194 (64) | <.001 |
| Unknown/Other | 407 (44) | 263 (43) | 64 (21) | <.001 |
| Child‐Pugh class (%) | ||||
| A | 747 (85) | 507 (87) | 240 (79) | <.001 |
| B | 133 (15) | 73 (13) | 60 (20) | |
| C | 4 (<1) | 0 (0) | 4 (1) | |
| Tumour parameters | ||||
| ECOG PS (%) | ||||
| 0 | 477 (52) | 279 (45) | 198 (65) | <.001 |
| 1 | 388 (42) | 294 (48) | 94 (31) | |
| 2 | 55 (6) | 42 (7) | 13 (4) | |
| Number of liver lesions (%) | ||||
| 1 | 229 (25) | 135 (22) | 94 (32) | <.001 |
| 2‐3 | 205 (23) | 169 (28) | 36 (12) | |
| >3 | 468 (52) | >3 (50) | 163 (56) | |
| Largest tumour size, mm (IQR) | 65 (37‐100) | 65 (37‐100) | 64 (36‐100) | .593 |
| Macrovascular invasion (%) | 348 (38) | 223 (36) | 125 (41) | .170 |
| Extrahepatic spread (%) | 418 (46) | 305 (50) | 113 (37) | <.001 |
| BCLC stage (%) | ||||
| A | 9 (1) | 5 (1) | 4 (1) | .032 |
| B | 220 (24) | 155 (25) | 65 (21) | |
| C | 684 (74) | 453 (74) | 231 (76) | |
| D | 6 (<1) | 1 (<1) | 5 (2) | |
| Prior treatments (%) | ||||
| Yes, received prior treatment | 467 (51) | 308 (50) | 159 (52) | .558 |
| No, sorafenib was first treatment | 453 (49) | 307 (50) | 146 (48) | |
| Serum tests | ||||
| AFP, ng/mL (IQR) | 141 (8‐2574) | 127 (10‐2005) | 184 (7‐4500) | .239 |
| Albumin, g/L (SD) | 37 (5.7) | 38 (5.3) | 35 (5.8) | <.001 |
| Bilirubin, µmol/L (IQR) | 15 (10‐24) | 15 (10‐22) | 17 (12‐28) | <.001 |
| AST, U/L (IQR) | 67 (107) | 67 (107) | N/A | N/A |
| Creatinine, µmol/l (IQR) | 73 (61‐88) | 75 (62‐90) | 69 (58‐81) | <.001 |
| Survival outcomes | ||||
| Death (%) | 832 (90) | 559 (91) | 273 (90) | .501 |
| Overall Survival, months (95% CI) | 8.3 (7.6‐9.2) | 8.9 (8.0‐9.8) | 7.7 (6.8‐8.8) | .534 |
Abbreviations: 95% CI, 95% confidence interval; AFP, Alpha‐Foetoprotein; AST, aspartate transaminase; BCLC, Barcelona Clinic Liver Cancer; ECOG PS, Eastern Cooperative Oncology Group performance status; HBV, hepatitis B virus; HCV, hepatitis C virus; IQR, interquartile range; SD, standard deviation.
3.2. Validation of the PROSASH model in routine clinical practice
The PROSASH model could be applied to 445/615 (73%) of patients from the training set who had a median OS of 8.0 months (95% CI 6.7‐9.1). None of the patients from the external validation set were available owing to missing AST (Table S1). With the exception of risk group 2 vs 1 (HR 1.35, 0.94‐1.92, P = .102), there were clear survival differences between the four risk groups with a median OS ranging from 16.9 to 4.6 months (Figure 1) in risk groups 1 and 4, respectively.
Figure 1.
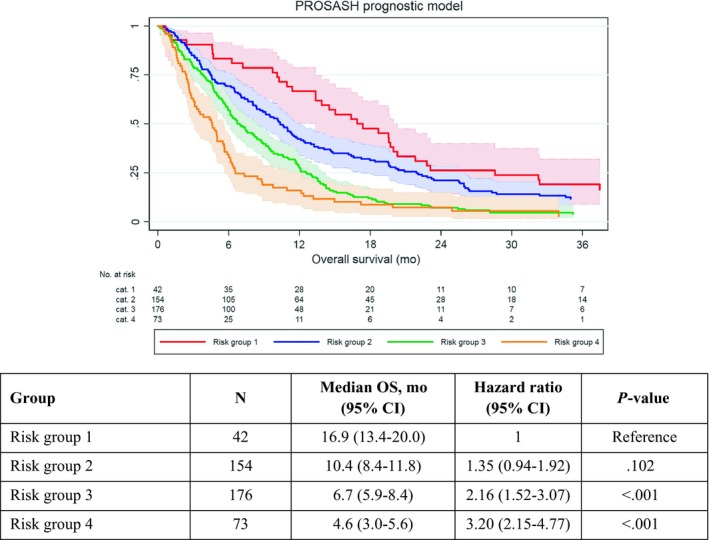
Overall survival according to the PROSASH risk groups with 95% confidence intervals
3.3. Prognostic factors and improved model: PROSASH‐II
First, multiple imputation was performed on the training set to account for missing data (Table S1). An exploratory univariable analysis showed that albumin, Ln(bilirubin), ECOG PS, macrovascular invasion, extrahepatic spread, largest tumour size, number of liver lesions, Ln(AFP) and receiving prior HCC treatments were associated with OS (Table S2).
The stepwise multivariable regression identified albumin, Ln(bilirubin), macrovascular invasion, extrahepatic spread, largest tumour size and Ln(AFP) as statistically significant prognostic factors (Table 2). These six baseline variables and their coefficients were incorporated in a multivariable model, named the PROSASH‐II (Prediction Of Survival in Advanced Sorafenib‐treated HCC v2):
Table 2.
Multivariable flexible parametric regression on imputed training set data
| Variables | Hazard ratio (95% CI) | P‐value |
|---|---|---|
| Albumin – (g/L) | 0.967 (0.951‐0.983) | <.001 |
| Ln(Bilirubin) – µmol/L) | 1.370 (1.178‐1.594) | <.001 |
| Macrovascular invasion vs none | 1.342 (1.124‐1.603) | .001 |
| Extrahepatic spread vs none | 1.198 (1.010‐1.420) | .038 |
| Largest tumour size – cm | 1.034 (1.016‐1.052) | <.001 |
| LnAFP – U/L | 1.073 (1.045‐1.101) | <.001 |
| Flexible parametric spline functions | ||
| γ0 (constant) | 2.317 × 10⁻² (0.916 × 10⁻² to 5.858 × 10⁻²) | <.001 |
| γ1 | 5.654 (4.274‐7.479) | <.001 |
| γ2 | 1.034 (1.019‐1.050) | <.001 |
Based on one interior knot with two degrees of freedom.
Abbreviations: 95% CI, 95% confidence interval; AFP, Alpha‐Foetoprotein; LN, natural logarithm.
| Linear predictor: | (−0.0337 × albumin in g/L) | + |
| (0.315 × Ln(bilirubin in µmol/L)) | + | |
| (0.295 × macrovascular invasion, where 0 = No and 1 = Yes) | + | |
| (0.181 × extrahepatic spread, where 0 = No and 1 = Yes) | + | |
| (0.0336 × Largest tumour size in cm) | + | |
| (0.0703 × Ln(AFP U/L)) |
A comparison of the model variables using complete case data (Table S3) and imputed data showed very similar coefficients and P values, indicating that the model was not greatly impacted by the imputation of missing data.
Using the centile‐based cut‐points, four risk groups were created: ≤−0.0760 (risk group 1), >−0.0760 to ≤0.355 (risk group 2), >0.355 to ≤0.858 (risk group 3) and >0.858 (risk group 4).
To simplify individual survival prediction, the calculation for the linear predictor and risk groups was incorporated in an online calculator (https://jscalc.io/calc/qXgkZNB1h6B1jEfq). This calculator can be used to determine the risk group and chance of survival at 3, 6, 12 and 24 months for each patient. For example, a patient with an albumin of 45 g/L, a bilirubin of 7 µmol/L, an AFP of 5789 U/L, the largest tumour measuring 5.9 cm with macrovascular invasion, but without extrahepatic spread, will have a predicted survival of 87%, 70%, 44% and 19% and 9% at 3, 6, 12, 24 and 36 months, respectively. The equations for these predictions are detailed in Appendix S1.
3.4. PROSASH‐II performance in training and validation set
There were clear and statistically significant survival differences between the PROSASH‐II risk groups in the training set (Figure 2A), with a median OS ranging from 19.6 months (risk group 1) to 3.9 months (risk group 4). The PROSASH‐II model could be applied to 292 (93%) patients from the validation set. With the exception of risk group 1, which had fewer patients (n = 36, 12%) and showed overlap in 95% CI with risk group 2 (HR 1.32, 95% CI 0.85‐2.05, P = .220), the risk groups showed evenly good discrimination in the validation set (Figure 2B).
Figure 2.
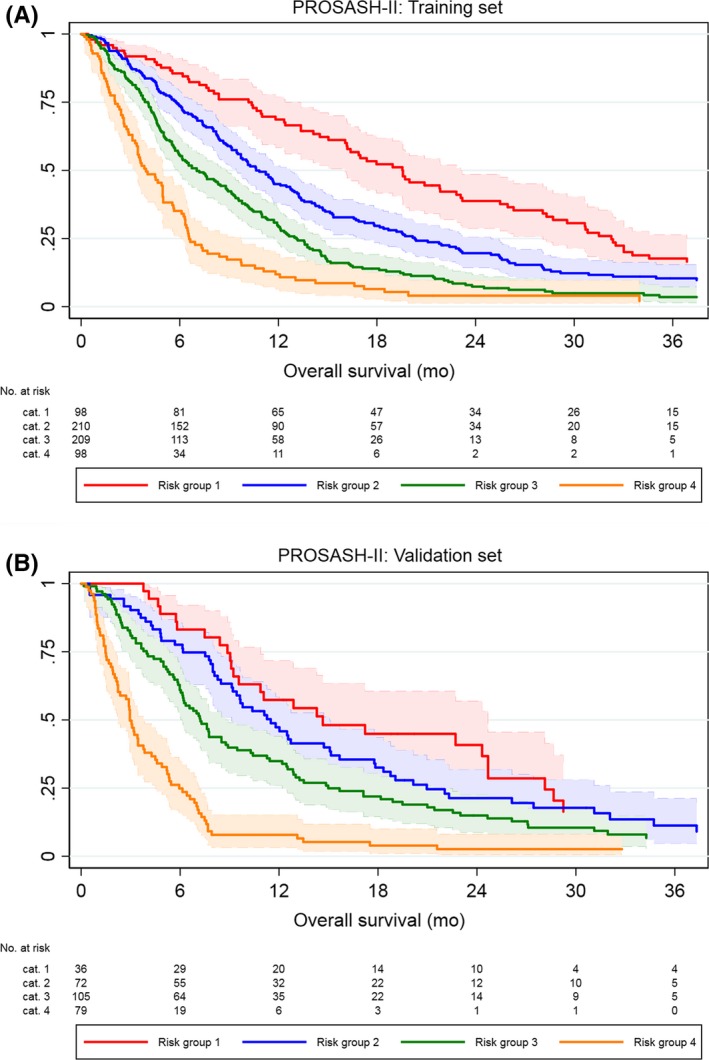
Overall survival according to the PROSASH‐II risk groups in the training (A) and validation (B) set with 95% confidence intervals
Indicated by the concordance in the observed and predicted survival curves of both the training and validation sets (Figure 3A,B), the model showed good overall calibration. Similarly, the predicted and observed median OS and survival at 12 months closely matched in both datasets (Table 3). Although the model slightly underestimated the OS of risk group 1 in the training set, this was not the case in the validation set.
Figure 3.
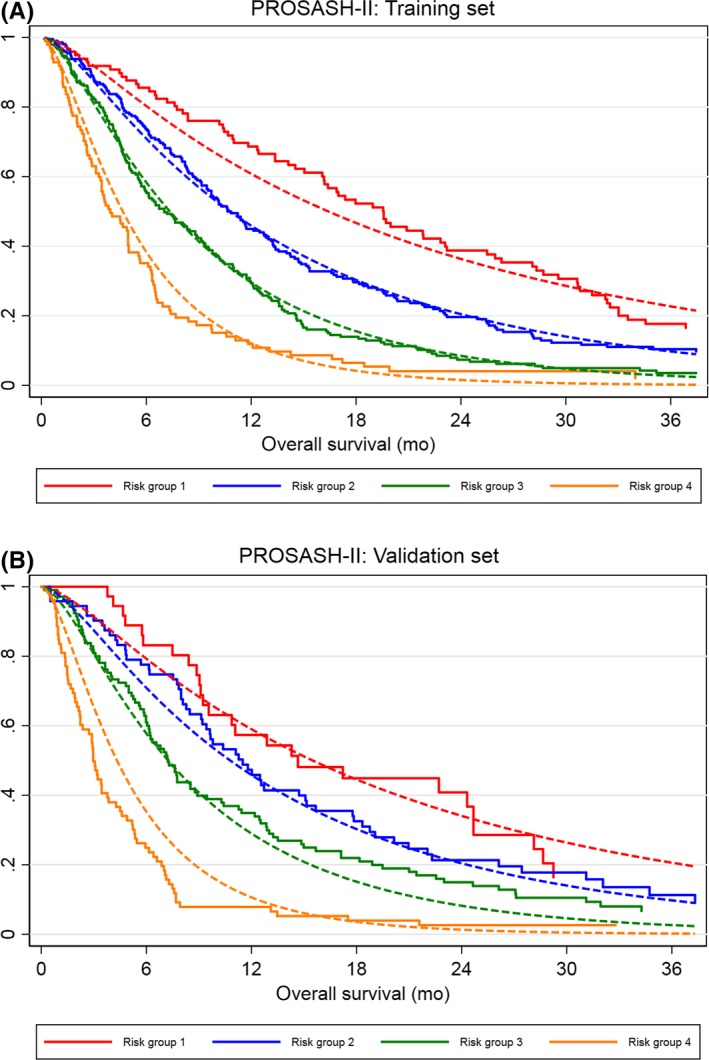
Calibration plot of the predicted (dotted line) and observed (solid line) of the overall survival according to PROSASH‐II risk groups in the training (A) and validation (B) set
Table 3.
Predicted vs observed survival of risk groups of the PROSASH‐II model
| Risk cat. | N |
Observed mOS (95% CI) |
Predicted mOS (95% CI) |
Observed % survival at 12 mo. (95% CI) | Predicted % survival at 12 mo. (95% CI) |
Hazard ratio (95% CI) |
P value | |
|---|---|---|---|---|---|---|---|---|
| Training (n = 615) | 1 | 98 | 19.6 (16.1‐23.1) | 16.4 (14.5‐19.5) | 68.6 (58.3‐76.9) | 61.3 (56.6‐66.4) | 1 | Reference |
| 2 | 210 | 10.6 (9.5‐12.7) | 10.8 (9.8‐12.1) | 45.0 (38.1‐51.7) | 45.5 (41.8‐49.5) | 1.49 (1.15‐1.93) | .003 | |
| 3 | 209 | 7.0 (5.9‐8.8) | 7.5 (6.7‐8.1) | 29.3 (23.2‐35.7) | 29.3 (26.1‐32.9) | 2.40 (1.85‐3.12) | <.001 | |
| 4 | 98 | 3.9 (3.3‐5.0) | 4.7 (4.0‐5.6) | 11.2 (6.4‐19.3) | 14.4 (10.9‐18.9) | 4.24 (3.13‐5.74) | <.001 | |
| Validation (n = 292)a | 1 | 36 | 14.7 (9.2‐24.7) | 16.6 (13.0‐18.5) | 57.4 (39.5‐71.7) | 58.3 (53.6‐63.4) | 1 | Reference |
| 2 | 72 | 11.5 (9.1‐15.1) | 10.8 (9.8‐12.0) | 47.3 (35.3‐58.4) | 45.8 (42.0‐49.8) | 1.32 (0.85‐2.05) | .220 | |
| 3 | 105 | 7.2 (6.0‐8.9) | 7.2 (6.6‐7.8) | 34.9 (25.9‐44.0) | 28.8 (25.6‐32.4) | 1.73 (1.14‐2.63) | .010 | |
| 4 | 79 | 3.0 (2.2‐3.8) | 4.3 (3.8‐4.9) | 7.9 (3.2‐15.2) | 8.6 (6.1‐12.1) | 4.84 (3.11‐7.54) | <.001 | |
| All (n = 907) | 1 | 134 | 19.0 (14.7‐22.8) | 16.2 (14.1‐19.0) | 65.6 (56.8‐73.0) | 60.8 (56.1‐65.9) | 1 | Reference |
| 2 | 282 | 11.2 (9.7‐12.5) | 10.8 (9.8‐12.0) | 45.6 (39.6‐51.4) | 45.8 (42.1‐49.8) | 1.44 (1.15‐1.80) | .001 | |
| 3 | 314 | 7.2 (6.2‐8.3) | 7.3 (6.7‐8.1) | 31.2 (26.1‐36.4) | 29.4 (26.4‐33.0) | 2.12 (1.70‐2.65) | <.001 | |
| 4 | 177 | 3.4 (3.0‐4.5) | 4.5 (4.0‐5.2) | 10.1 (5.1‐15.1) | 11.2 (8.3‐15.3) | 4.52 (3.54‐5.78) | <.001 |
Abbreviations: 95% CI, 95% confidence interval; mo, months; (m)OS, (median) overall survival; PROSASH, Prediction Of Survival in Advanced Sorafenib‐treated HCC.
13/305 patients could not be classified according to the PROSASH‐II model owing to missing values.
Given the similarities of baseline characteristics and model performance in the training and validation sets, all patients were clustered together and then model‐based stratification was re‐applied. The median OS was 19.0, 11.2, 7.2 and 3.4 months with a 12‐month survival of 65.6%, 45.6%, 31.2% and 10.1%, in risk groups 1‐4, respectively. There was no overlap in hazard ratios (Table 3), indicating good discrimination. Similar to the training set, there was a trend towards a slight survival underestimation of patients in risk group 1 (Figure 4); however, overall, the predicted and observed survival were closely matched.
Figure 4.
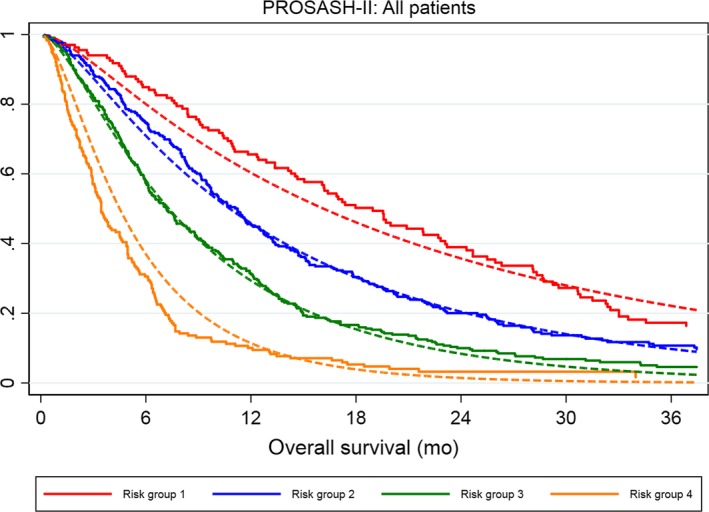
Calibration plot of the predicted (dotted line) and observed (solid line) of the overall survival according to the PROSASH‐II risk groups (1‐4) in all patients
3.5. Subgroup analysis according to Child‐Pugh class
In a subgroup analysis of Child‐Pugh A patients (n = 767), who had a median OS of 9.1 months, there were clear survival differences between the various PROSASH‐II risk groups (Figure S2A). The median OS was 19.0, 10.8, 7.6 and 4.5 months across risk groups 1‐4, respectively. For the subgroup analysis of patients with Child‐Pugh B liver function, 136 patients were available with a median OS of 4.3 months (Figure S2B). None of these patients were assigned to risk group 1 and only 10 (13.4%) to risk group 2. There was a trend towards a poorer survival across risk groups 2 to 4 with a median OS of 13.4, 5.4 and 3.1 months, respectively. The difference between risk groups 2 and 3 was not significant owing to limited patient numbers (HR 1.98, 0.97‐4.04, P = .062). There were statistically significant survival differences between risk groups 3 and 4 (log‐rank P = .002).
3.6. PROSASH‐II model performance and comparison
The performance of the different prognostic models was compared and summarized in Tables 4 and 5. Comparisons were performed in the training set with imputed missing data (n = 615), the validation set with complete data (n = 290) and a subgroup of 438 patients with complete data for all prognostic models. Across the various prognostic models, there was a slight loss in discriminative power when patients were categorized in risk groups or prognostic classes. Moreover, there was a trend towards a higher C‐index and R2 D and lower AIC across all assessed prognostic models in the validation set compared with the training set. In all different subsets, the models with the lowest predictive performance in terms of AIC, C‐index and R2 D were the BCLC, Child‐Pugh and JIS. The HAP and SAP score performed very similarly in the different subsets.
Table 4.
Comparison between of the predictive performance of prognostic models in the training and validation set
| Staging system (no. of strata) | Imputed training set (n = 615) | Complete case validation set (n = 290) | ||||
|---|---|---|---|---|---|---|
| AIC | C‐index (IQRb) | R2 D (95% CIa) | AIC | C‐index (95% CIa) | R2 D (95% CIa) | |
| PROSASH‐II | ||||||
| Linear predictor | 1684 | 0.65 (0.64‐0.65) | 0.12 (0.08‐0.17) | 828 | 0.68 (0.65‐0.72) | 0.16 (0.08‐0.24) |
| Grouped (4) | 1697 | 0.64 (0.64‐0.64) | 0.12 (0.08‐0.17) | 839 | 0.67 (0.64‐0.70) | 0.16 (0.09‐0.25) |
| PROSASH | ||||||
| Linear predictor | — | — | — | — | — | — |
| Grouped (4) | — | — | — | — | — | — |
| ALBI | ||||||
| Linear predictor | 1764 | 0.59 (0.59‐0.59) | 0.04 (0.01‐0.06) | 867 | 0.62 (0.58‐0.65) | 0.06 (0.03‐0.13) |
| Grade (3) | 1781 | 0.56 (0.55‐0.56) | 0.03 (<0.01‐0.05) | 877 | 0.58 (0.55‐0.61) | 0.05 (0.01‐0.12) |
| Child‐Pugh (3) | 1782 | 0.53 (0.53‐0.53) | 0.05 (0.01‐0.09) | 867 | 0.58 (0.55‐0.61) | 0.11 (0.04‐0.21) |
| BCLC (4)c | 1785 | 0.54 (0.52‐0.56) | 0.02 (<0.01‐0.06) | 885 | 0.57 (0.55‐0.60) | 0.03 (0.01‐0.08) |
| HAP | ||||||
| Points (5) | 1733 | 0.60 (0.60‐0.60) | 0.08 (0.04‐0.12) | 833 | 0.67 (0.64‐0.70) | 0.16 (0.09‐0.25) |
| Classes (4) | 1738 | 0.60 (0.60‐0.60) | 0.08 (0.04‐0.11) | 840 | 0.66 (0.63‐0.69) | 0.14 (0.07‐0.23) |
| SAP | ||||||
| Points (5) | 1733 | 0.60 (0.60‐0.61) | 0.08 (0.04‐0.12) | 817 | 0.69 (0.66‐0.72) | 0.16 (0.09‐0.27) |
| Classes (3) | 1738 | 0.59 (0.59‐0.59) | 0.09 (0.04‐0.13) | 830 | 0.66 (0.63‐0.69) | 0.14 (0.07‐0.23) |
| JIS (5) | 1775 | 0.55 (0.55‐0.55) | 0.03 (0.01‐0.06) | 877 | 0.59 (0.55‐0.62) | 0.05 (0.02‐0.12) |
Abbreviations: 95% CI, 95% confidence interval; AIC, Akaike Information Criterion; ALBI; albumin‐bilirubin; C‐index, BCLC, Barcelona Clinic Liver Cancer; HAP, Hepatoma Arterial‐embolization Prognostic score; Harrell's C‐index; JIS, Japan Integrated Staging score; R2D, Royston‐Sauerbrei's R2D; PROSASH, Prediction Of Survival in Advanced Sorafenib‐treated HCC; SAP, Sorafenib Advanced HCC Prognostic score.
Confidence intervals estimated from 200 bootstrap samples.
Median and IQR for each model were estimated from the 10 imputed linear predictors.
Only n = 1 missing in training cohort, thus a complete case analysis was performed.
Table 5.
Comparison of prognostic models in a complete case population
| Staging system (no. of strata) | Complete case for all models (n = 438) | ||
|---|---|---|---|
| AIC | C‐index (95% CI*) | R2 D (95% CIa) | |
| PROSASH‐II | |||
| Linear predictor | 1260 | 0.63 (0.60‐0.66) | 0.10 (0.06‐0.15) |
| Grouped (4) | 1266 | 0.62 (0.60‐0.65) | 0.10 (0.05‐0.15) |
| PROSASH | |||
| Linear predictor | 1278 | 0.62 (0.59‐0.65) | 0.07 (0.04‐0.11) |
| Grouped (4) | 1279 | 0.61 (0.58‐0.64) | 0.08 (0.04‐013) |
| ALBI | |||
| Linear predictor | 1303 | 0.58 (0.55‐0.61) | 0.03 (0.01‐0.07) |
| Grade (3) | 1318 | 0.54 (0.52‐0.57) | 0.02 (<0.01‐0.05) |
| Child‐Pugh (3) | 1317 | 0.52 (0.51‐0.54) | 0.04 (0.01‐0.07) |
| BCLC (4) | 1320 | 0.53 (0.51‐0.56) | 0.01 (<0.01‐0.04) |
| HAP | |||
| Points (5) | 1289 | 0.59 (0.56‐0.62) | 0.06 (0.03‐0.11) |
| Classes (4) | 1292 | 0.59 (0.56‐0.62) | 0.06 (0.03‐0.11) |
| SAP | |||
| Points (5) | 1293 | 0.59 (0.56‐0.62) | 0.05 (0.02‐0.09) |
| Classes (3) | 1291 | 0.58 (0.55‐0.61) | 0.07 (0.03‐0.13) |
| JIS (5) | 1315 | 0.53 (0.51‐0.56) | 0.02 (<0.01‐0.05) |
Abbreviations: 95% CI, 95% confidence interval; AIC, Akaike Information Criterion; ALBI; albumin‐bilirubin; C‐index, BCLC, Barcelona Clinic Liver Cancer; HAP, Hepatoma Arterial‐embolization Prognostic score; Harrell's C‐index; JIS, Japan Integrated Staging score; R2D, Royston‐Sauerbrei's R2D; PROSASH, Prediction Of Survival in Advanced Sorafenib‐treated HCC; SAP, Sorafenib Advanced HCC Prognostic score.
Confidence intervals estimated from 200 bootstrap samples.
In the training set, the higher C‐index (0.65, IQR 0.64‐0.65) and R2 D (0.12, 95% CI 0.08‐0.17) of the PROSASH‐II indicated improved discriminative performance and explained variation compared with the currently available models. Likewise, the PROSASH‐II had a lower AIC (1684) which indicated a better goodness of fit.
In the validation set, the PROSASH‐II model had a higher C‐index (0.68, 95% CI 0.65‐0.72) and lower AIC (828) than commonly used scores such as BCLC and Child‐Pugh. It also had the highest R2 D (0.16, 95% CI 0.08‐0.24) of all tested models, reflecting better explained variation. However, the model appeared to have a similar prognostic performance as the HAP and SAP scores, the latter showing a slightly higher C‐index (0.69, 95% CI 0.66‐0.72) and lower AIC (817) than the PROSASH‐II model.
In the complete case subset for all models (n = 438), the PROSASH‐II model had the highest C‐index (0.63, 95% CI 0.60‐0.66) and R2 D (0.10, 95% CI 0.06‐0.15) and lowest AIC (1260). The slightly poorer values for AIC (1278), C‐index (0.62, 95% CI 0.59‐0.65) and R2 D (0.07, 95% CI 0.04‐0.11) of the original PROSASH model indicated a comparable predictive performance.
4. DISCUSSION
In this large multicentre study of patients treated with sorafenib for HCC, the clinical trial‐based PROSASH model was successfully validated and optimized (PROSASH‐II) in routine clinical practice. The PROSASH‐II model, which uses fewer and more objective parameters and performed at least as good as PROSASH, offers individualized survival prediction and performs better than frequently used prognostic models (ie BCLC and Child‐Pugh).
In light of the modest survival benefit (2‐3 months) and significant costs and toxicity of sorafenib in advanced HCC, various studies have raised concerns on the cost‐effectiveness of sorafenib in daily practice.42, 43, 44 The BCLC staging system and Child‐Pugh score are the most used prognostic models, but they have clear limitations: Child‐Pugh incorporates subjective parameters which can lead to misclassification and inter‐observer variability,9 whereas the prognostic value of BCLC staging for patients treated with the same modality is low. To optimize cost‐effectiveness and aid clinicians in survival prediction and clinical decision‐making, several other prognostic models have been proposed to stratify these patients (Table 6). Interestingly, most of these models were not specifically built for sorafenib‐treated HCC patients and none of them performed optimal.9, 18, 19, 45, 46, 47 Lack of consensus, easy applicability and external validation have hampered implementation of these prognostic scores in clinical practice.
Table 6.
Literature reported performance of prognostic models patients with HCC treated with sorafenib
| Name model | Variables | C‐index | Type of cohort (n) | References | ||
|---|---|---|---|---|---|---|
| Tumour‐related | Liver function | Other | ||||
| Tested in this study | ||||||
| PROSASH‐II |
AFP EHS MVI Tumour size |
Bilirubin Albumin |
0.65 0.68 |
Training (615) Validation (290) |
Present study Present study |
|
| PROSASH |
AFP EHS MVI |
AST Albumin |
Aetiology Age Creatinine |
0.72 0.70 0.62 |
Training (500) Validation (421) Validation (438) |
Berhane et al21 Berhane et al21 Present study |
| ALBI |
Albumin Bilirubin |
0.60 0.60 NA 0.59 0.62 |
Validation (905) Validation (468) Validation (681) Validation (615) Validation (290) |
Edeline et al9 Edeline et al18 Samawi et al46 Present study Present study |
||
| Child‐Pugh |
Albumin Bilirubin PT/INR Ascites Encephalopathy |
0.61 0.53 0.58 |
Validation (905) Validation (615) Validation (290) |
Edeline et al9 Present study Present study |
||
| BCLC |
ECOG PS EHS MVI |
Child‐Pugh |
0.64 0.55 NA 0.54 0.57 |
Validation (435) Validation (468) Validation (681) Validation (615) Validation (290) |
Takeda et al19 Edeline et al18 Samawi et al46 Present study Present study |
|
| HAP |
AFP Tumour size |
Albumin Bilirubin |
0.65 0.60 0.67 |
Validation (468) Validation (615) Validation (290) |
Edeline et al18 Present study Present study |
|
| SAP |
ECOG PS AFP Tumour size |
Albumin Bilirubin |
0.64 0.60 0.69 |
Validation (468) Validation (615) Validation (290) |
Edeline et al18 Present study Present study |
|
| JIS |
Tumour size Tumour number MVI |
Child‐Pugh |
0.69 0.55 0.59 |
Validation (435) Validation (615) Validation (290) |
Takeda et al19 Present study Present study |
|
| Not tested in this study | ||||||
| CLIP |
AFP MVI Tumour number % Tumour extent |
Child‐Pugh |
0.54 NA |
Validation (435) Validation (681) |
Takeda et al19 Samawi et al46 |
|
| Okuda | % Tumour extent |
Albumin Bilirubin Ascites |
0.63 NA |
Validation (435) Validation (681) |
Takeda et al19 Samawi et al46 |
|
| JRC |
AFP DCP EHS MVI Morphology |
Albumin Bilirubin |
0.76 | Training (435) | Takeda et al19 | |
| NIACE |
ECOG PS AFP Morphology Tumour number |
Child‐Pugh |
NA |
Validation (83) Validation (83) Validation (119) |
Adhoute et al17 | |
| AJCC TNM7 |
Tumour size Tumour number MVI EHS |
NA | Validation (681) | Samawi et al46 | ||
| Korean |
AFP Morphology MVI |
Child‐Pugh |
NA | Training (612) | Yoo et al20 | |
Abbreviations: AFP, Alpha‐Foetoprotein; AJCC TNM, American Joint Committee on Cancer Tumour Node Metastasis; ALBI; albumin‐bilirubin; AST, aspartate transaminase; BCLC, Barcelona Clinic Liver Cancer; CLIP, Cancer of the Liver Italian Program score; DPC, Des‐gamma‐carboxy prothrombin; ECOG PS, Eastern Cooperative Oncology Group performance status; EHS, extrahepatic spread; HAP, hepatoma arterial‐embolization prognostic score; JIS, Japan Integrated Staging score; JRC, Japan Red Cross score; MVI. Macrovascular invasion; PROSASH, Prediction Of Survival in Advanced Sorafenib‐treated HCC; SAP, Sorafenib Advanced HCC Prognostic score.
We were able to compare eight different prognostic models: ALBI, Child‐Pugh, BCLC, HAP, SAP, JIS, PROSASH and the newly proposed PROSASH‐II model (Table 6). All tested models included parameters for liver function (ie albumin, bilirubin, AST), most of them included tumour‐related parameters (ie AFP, tumour size, macrovascular invasion) and some included ‘other’ baseline parameters (age, HCC aetiology, ECOG PS). Only a few scores have incorporated predictive parameters that were associated with increased benefit of sorafenib over placebo (extrahepatic spread, NLR and hepatitis C virus infection).16 This may reflect the modest impact of sorafenib on the natural history of advanced HCC. The well‐known prognostic impact of the severity of the underlying liver disease was confirmed in this study, reflected by multivariable significance and incorporation of albumin in the PROSASH and PROSASH‐II models. In accordance with prior studies,9, 48, 49 we showed that despite using less parameters, ALBI has a better discrimination than the Child‐Pugh classification.
Although initially developed to stratify HCC patients treated with TACE, the HAP score showed that a further improvement of predictive accuracy is possible by combining liver function (albumin, bilirubin) and tumour‐related (AFP, tumour size) parameters.18 The highly comparable SAP score, which adds ECOG PS, performed similarly in our study. Depending on the subgroup of patients, the HAP and SAP scores performed slightly worse or similar to the PROSASH and PROSASH‐II models. Given the overlap of four prognostic parameters (albumin, bilirubin, AFP and tumour size) which are dichotomized in the HAP and SAP scores, this is not unexpected. However, neither the SAP nor HAP score offer individualized survival prediction and do not incorporate predictors of improved sorafenib benefit.
Both the PROSASH and PROSASH‐II models offer individualized survival prediction and propose an externally validated four‐tier subgroup classification with a median survival of 17‐10‐7‐5 months and 19‐11‐7‐3 months, for risk groups 1‐4, respectively. The PROSASH incorporated albumin, AFP, AST, creatinine, age, extrahepatic spread, macrovascular invasion, ECOG PS and disease aetiology (nine parameters in total), whereas the PROSASH‐II incorporated albumin, AFP, extrahepatic spread, macrovascular invasion, tumour size and bilirubin (six parameters in total). It is inevitable that different studies with different datasets lead to (slightly) different prognostic models. However, despite the different origins (clinical trial vs daily practice), there is significant overlap in the PROSASH‐I and ‐II variables which suggests that these variables are stable and clinically relevant. As pointed out by several statistical experts, there is no widely agreed approach to build a multivariable prognostic model from a set of candidate predictors.50, 51 In this study, we aimed to report on the optimized statistical associations in daily clinical practice of sorafenib‐treated patients guided by two main principles in prognostic model building. Firstly, the parameters should be commonly available in centres treating patients with HCC. Secondly, models should be widely validated and universally applicable. For this purpose, we used large international datasets that have inevitable differences in data availability. As suggested by Royston et al, this was handled by multiple imputation of randomly missing data (Table S1) and by balancing data availability (ie parameter selection) and analytic power (ie patient numbers).50 Using this approach, we were able to build the PROSASH‐II model which required fewer and only highly reproducible parameters while it performed better in terms of C‐index, AIC and R2 D than its predecessor. Disease aetiology and ECOG PS are less objective parameters which may lead to inter‐ and intra‐user variability in daily practice, favouring PROSASH‐II as a tool that can aid clinicians in providing patient‐tailored treatment. Moreover, PROSASH‐II was built and tested on a daily clinical practice population in which it will be applied. Currently, guidelines recommend to consider all patients with well‐preserved liver function (Child‐Pugh‐A) who are unsuitable for loco‐regional therapy for sorafenib treatment. The clear subgroup survival differences of PROSASH‐II risk groups in Child‐Pugh A patients show that even in ‘guideline concordant patients’ a more individualized decision is possible. Patients within risk group 3 (median OS 7‐8 months) may have more benefit from alternative treatments (lenvantinib, clinical trials ie with PD1/PD‐L1 blockers), whereas patients within risk group 4 (median OS 3‐5 months) could be counselled to receive best‐supportive care only. A similar stratification was seen in patients classified as Child‐Pugh B who are currently not recommended to be treated with sorafenib and have a poor prognosis (median OS of 4.3 months). Still, a small subgroup of these patients (risk group 2, <10%) had a better prognosis (risk group 2, median OS 13.4 months) and could be considered for treatment with sorafenib.
In addition, the PROSASH‐II stratification could be used for pre‐planned or post‐hoc subgroup analyses of ongoing and finalized phase‐III studies comparing sorafenib with alternative treatments. Another application would be to generate survival curves of patients with advanced HCC treated with new agents in phases I‐II studies. A quantitative comparison between the observed survival outcomes of tested agent and the predicted sorafenib survival remains difficult in these ‘in silico’ clinical trials, but it could aid in deciding whether these agents can proceed to be tested in a phase III trial.
This study has several limitations, foremost the retrospective design and its inherent limitations. Owing to missing parameters, some previously proposed prognostic factors (ie NLR,16, 52, 53, 54, 55 body composition13, 56) could not be taken into account and not all previously proposed models could be included in the comparison (CLIP, NIACE). Secondly, this study was performed in patients treated in European countries and should be validated in other geographical areas (i.e. Asia).
Despite over a decade of sorafenib usage and extensive studies, no molecular markers with a strong association with mechanism of sorafenib action have been identified, reflecting the complexity of advanced stage HCC and the difficulty of simplifying this into easily applicable biomarkers.8 Our calculator provides a clinically applicable and validated model for the unmet need of outcome prediction prior to sorafenib treatment. Future studies could improve the risk stratification, survival prediction and clinical decision‐making by not only taking into account baseline factors (pre‐sorafenib) but also parameters that can be monitored and may be of potential prognostic influence during treatment (ie sorafenib dose, dynamics in liver function, AFP, radiological response or pattern of progression). The more recently approved second‐line treatments for advanced HCC (ie regorafenib [2017], cabozantinib [2019]) most likely did not have a major impact on the current model because the included patients were treated with sorafenib prior to FDA/EMEA approval of these treatments and the landmark trials of these agents had strict inclusion criteria. Future studies aiming to implement these variables into robust tools and validated models will require large collaborations with detailed and high‐quality (prospective) datasets. To avoid statistical bias (overfitting), it remains important to externally validate novel prognostic models.
In conclusion, our study validated the PROSASH model in routine daily practice and proposed an improved model (PROSASH‐II) which uses less and more objective clinical features. The PROSASH‐II model outperforms the currently available models and offers risk group stratification and individualized survival prediction that can be used for tailored treatment of HCC in daily practice and pre‐planned subgroups analyses of future studies.
CONFLICTS OF INTEREST
DB receives teaching and speaking fees from Bayer Healthcare and from the Falk Foundation, Germany. HJK is a member of the advisory board for Ipsen and Sirtex. JE receives speaking fees and travel grants from Bayer. JFB is a member of the advisory board for Bayer, IPSEN, ESAI. RBT served as a speaker for Gore WL, Bayer and Norgine. He is a member of the advisory board for Gilead and Norgine. RdM served as a speaker for Norgine and as a consultant for Cook Medical. OvD served as a consultant for Cook Medical. All other authors have declared no conflicts of interest. This study was designed and conducted by academic investigators.
AUTHORS’ CONTRIBUTIONS
TL lead this study, performed data acquisition and analysis, and wrote the manuscript. SB and LB performed and supervised data analysis. JE, JFB, DB, TM, JvV, DtC, RdM, FE, AC, OvD, HJK and RBT supervised this study, provided data and clinical input and provided mentorship for this study. PJ conceived this study design and is the guarantor of the article. All authors have reviewed and approved a final version of the manuscript.
Supporting information
ACKNOWLEDGEMENTS
DB is supported by the Berta‐Ottenstein Programme, Faculty of Medicine, University of Freiburg. HJK has received an unrestricted research grant from Bayer. JE was partly funded by the Foundation de France for this work. RBT has received grants from the Netherlands Organization for Health Research and Development (ZonMw) and The Netherlands Society for Gastroenterology (NVGE). SB acknowledges support from the UK EPSRC grant EP/N014499/1. TM is part funded by the NIHR UCLH Biomedical Research Centre. TL was supported by travel grants from the Cancer Center Amsterdam and the Netherlands Society for Hepatology. These funding bodies had no role in the design of this study, collection, analysis and interpretation of data, or in writing of the manuscript. Lastly, TL would like to acknowledge the exceptional hospitality of Philip and Sue Johnson, and the Department of Molecular and Clinical Medicine, University of Liverpool, during his stay in Liverpool.
Labeur TA, Berhane S, Edeline J, et al. Improved survival prediction and comparison of prognostic models for patients with hepatocellular carcinoma treated with sorafenib. Liver Int. 2020;40:215–228. 10.1111/liv.14270
Handling Editor: Frank Tacke
REFERENCES
- 1. Torre LA, Bray F, Siegel RL, et al. Global cancer statistics, 2012. CA Cancer J Clin. 2015;65(2):87–108. [DOI] [PubMed] [Google Scholar]
- 2. Cheng A‐L, Kang Y‐K, Chen Z, et al. Efficacy and safety of sorafenib in patients in the Asia‐Pacific region with advanced hepatocellular carcinoma: a phase III randomised, double‐blind, placebo‐controlled trial. Lancet Oncol. 2009;10(1):25‐34. [DOI] [PubMed] [Google Scholar]
- 3. Llovet JM, Ricci S, Mazzaferro V, et al. Sorafenib in advanced hepatocellular carcinoma. N Engl J Med. 2008;359:378–390. [DOI] [PubMed] [Google Scholar]
- 4. Marrero JA, Kudo M, Venook AP, et al. Observational registry of sorafenib use in clinical practice across Child‐Pugh subgroups: the GIDEON study. J Hepatol. 2016;65(6):1140‐1147. [DOI] [PubMed] [Google Scholar]
- 5. Kudo M, Finn RS, Qin S, et al. Lenvatinib versus sorafenib in first‐line treatment of patients with unresectable hepatocellular carcinoma: a randomised phase 3 non‐inferiority trial. Lancet (London, England). 2018;391(10126):1163‐1173. [DOI] [PubMed] [Google Scholar]
- 6. EASL Clinical Practice Guidelines . Management of hepatocellular carcinoma. J Hepatol. 2018;69(1):182‐236. [DOI] [PubMed] [Google Scholar]
- 7. Bruix J, Raoul J‐L, Sherman M, et al. Efficacy and safety of sorafenib in patients with advanced hepatocellular carcinoma: subanalyses of a phase III trial. J Hepatol. 2012;57(4):821‐829. [DOI] [PMC free article] [PubMed] [Google Scholar]
- 8. Marisi G, Cucchetti A, Ulivi P, et al. Ten years of sorafenib in hepatocellular carcinoma: are there any predictive and/or prognostic markers? World J Gastroenterol. 2018;24(36):4152‐4163. [DOI] [PMC free article] [PubMed] [Google Scholar]
- 9. Edeline J, Blanc J‐F, Johnson P, et al. A multicentre comparison between Child Pugh and Albumin‐Bilirubin scores in patients treated with sorafenib for Hepatocellular Carcinoma. Liver Int. 2016;36(12):1821‐1828. [DOI] [PubMed] [Google Scholar]
- 10. Giannini EG, Bucci L, Garuti F, et al. Patients with advanced hepatocellular carcinoma need a personalized management: a lesson from clinical practice. Hepatology (Baltimore, MD). 2018;67(5):1784‐1796. [DOI] [PubMed] [Google Scholar]
- 11. Iavarone M, Cabibbo G, Piscaglia F, et al. Field‐practice study of sorafenib therapy for hepatocellular carcinoma: a prospective multicenter study in Italy. Hepatology (Baltimore, MD). 2011;54(6):2055‐2063. [DOI] [PubMed] [Google Scholar]
- 12. Jackson R, Psarelli EE, Berhane S, Khan H, Johnson P. Impact of viral status on survival in patients receiving sorafenib for advanced hepatocellular cancer: a meta‐analysis of randomized phase III trials. J Clin Oncol. 2017;35(6):622‐628. [DOI] [PubMed] [Google Scholar]
- 13. Labeur T, van Vugt J, Ten Cate DWG, et al. Composition is an independent predictor of outcome in patients with hepatocellular carcinoma treated with sorafenib. Liver Cancer. 2019;8(4):255-270. [DOI] [PMC free article] [PubMed] [Google Scholar]
- 14. Llovet JM, Pena CE, Lathia CD, Shan M, Meinhardt G, Bruix J. Plasma biomarkers as predictors of outcome in patients with advanced hepatocellular carcinoma. Clin Cancer Res. 2012;18(8):2290‐2300. [DOI] [PMC free article] [PubMed] [Google Scholar]
- 15. Pinter M, Sieghart W, Graziadei I, et al. Sorafenib in unresectable hepatocellular carcinoma from mild to advanced stage liver cirrhosis. Oncologist. 2009;14(1):70‐76. [DOI] [PubMed] [Google Scholar]
- 16. Bruix J, Cheng AL, Meinhardt G, Nakajima K, De Sanctis Y, Llovet J. Prognostic factors and predictors of sorafenib benefit in patients with hepatocellular carcinoma: analysis of two phase III studies. J Hepatol. 2017;67(5):999‐1008. [DOI] [PubMed] [Google Scholar]
- 17. Adhoute X, Pénaranda G, Raoul JL, et al. Prognosis of advanced hepatocellular carcinoma: a new stratification of Barcelona Clinic Liver Cancer stage C: results from a French multicenter study. Eur J Gastro Hepatol. 2016;28(4):433‐440. [DOI] [PubMed] [Google Scholar]
- 18. Edeline J, Blanc J‐F, Campillo‐Gimenez B, et al. Prognostic scores for sorafenib‐treated hepatocellular carcinoma patients: a new application for the hepatoma arterial embolisation prognostic score. Eur J Cancer (Oxford, England: 1990). 2017;86:135‐142. [DOI] [PubMed] [Google Scholar]
- 19. Takeda H, Nishikawa H, Osaki Y, et al. Proposal of Japan Red Cross score for sorafenib therapy in hepatocellular carcinoma. Hepatol Res. 2015;45(10):E130‐E140. [DOI] [PubMed] [Google Scholar]
- 20. Yoo J‐J, Chung GE, Lee J‐H, et al. Sub‐classification of advanced‐stage hepatocellular carcinoma: a cohort study including 612 patients treated with sorafenib. Cancer Res Treat. 2018;50(2):366‐373. [DOI] [PMC free article] [PubMed] [Google Scholar]
- 21. Berhane S, Fox R, Garcia‐Finana M, Cucchetti A, Johnson P. Using prognostic and predictive clinical features to make personalised survival prediction in advanced hepatocellular carcinoma patients undergoing sorafenib treatment. Br J Cancer. 2019;121(2):117–124. [DOI] [PMC free article] [PubMed] [Google Scholar]
- 22. Cheng A‐L, Kang Y‐K, Lin D‐Y, et al. Sunitinib versus sorafenib in advanced hepatocellular cancer: results of a randomized phase III trial. J Clin Oncol. 2013;31(32):4067‐4075. [DOI] [PubMed] [Google Scholar]
- 23. Johnson PJ, Qin S, Park J‐W, et al. Brivanib versus sorafenib as first‐line therapy in patients with unresectable, advanced hepatocellular carcinoma: results from the randomized phase III BRISK‐FL study. J Clin Oncol. 2013;31(28):3517‐3524. [DOI] [PubMed] [Google Scholar]
- 24. Dierks J, Gaspersz MP, Belkouz A, et al. Translating the ABC‐02 trial into daily practice: outcome of palliative treatment in patients with unresectable biliary tract cancer treated with gemcitabine and cisplatin. Acta Oncol. 2018;57(6):807‐812. [DOI] [PubMed] [Google Scholar]
- 25. Booth CM, Tannock IF. Randomised controlled trials and population‐based observational research: partners in the evolution of medical evidence. Br J Cancer. 2014;110(3):551‐555. [DOI] [PMC free article] [PubMed] [Google Scholar]
- 26. Labeur TA, Ten Cate D, Bart Takkenberg R, et al. Are we SHARP enough? The importance of adequate patient selection in sorafenib treatment for hepatocellular carcinoma. Acta Oncol (Stockholm, Sweden). 2018;57(11):1467‐1474. [DOI] [PubMed] [Google Scholar]
- 27. Mol L, Koopman M, van Gils CW, Ottevanger PB, Punt CJ. Comparison of treatment outcome in metastatic colorectal cancer patients included in a clinical trial versus daily practice in The Netherlands. Acta Oncol (Stockholm, Sweden). 2013;52(5):950‐955. [DOI] [PubMed] [Google Scholar]
- 28. Templeton AJ, Vera‐Badillo FE, Wang L, et al. Translating clinical trials to clinical practice: outcomes of men with metastatic castration resistant prostate cancer treated with docetaxel and prednisone in and out of clinical trials. Ann Oncol. 2013;24(12):2972‐2977. [DOI] [PubMed] [Google Scholar]
- 29. Heimbach JK, Kulik LM, Finn RS, et al. AASLD guidelines for the treatment of hepatocellular carcinoma. Hepatology (Baltimore, MD). 2018;67(1):358‐380. [DOI] [PubMed] [Google Scholar]
- 30. Johnson PJ, Berhane S, Kagebayashi C, et al. Assessment of liver function in patients with hepatocellular carcinoma: a new evidence‐based approach‐the ALBI grade. J Clin Oncol. 2015;33(6):550‐558. [DOI] [PMC free article] [PubMed] [Google Scholar]
- 31. Kudo M, Chung H, Osaki Y. Prognostic staging system for hepatocellular carcinoma (CLIP score): its value and limitations, and a proposal for a new staging system, the Japan Integrated Staging Score (JIS score). J Gastroenterol. 2003;38(3):207‐215. [DOI] [PubMed] [Google Scholar]
- 32. Kadalayil L, Benini R, Pallan L, et al. A simple prognostic scoring system for patients receiving transarterial embolisation for hepatocellular cancer. Ann Oncol. 2013;24(10):2565‐2570. [DOI] [PMC free article] [PubMed] [Google Scholar]
- 33. Raghunathan TE, Lepkowski JM, Van Hoewyk J, Solenberger P. A multivariate technique for multiply imputing missing values using a sequence of regression models. J Surv Methodol. 2001;27(1):85‐96. [Google Scholar]
- 34. Van Buuren S, Boshuizen HC, Knook DL. Multiple imputation of missing blood pressure covariates in survival analysis. Stat Med. 1999;18(6):681‐694. [DOI] [PubMed] [Google Scholar]
- 35. Royston P, Parmar MK. Flexible parametric proportional‐hazards and proportional‐odds models for censored survival data, with application to prognostic modelling and estimation of treatment effects. Stat Med. 2002;21(15):2175‐2197. [DOI] [PubMed] [Google Scholar]
- 36. van Buuren S. Multiple imputation of discrete and continuous data by fully conditional specification. Stat Methods Med Res. 2007;16(3):219‐242. [DOI] [PubMed] [Google Scholar]
- 37. Royston P, Lambert PC. Flexible parametric survival analysis using Stata: beyond the Cox model. College Station, TX: Stata; 2011. [Google Scholar]
- 38. Moons K, Altman DG, Reitsma JB, et al. Transparent Reporting of a multivariable prediction model for Individual Prognosis or Diagnosis (TRIPOD): explanation and elaboration. Ann Intern Med. 2015;162(1):W1‐W73. [DOI] [PubMed] [Google Scholar]
- 39. Royston P, Altman DG. External validation of a Cox prognostic model: principles and methods. BMC Med Res Methodol. 2013;13:33. [DOI] [PMC free article] [PubMed] [Google Scholar]
- 40. Newson RB. Comparing the predictive powers of survival models using Harrell's C or Somers’ D. Stata J. 2010;10(3):339‐358. [Google Scholar]
- 41. Royston P, Sauerbrei W. A new measure of prognostic separation in survival data. Stat Med. 2004;23(5):723‐748. [DOI] [PubMed] [Google Scholar]
- 42. Cammà C, Cabibbo G, Petta S, et al. Cost‐effectiveness of sorafenib treatment in field practice for patients with hepatocellular carcinoma. Hepatology (Baltimore, MD). 2013;57(3):1046‐1054. [DOI] [PubMed] [Google Scholar]
- 43. Parikh ND, Marshall VD, Singal AG, et al. Survival and cost‐effectiveness of sorafenib therapy in advanced hepatocellular carcinoma: an analysis of the SEER‐Medicare database. Hepatology (Baltimore, MD). 2017;65(1):122‐133. [DOI] [PubMed] [Google Scholar]
- 44. Sanoff HK, Chang Y, Lund JL, O'Neil BH, Dusetzina SB. Sorafenib effectiveness in advanced hepatocellular carcinoma. Oncologist. 2016;21(9):1113‐1120. [DOI] [PMC free article] [PubMed] [Google Scholar]
- 45. Adhoute X, Penaranda G, Raoul JL, Bourliere M. Staging of hepatocellular carcinoma: BCLC system, what else! Liver Int. 2016;36(9):1395‐1396. [DOI] [PubMed] [Google Scholar]
- 46. Samawi HH, Sim H‐W, Chan KK, et al. Prognosis of patients with hepatocellular carcinoma treated with sorafenib: a comparison of five models in a large Canadian database. Cancer Med. 2018;7(7):2816–2825. [DOI] [PMC free article] [PubMed] [Google Scholar]
- 47. Endo M, Nishikawa H, Kita R, et al. Comparison of five staging systems in hepatocellular carcinoma treated with sorafenib: A single‐center experience. Mol Clin Oncol. 2016;4(4):515‐522. [DOI] [PMC free article] [PubMed] [Google Scholar]
- 48. Kuo Y‐H, Wang J‐H, Hung C‐H, et al. Albumin‐Bilirubin grade predicts prognosis of HCC patients with sorafenib use. J Gastroenterol Hepatol. 2017;32(12):1975‐1981. [DOI] [PubMed] [Google Scholar]
- 49. Tada T, Kumada T, Toyoda H, et al. Impact of albumin‐bilirubin grade on survival in patients with hepatocellular carcinoma who received sorafenib: an analysis using time‐dependent receiver operating characteristic. J Gastroenterol Hepatol. 2019;34(6):1066-1073. [DOI] [PubMed] [Google Scholar]
- 50. Royston P, Moons KG, Altman DG, Vergouwe Y. Prognosis and prognostic research: developing a prognostic model. BMJ (Clinical Research ed). 2009;338:b604. [DOI] [PubMed] [Google Scholar]
- 51. Heinze G, Wallisch C, Dunkler D. Variable selection ‐ A review and recommendations for the practicing statistician. Biom J. 2018;60(3):431‐449. [DOI] [PMC free article] [PubMed] [Google Scholar]
- 52. Casadei Gardini A, Scarpi E, Faloppi L, et al. Immune inflammation indicators and implication for immune modulation strategies in advanced hepatocellular carcinoma patients receiving sorafenib. Oncotarget. 2016;7(41):67142‐67149. [DOI] [PMC free article] [PubMed] [Google Scholar]
- 53. da Fonseca LG, Barroso‐Sousa R, Bento AdSA, et al. Pre‐treatment neutrophil‐to‐lymphocyte ratio affects survival in patients with advanced hepatocellular carcinoma treated with sorafenib. Med Oncol (Northwood, London, England). 2014;31(11):264. [DOI] [PubMed] [Google Scholar]
- 54. Howell J, Pinato DJ, Ramaswami R, et al. Integration of the cancer‐related inflammatory response as a stratifying biomarker of survival in hepatocellular carcinoma treated with sorafenib. Oncotarget. 2017;8(22):36161‐36170. [DOI] [PMC free article] [PubMed] [Google Scholar]
- 55. Lué A, Serrano MT, Bustamante FJ, et al. Neutrophil‐to‐lymphocyte ratio predicts survival in European patients with hepatocellular carcinoma administered sorafenib. Oncotarget. 2017;8(61):103077‐103086. [DOI] [PMC free article] [PubMed] [Google Scholar]
- 56. Fujiwara N, Nakagawa H, Kudo Y, et al. Sarcopenia, intramuscular fat deposition, and visceral adiposity independently predict the outcomes of hepatocellular carcinoma. J Hepatol. 2015;63(1):131‐140. [DOI] [PubMed] [Google Scholar]
Associated Data
This section collects any data citations, data availability statements, or supplementary materials included in this article.
Supplementary Materials