Abstract
Ovarian cancer is the fifth leading cause of cancer‐related deaths. It causes approximately 125,000 deaths per year worldwide; its diagnosis is made in advanced stages resulting in a high mortality rate. The objective of the study was optimizing the isolation of cells obtained from the solid tumor and ascitic fluid of patients with ovarian cancer and the phenotype with markers related to the epithelial–mesenchymal transition. For this, the solid tumor tissue was disaggregated and cultivated with different methodologies. As a result, cell growth was obtained and epi‐immunofluorescence was performed using antibodies against E‐cadherin, EpCAM, N‐cadherin, vimentin, CD133, and CD44. The primary culture from the solid tumor was obtained using Dispase II and DMEM/F12. Finally, heterogeneity was detected in terms of the expression of mesenchymal and epithelial type markers in the two types of isolated cells. Additionally, CD133 and CD44 expression was detected, proteins associated with the tumor stem cells phenotype.
Keywords: CD133, CD44, epithelial, mesenchymal, ovarian cancer, tumor
The ovarian cancer cells isolated were heterogeneous. This was detected in terms of expression of mesenchymal and epithelial type markers. Additionally, CD133 and CD44 expression was detected, proteins associated with the tumor stem cells phenotype.
1. INTRODUCTION
Ovarian cancer (OC) is one of the leading causes of death of women in the world (Álvarez Pérez et al., 2005), it occupies the sixth cause, and the first for gynecological cancers (Arias, Celso, & Inmaculada, 2013). In 2015, around 255,660 confirmed cases were diagnosed. According to Globocan projections for 2020, around 282,741 new cases will be diagnosed worldwide with a percentage of mortality around 64%. In Colombia, 1,577 new cases of OC were diagnosed in 2015. By 2020, there will be around 1,820 new cases (Globocan, 2017).
The current treatment is a combination therapy of cisplatin plus paclitaxel (American Cancer Society, 2016). The majority of patients are diagnosed at Stages III and IV. These advanced stages have a survival rate at 5 years of <39% of cases for Stage III and <17% for Stage IV (American Cancer Society, 2016). However, some patients develop natural resistance; 75% presented recurrence at 12 months (Gustavo, 2014).
Resistance to treatments has been associated with the presence of ascites fluid (Kwon & Shin, 2013) in which tumor cells can be found forming aggregates or “spheroids”, which are transported from the tumor to the intraperitoneal and retroperitoneal cavities to colonize tissues such as the colon, bladder, liver, pancreas, and lung (Zhang et al., 2008). Additionally, this spread has been linked to the ability of the cancer cell to express proteins related to survival, proliferation, invasion, and metastasis (Latifi et al., 2012). It has been demonstrated that the presence of tumor‐initiating stem cells (CD133+ and CD44+) in ascitic fluid possess great plasticity and cellular differentiation capacity, which confers resistance to chemotherapy and radiotherapy (Kryczek et al., 2012). The expression of CD44 in the tumor cells has been linked to the ability to adhere to mesothelial cells, which allows them to colonize new tissue (Cannistra et al., 1993). This protein has been postulated as a molecular target for treatment based on its proliferative capacity in highly aggressive malignancies (Zhang et al., 2008).
During tumor carcinogenesis, the cell develops a genetic program that allows it to make epithelial–mesenchymal (EMT) and mesenchymal–epithelial (MET) transitions (Radisky, 2005). EMT is characterized by the expression of mesenchymal markers such as vimentin, vitronectin, and N‐cadherin among others as well as increasing the expression of extracellular matrix compounds like collagen IV and fibronectin; at the same time, there is a decrease in epithelial cell markers such as E‐cadherin, occludin, claudin, and cytokeratin, these changes have been associated with poor prognosis, recurrence, and chemoresistance presented by the disease (Turley, Veiseh, Radisky, & Bissell, 2008). The MET and the EMT induce phenotypic variability in ovarian tumor. Expression of claudin‐7 and epithelial phenotype EpCAM have been found concomitant with expressions of vimentin and the N‐cadherin mesenchymal phenotype in the same sample (Dunfield, Shepherd, & Nachtigal, 2002; Strauss et al., 2011).
The study of the cells present in the ovarian tumor has used different methodologies for isolation and “in vitro” cultivation (Dunfield et al., 2002; Geng et al., 2011). Several methods for the primary culture of OC cells in both the ascitic fluid and solid tumor have been described in the literature, but due to the large cell heterogeneity, it has not been possible to standardize a method that allows the cultivation of these cells. Some authors have reported mechanical and enzymatic methods for disintegration or planting of tumor explants in a direct way in the culture box. For ascitic fluid, methodologies such as separation by density gradients or direct sowing cultivation media have been used (Dunfield et al., 2002; Ho, Chang, Hsiao, Chien, & Shih, 2012). The objective of the study was to optimize isolation and establishment of a primary cell culture of ascitic liquid and solid tumor, and subsequent characterization with EpCAM, E‐cadherin for epithelial phenotype and N‐cadherin/vimentin for the mesenchymal phenotype.
2. MATERIALS AND METHODS
With prior authorization from the Ethics Committee of the Hospital San José and according to declaration of Helsinki, the signing of consent for the participants in the study was conducted. Twelve ascitic fluid samples and 12 solid tumor samples were obtained from patients with diagnosis of OC in the Hospital of San José postoperatively. The tumor fragments were taken by the medical staff in sterile conditions in tubes of 50 ml with phosphate‐buffered saline (PBS) 1× supplemented with antibiotic (100 U/ml penicillin and 100 µg/ml streptomycin), and 25 ml of ascitic fluid was recollected. Then, the samples were sent to the genetics laboratory at the Fundación Universitaria de Ciencias de la Salud, and were processed within 2 hr. Tumor tissue was separated into two fragments: one for immunohistochemical analysis and another fragment for cell culture. Samples were transported according to the rules for biological substances transportation.
2.1. Isolation of solid tumor
For isolation of cells from the solid tumor, the tumor fragments received were fragmented into segments of approximately 3 mm3 and subjected to three cell separation processes: two enzymatic processes and one mechanical. The enzymes used were Dispase II and trypsin‐EDTA (ethylenediaminetetraacetic acid).
2.2. Enzymatic and mechanical disaggregation
For the two methods of disaggregation: the tumor fragment was washed several times with PBS 1× until most of the blood was removed. Then, it was cut into pieces of approximately 3 mm3 and was washed three times with PBS 1×. For the enzymatic method, fragments were placed in a beaker with 3 ml of trypsin‐EDTA (Gibco) at 0.25% to 1× or Dispase II by Life Technologies® (1.4 U/ml) for 15 min with magnetic stirring. For the mechanical disaggregation, the fragments were placed in a beaker with 3 ml of PBS 1×, magnetic stirrer at 1,300 rpm and magnetic rod gauge 10 mM at 37°C for 45 min (depending on the tumor material available). The resulting solution of the two methods was transferred to 15 ml tubes, and the culture Dulbecco's modified Eagle medium (DMEM) medium was added, centrifuged at 1,000 rpm for 5 min and the supernatant was removed.
The cell pellets obtained from the methodologies were resuspended and deposited in T25 culture box with 3 ml of different culture media supplemented with 10% of fetal bovine serum (FBS) and incubated at 37°C with 5% CO2.
2.3. Isolation of ascitic fluid
The specimen was collected in sterile conditions in 15 ml tubes. Five milliliters of ascitic fluid were put in 15 ml tubes, 7 ml of red blood cell lysis solution (155 mM sodium bicarbonate, 10 mM ammonium chloride, and 0.1 mM EDTA, pH 7.4) were added and it was incubated for 15 min at 37°C. Then it was centrifuged at 1,000 rpm for 5 min, and the supernatant was removed (three steps were performed to remove most of the red blood cells). The pellet was resuspended and deposited in a T25 culture box where 3 ml of different media supplemented with SFB to 10% were added, and then it was incubated at 37°C with 5% CO2.
2.4. Optimization of the culture medium
For each analyzed tumor, after it was disaggregated by enzymatic processes and mechanical process, the obtained cells were seeded in three culture media to optimize conditions.
The first was the DMEM (Life Technologies) medium supplemented with 10% of SFB (Gibco®). The second medium used was DMEM/F12 (Life Technologies) supplemented with 10% of SFB, which provides additional components such as putrescine, thymidine, hypoxanthine, zinc, and sodium pyruvate, allowing stability in cell growth. The third medium used was DMEM/Glutamax (Life Technologies) supplemented with 10% of SFB and Glutamax, it presents high glucose contents and contains no sodium pyruvate. All cells were seeded in the same conditions to ensure the reproducibility of the results and to facilitate cell growth comparison in every medium.
2.5. Immunofluorescence protocol
The cells were seeded on slides in Petri boxes with culture medium DMEM/F12, for 12 hr to allow adhesion of the cells at 37°C with 5% of CO2. Then, the culture medium was withdrawn, they were washed with PBS 1 × 3 times, and the cells were fixed with paraformaldehyde at 2% for 30 min at 37°C in a humid chamber. They were washed with PBS 1 × 3 times and traces of paraformaldehyde were inactivated with 600 µl of ammonium chloride (NH4Cl) 50 mM for 5 min and washed with PBS 1 × 3 times for 5 min. For cell permeabilization, Saponin G% was added for 10 min. Experiments where cell membrane proteins were determined were not permeabilized.
Subsequently they were washed with PBS 1× for 5 min and were blocked with SFB 10% with PBX 1× for 20 min. Primary antibodies staining was performed for 1 hr at 37°C in a humid chamber.
The primary antibodies used were: Anti CD44 conjugated with fluorescein isothiocyanate (FITC; ab19622, RRID:AB_445023), Vimentin conjugated with Alexa Fluor EPR 3776 (ab154207), Anti‐CA 125 (ab110640, RRID:AB_10858988), N‐cadherin NC 17 (ab82256, RRID:AB_1658498), Anti E‐cadherin (ab15148, RRID:AB_301693), Anti‐EpCAM E144 (ab32392, RRID:AB_732181), Anti CD133 (Millipore) all in 1/200 dilution. Then, they were washed with PBS 1×, for nonconjugated antibodies, the secondary antibody was added for 1 hr at 37°C in a humid chamber and free from light. The following were used as secondary antibodies: Alexa fluor 555 (goat anti‐rabbit ab150078, RRID:AB_2722519) for CA125, Alexa fluor 568 (goat anti‐mouse ab175473) for N‐cadherin, Alexa fluor 555 (goat anti‐rabbit ab150078, RRID:AB_2722519) for E‐cadherin, FITC (rabbit anti‐goat; Millipore) to EpCAM, Alexa fluor 647 (donkey anti‐mouse ab150111) for CD133 at 1/500 dilution. Staining of the nucleus was done with 10 ng/ml of Hoechst 33342 (H3570) for 30 s. All immunofluorescence images were taken with a microscope, Leica 1200.
3. RESULTS
Of the 12 patients who participated in the study, primary cultures of both the solid tumor and ascitic fluid were obtained from seven patients. Of these, four were diagnosed with serous carcinoma, two with serous cystadenocarcinoma, and one with a seromucinous borderline tumor.
The use of trypsin‐EDTA (Gibco) 0.25% at 1× permitted cellular establishment, but on the sixth day, the cells entered a period of nonproliferation, forming vacuoles and later cell death, with a confluence in the culture of 35–50% approximately. These samples were passaged until culture achieved passage four (Figure 1a,b). The mechanical disaggregation allowed the establishment of primary cultures with a slow cell growth in comparison with enzymatic methods, with this method, the amount of cellular detritus increased and viable cells that were grown at Day 6 had growth arrest and formation of vacuoles visible under the light microscope, additionally it was difficult to remove detritus deposits, which interfered with cell growth. When passages were done for these cells, it was not possible to obtain viable cells (Figure 1c).
Figure 1.
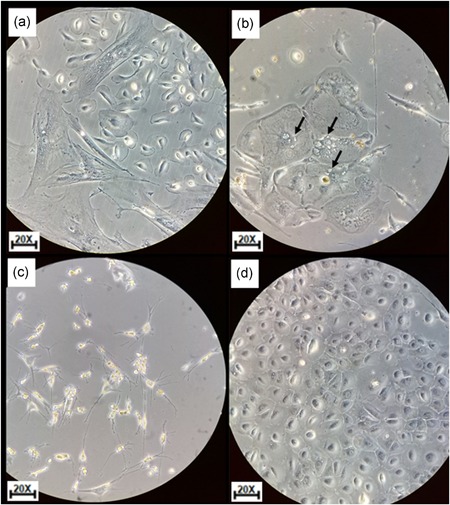
Cell's morphology isolated by different methodologies used in solid tumor cell disaggregation. (a) Enzymatic disaggregation with trypsin at 0.25% at 6th day. (b) Enzymatic disaggregation with trypsin at 0.25% at 10th day. Arrows indicate the forming of vacuoles. (c) Mechanical cell disaggregation; morphology of cell of fibroblasts and accumulations of detritus was observed at 6th day. (d) Enzymatic disaggregation with Dispase II growth in aggregate in the typical epithelial cobblestone morphology (6th day). All photos were taken in objective ×20 in an inverted microscope Leica DM IL [Color figure can be viewed at wileyonlinelibrary.com]
The methodology using Dispase II (1.4 U/ml) permitted the establishment of the primary culture with characteristics of epithelial cells by their growth in the typical epithelial cobblestone morphology, in addition, on the sixth day, cells showed an exponential growth, no changes were observed in the passages done while maintaining their morphological characteristics. These cultures achieved up to eight passages (Figure 1d).
The rate of growth, confluence, and number of passages of isolated cells was observed 6 days after cell culture started, the cells digested with Dispase II had a higher proliferative capacity than cells digested with trypsin and the mechanical method. Six days after culture, the proliferative rate of cells treated with Dispase II was significantly greater with growth in formation of clusters (Figure 2a), at 10 days, a confluence of approximately between 70% and 90% in the form of cluster (Figure 2b), and growth in the typical epithelial cobblestone morphology at 10 days after culture (Figure 2c) were present.
Figure 2.
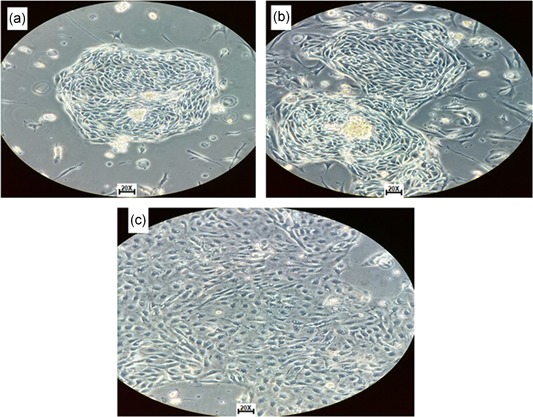
Isolated cells from solid tumor morphology. (a) Cells with epithelial phenotype and raceme‐shaped growth at 6 days after the start of the culture (code number seven). (b) Culture with confluence between 70% and 90% in the form of clusters at 10 days. (c) Cells with confluence between 80% and 95% at 10 days with cobblestone shapes, typical morphology of epithelial tissue of ovary with enzymatic disaggregation with Dispase II (code number eight) [Color figure can be viewed at wileyonlinelibrary.com]
For isolation of cells from ascites fluid, modified methods were used to obtain these cells by the use of red blood cell lysis solution (155 mM sodium bicarbonate, 10 mM ammonium chloride, and 0.1 mM EDTA, pH 7.4), which allowed to efficiently eliminate RBC contamination of ascitic fluid and the establishment of the cell culture (Figure 3a,b).
Figure 3.
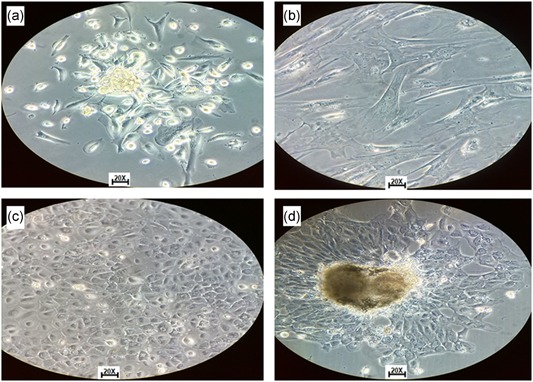
Tumor cells isolated from ascitic fluid and solid tumor. (a) Isolated cells from ascitic fluid with spindle‐shaped growth. (b) Isolated cells from ascites fluid, where cellular variability is observed. (c) Isolated cells from solid tumor in DMEM/F12 medium supplemented with SFB 10%. (d) Isolated cells from ascites liquid in DMEM/F12 medium supplemented with SFB 10%. All photos were taken with inverted microscope objective ×20. DMEM, Dulbecco's modified Eagle medium [Color figure can be viewed at wileyonlinelibrary.com]
With the DMEM medium supplemented with 10% of SFB, we managed to obtain cell growth, but with slow growth of cells with different methods of cell disaggregation, 6‐day cells showed a low proliferative rate and approximately 40% of confluence. With DMEM/Glutamax, cell growth was obtained between 35% and 55% of confluence with different methodologies’ disaggregation. However, with the DMEM/F12 medium supplemented with SFB at 10% the confluence was between 60% and 80% with different methods of disaggregation. The disaggregation with Dispase II and culture DMEM/F12 medium was the best methodology. With this methodology, cell growth with typical epithelial cobblestone morphology was obtained at 6 days in isolated solid tumor cells (Figure 3c) and growth in form of cellular aggregates (Figure 3d).
For the study of the phenotypic characteristics of the isolated cells by epi‐immunofluorescence, we utilized the culture of cells in Petri boxes with slides of Petri boxes for every solid tumor and 8–10 Petri boxes per each ascitic fluid, and the protocol described in Section 2 was followed to ensure the immunophenotyping of these cells, as it was evidenced that cells lose the expression of various proteins in the process of passaging or subcultures.
Then, for the isolation of OC cells in primary culture, they were tested for each of the parameters, which have been linked to cell phenotyping and presence of stem cells. The presence of CD133 in samples obtained from ascites fluid was evidenced, correlating with the presence of spheroids in ascites, also evidenced was the presence of CD44 in cells from ascites fluid and in solid tumor which correlates with MET at the time of colonizing other tissues (Figure 4).
Figure 4.
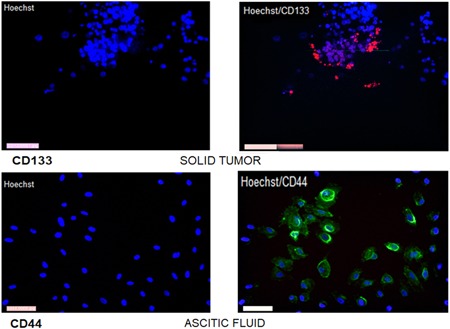
Stem cell markers. Cells isolated from solid tumor with growth in the form of aggregates with marker CD133+ and cells isolated from ascitic fluid were marked with CD44 showing positivity in cultures. The photos were taken with Leica 1200 fluorescence microscope objective ×20 [Color figure can be viewed at wileyonlinelibrary.com]
Cell ensemble obtained from the solid tumor presented positivity in terms of parameters related to the epithelial phenotype such as E‐cadherin and EpCAM. The presence of this protein could be evidenced in the cultures obtained from the solid tumor by immunofluorescence showing a profile of fluorescence characteristic of the membrane for E‐cadherin and EpCAM. As positive control cells, HT29 cells (human colorectal carcinoma epithelial cells) were used (Figure 5a).
Figure 5.
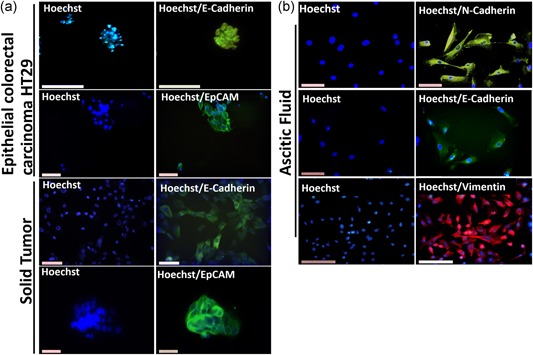
Cell phenotyping. (a) Cells positive for epithelial markers and cells (epithelial colorectal carcinoma HT29) as positive control for E‐cadherin and EpCAM antibodies. (b) Cells isolated from ascites fluid with presence of markers related with EMT (N‐cadherin, E‐cadherin, and vimentin). The photos were taken with a Leica 1200 fluorescence microscope at objective ×20 [Color figure can be viewed at wileyonlinelibrary.com]
The presence of the mesenchymal phenotype‐related parameters was evidenced in the crops grown from the ascitic fluid obtained, by the presence of vimentin and N‐cadherin in these, correlated with the growth forms in spindle shape and positivity of these proteins (Figure 5b). Within the determination of the different markers in cells isolated from ascites fluid, the presence of epithelial markers such as E‐cadherin was evidenced with a profile of decreased immunofluorescence of this cell type for this marker, as their expression decreases, but does not present definite absence, this phenomenon has been correlated with the process of the EMT (Figure 5b).
4. DISCUSSION
The present study describes two types of methods for isolation of cells from patients with OC. The samples taken were of ascites and the solid tumor tissue of patients.
To achieve a better approach to the condition that has cells in tumors of patients, it is desirable to obtain them in the fewest possible steps. Methodologies for obtaining primary cultures of tumor samples have been reported in different studies. For example, Silva et al. (2011) reported a methodology based on the mechanical disaggregation and separation by density gradients for the establishment of primary cultures of samples of ovarian carcinoma in patients with diagnoses at Stages III and IV. Using the method of mechanical disaggregation without separation by gradients in this study presented large accumulation of detritus, which indicates that this method is needed for separation of detritus using gradients.
Ferrandina et al. (2008) used trypsin‐EDTA at 37°C (Sigma‐Aldrich) for 15 min, and collagenase I (1 mg/ml) for 3 hr at 37°C where the obtained primary culture 85% after 12 days of starting the culture for posterior analysis of determining CD133 in ovarian cells. In our study, the disaggregation was conducted with trypsin 0.25% to 1× without collagenase, obtaining cell growth, but with slow proliferation compared with other methodologies, and microscopically observed formation of vacuoles.
The use of enzymatic disaggregation with Dispase II has been reported by several research groups. Among them, Strauss et al. (2011) reported the use of an enzyme solution of Dispase and collagenase (Roche) for 2 hr at 37°C. However, Quirk, Cowan, and Huber (1997), reported obtaining of epithelial cells of the ovarian surface with Dispase and collagenase for 1 hr together with mechanical agitation for 4 min. However, in the present study, the disaggregation with Dispase II (1.4 U/ml; Life Technologies) at 37°C coupled with mechanical agitation for only 15 min was enough to obtain the cells. Disaggregation with Dispase II is the best method for cell disaggregation.
The cells isolated from ascites fluid use different methodologies due to the presence of red blood cells, white blood cells, proteins, enzymes, and different types of cells (Ho et al., 2012; Plancarte, Guillén, Guajardo, & Mayer, 2004). One of the interests in studying cells in ascitic fluid is because the presence of cancer stem cells has been reported, which have been linked to chemoresistance in patients (Ferrandina et al., 2008). For this reason, this study conducted optimization to obtain the primary culture of these cells, the use of red blood cell lysis solution allowed the elimination of the same, and there was evidence of further proliferation in comparison with the direct seeding in culture boxes. This was compared with what was reported by Ho et al. (2012) who performed centrifugation of the liquid at 1,500 rpm for 5 min and then direct sowing with DMEM/F12 medium, supplemented with 10% SFB, EGF, FGF b1 and compared it with planting in medium M199 supplemented with SFB 10%, hydrocortisone, and FBS, where they obtained 85% confluence (Ho et al., 2012). In this study only the elimination of red blood cells permitted the establishment of the primary crop obtaining confluence between 60% and 80% at 6 days of the initial planting.
To obtain the primary cultures, different media were used for each of the conditions of disaggregation to compare which growth medium was optimal for this cell type. Vang et al. (2013) used the medium DMEM with SFB and antibiotic, for cultivation of cell lines (SKOV3, IGROV 1, and 8 OVCAR). Similarly, Geng et al. (2011) report the use of this culture medium for the culture of the cell line A431. The average DMEM supplemented with 10% of SFB managed to get cell growth, with a low proliferative rate in comparison to the other means used.
The DMEM/F12 medium has been used by different authors such as Quirk et al. (1997), who used the DMEM/F12 medium but with addition of different supplements such as transferrin, insulin, hydrocortisone, and the factor of epidermal growth for a confluence of 80% in 11 days. In contrast, in this study, medium DMEM/F12 supplemented with SFB at 10% was used without the addition of growth factors and hormones and managed the establishment of the primary culture. The medium without additives or additional growth factors makes the isolation of cells from patient tumor samples easier and economical.
After the optimization of isolation and cell growth, the epi‐immunofluorescence studies for the previously mentioned markers were conducted, as was the identification of markers associated with epithelial phenotype as E‐cadherin and EpCAM. In this study, the presence of these proteins in different cultures generated from solid tumor is evidenced, approximately 86% (6/7) of the cultures were positive for these markers. Identifying the presence of vimentin and N‐cadherin in these cells with a percentage of 14%, correlated with the EMT processes. The results found in the samples analyzed are consistent with what was reported by several authors for this type of tumor. For example, Strauss et al. (2011) made the characterization of the epithelial–mesenchymal phenotype of 51 biopsies/ascitic fluid in Stages III and IV, and described the heterogeneity and phenotypic plasticity of OC, by means of different E‐cadherin, claudin‐7, EpCAM markers of epithelial phenotype and vimentin, N‐cadherin, and laminin of mesenchymal phenotype. Latifi et al. (2012) analyzed 25 ovarian cell cultures adherents and nonadherent and determined the expression of E‐cadherin, STAT3, Oct 4, and EpCAM in patients with OC and patients with chemoresistant OC.
The determination of proteins related to mesenchymal cells, identified the presence of N‐cadherin and vimentin in cells isolated from ascites fluid, which evidenced the presence these proteins in 80% of the culture obtained from ascites. The presence of vimentin is a crucial marker in mesenchymal cells because it is the protein of intermediate filaments which helps cells supporting the process of EMT (Ivaska, Pallari, Nevo, & Eriksson, 2007). This is also confirmed by Strauss et al. (2011) who showed the presence of markers of mesenchymal cells by the presence of N‐cadherin and vimentin in 51 biopsies/liquid from patients with OC. During the determination of these markers, EpCAM expression was evidenced in cells isolated from ascites fluid and decrease in fluorescence protein E‐cadherin in these same cells, and approximately 20% presented positivity. The presence of markers of the mesenchymal and epithelial type is explained by the EMT that tumor cells have (Kalluri & Weinberg, 2009). For example, Mao et al. (2013), through the insertion of the Twist2 gene in OC cell line SKOV3 detected changes in morphology, motility, invasion, and the expression of molecular markers associated with the EMT. Among them, the decrease of E‐cadherin and the increase in the expression of N‐cadherin and β‐catenin were evidenced (Mao et al., 2013).
This study only evidenced the presence of CD44 and CD133 in samples obtained from ascites fluid correlated with the presence of spheroids or cell aggregates in ascites, these markers were present in between 10% and 20% of the primary cultures. Kryczek et al. (2012), identified stem cells using different markers as CD24, CD44, CD117, and CD133, to correlate them with the tumor biology of OC and their possible application in the design of targeted therapies and showed that these markers play an important role in epithelial OC. Additionally, they correlate with chemoresistance in combination therapy and invasion ability when colonizing new tissue (Kryczek et al., 2012).
5. CONCLUSIONS
For isolation of cells from tumors of patients, the best method of cellular disaggregation found in this study was using the Dispase II enzyme (1.4 U/ml), and planting in the culture medium DMEM/F12 supplemented with SFB. The use of lysis of red blood cells solution in ascitic fluid allowed for obtaining a higher percentage of cells adhering to the culture box. Obtained cells, both in solid tumor and in adcites fluid, presented heterogeneity in terms of markers presence related to mesenchymal and epithelial phenotype.
ACKNOWLEDGMENTS
We thank the Department of Genetics at the University of Health Sciences Foundation and the service of gynecology for their contribution of patient samples. This study was funded by the Fundación Universitaria de Ciencias de la Salud (FUCS).
CONFLICT OF INTERESTS
The authors declare that there are no conflict of interests.
AUTHOR CONTRIBUTIONS
Gutiérrez‐Castañeda Luz Dary: Conception and design, acquisition of data, analysis and interpretation of data, drafting the manuscript, revising it critically for important intellectual content, approval of the version to be published. Tovar‐Parra David: acquisition of data, analysis and interpretation of data, drafting the manuscript, revising it critically for important intellectual content, approval of the version to be published. Quintero Gloria: acquisition of data, analysis and interpretation of data, drafting the manuscript, approval of the version to be published. Amezquita Lorena: acquisition of data, analysis and interpretation of data, drafting the manuscript, approval of the version to be published. Guerrero Carlos: analysis and interpretation of data, approval of the version to be published. Sanabria Daniel: of tumor, revising it critically for important intellectual content, approval of the version to be published.
Gutiérrez‐Castañeda LD, Tovar‐Parra D, Quintero G, Amezquita L, Guerrero C, Sanabria D. Isolation and phenotypic characterization of tumor cells of patients with a diagnosis of ovarian cancer. J Cell Physiol. 2020;235:3320–3328. 10.1002/jcp.29220
DATA AVAILABILITY STATEMENT
The datasets generated and/or analyzed during the current study are not publicly available but are in a physical file in the laboratory and are available from the corresponding author on reasonable request.
References
REFERENCES
- Álvarez Pérez, M. , Ramírez Moreno, I. , López Díaz, A. , Matilla Vicente, A. , Gallego Domínguez, E. , & Alba Conejo, E. (2005). Supervivencia en pacientes con cáncer de ovario, tras nueve años de seguimiento en el registro hospitalario de tumores del Hospital Clínico Universitario de Málaga [citado 15 May 2011], Universidad de Málaga ‐ ESPAÑA.
- Arias, A. , Celso, P. G. , & Inmaculada, G. (2013). El cáncer de ovario en España [PDF file]. Retrieved from https://www.antares-consulting.com/uploads/TPublicaciones/7f2d31d76df8a91846b42da01a74e97d86c392e9.pdf
- American Cancer Society (2016). Cáncer de ovario ¿Qué es el cáncer de ovario? [Internet]. American Cancer Society, 16, 73 Retrieved from https://old.cancer.org/acs/groups/cid/documents/webcontent/002317-pdf.pdf [Google Scholar]
- Cannistra, S. A. , Kansas, G. S. , Niloff, J. , DeFranzo, B. , Kim, Y. , & Ottensmeier, C. (1993). Binding of ovarian cancer cells to peritoneal mesothelium in vitro is partly mediated by CD44H. Cancer Research, 53(16), 3830–3838. http://cancerres.aacrjournals.org/content/53/16/3830.short [PubMed] [Google Scholar]
- Dunfield, L. D. , Shepherd, T. G. , & Nachtigal, M. W. (2002). Primary culture and mRNA analysis of human ovarian cells. Biological Procedures Online, 4(1), 55–61. 10.1251/bpo34 [DOI] [PMC free article] [PubMed] [Google Scholar]
- Ferrandina, G. , Bonanno, G. , Pierelli, L. , Perillo, A. , Procoli, A. , Mariotti, A. , … Scambia, G. (2008). Expression of CD133‐1 and CD133‐2 in ovarian cancer. International Journal of Gynecological Cancer, 18(3), 506–514. 10.1111/j.1525-1438.2007.01056.x [DOI] [PubMed] [Google Scholar]
- Geng, S. , Wang, Q. , Wang, J. , Hu, Z. , Liu, C. , Qiu, J. , & Zeng, W. (2011). Isolation and identification of a distinct side population cancer cells in the human epidermal squamous cancer cell line A431. Archives of Dermatological Research, 303(3), 181–189. 10.1007/s00403-010-1100-1 [DOI] [PubMed] [Google Scholar]
- Globocan . (2017). Estimacion de Incidencia, mortalidad y prevalencia de cancer de ovario [Internet]. Available from http://globocan.iarc.fr/Pages/fact_sheets_population.aspx
- Gustavo, L. (2014). Cáncer de Ovario; guía para pacientes [Internet]. European Society for Medical Oncology, Retrieved from https://www.esmo.org/content/download/10100/201901/file/ES-Cancer-de-Ovario-Guia-para-Pacientes.pdf [Google Scholar]
- Ho, C. M. , Chang, S.‐F. , Hsiao, C. C. , Chien, T. Y. , & Shih, D. T. (2012). Isolation and characterization of stromal progenitor cells from ascites of patients with epithelial ovarian adenocarcinoma. Journal of Biomedical Science, 19(1), 23 10.1186/1423-0127-19-23 [DOI] [PMC free article] [PubMed] [Google Scholar]
- Ivaska, J. , Pallari, H.‐M. , Nevo, J. , & Eriksson, J. E. (2007). Novel functions of vimentin in cell adhesion, migration, and signaling. Experimental Cell Research, 313(10), 2050–2062. 10.1016/j.yexcr.2007.03.040 [DOI] [PubMed] [Google Scholar]
- Kalluri, R. , & Weinberg, R. A. (2009). The basics of epithelial–mesenchymal transition. Journal of Clinical Investigation, 119(6), 1420–1428. 10.1172/JCI39104 [DOI] [PMC free article] [PubMed] [Google Scholar]
- Kryczek, I. , Liu, S. , Roh, M. , Vatan, L. , Szeliga, W. , Wei, S. , … Zou, W. (2012). Expression of aldehyde dehydrogenase and CD133 defines ovarian cancer stem cells. International Journal of Cancer, 130(1), 29–39. 10.1002/ijc.25967 [DOI] [PMC free article] [PubMed] [Google Scholar]
- Kwon, M. J. , & Shin, Y. K. (2013). Regulation of ovarian cancer stem cells or tumor‐initiating cells. International Journal of Molecular Sciences, 14(4), 6624–6648. 10.3390/ijms14046624 [DOI] [PMC free article] [PubMed] [Google Scholar]
- Latifi, A. , Luwor, R. B. , Bilandzic, M. , Nazaretian, S. , Stenvers, K. , Pyman, J. , … Ahmed, N. (2012). Isolation and characterization of tumor cells from the ascites of ovarian cancer patients: Molecular phenotype of chemoresistant ovarian tumors. PLOS One, 7(10), e46858 10.1371/journal.pone.0046858 [DOI] [PMC free article] [PubMed] [Google Scholar]
- Mao, Y. , Xu, J. , Li, Z. , Zhang, N. , Yin, H. , & Liu, Z. (2013). The role of nuclear β‐catenin accumulation in the Twist2‐induced ovarian cancer EMT. PLOS One, 8(11), e78200 10.1371/journal.pone.0078200 [DOI] [PMC free article] [PubMed] [Google Scholar]
- Plancarte, R. , Guillén, M. R. , Guajardo, J. , & Mayer, F. (2004). Ascitis en los pacientes oncológicos: Fisiopatogenia y opciones de tratamiento. Revista de la Sociedad Española del Dolor, 11(3), 156–162. http://scielo.isciii.es/scielo.php?script=sci_arttext&pid=S1134-80462004000300006 [Google Scholar]
- Quirk, S. M. , Cowan, R. G. , & Huber, S. H. (1997). Fas antigen‐mediated apoptosis of ovarian surface epithelial cells. Endocrinology, 138(11), 4558–4566. 10.1210/endo.138.11.5508 [DOI] [PubMed] [Google Scholar]
- Radisky, D. C. (2005). Epithelial‐mesenchymal transition. Journal of Cell Science, 118(19), 4325–4326. 10.1242/jcs.02552 [DOI] [PubMed] [Google Scholar]
- Silva, I. A. , Bai, S. , McLean, K. , Yang, K. , Griffith, K. , Thomas, D. , … Buckanovich, R. J. (2011). Aldehyde dehydrogenase in combination with CD133 defines angiogenic ovarian cancer stem cells that portend poor patient survival. Cancer Research, 71(11), 3991–4001. 10.1158/0008-5472.can-10-3175 [DOI] [PMC free article] [PubMed] [Google Scholar]
- Strauss, R. , Li, Z.‐Y. , Liu, Y. , Beyer, I. , Persson, J. , Sova, P. , … Lieber, A. (2011). Analysis of epithelial and mesenchymal markers in ovarian cancer reveals phenotypic heterogeneity and plasticity. PLOS One, 6(1), e16186 10.1371/journal.pone.0016186 [DOI] [PMC free article] [PubMed] [Google Scholar]
- Turley, E. A. , Veiseh, M. , Radisky, D. C. , & Bissell, M. J. (2008). Mechanisms of disease: Epithelial–mesenchymal transition—does cellular plasticity fuel neoplastic progression? Nature Clinical Practice Oncology, 5(5), 280–290. 10.1038/ncponc1089 [DOI] [PMC free article] [PubMed] [Google Scholar]
- Vang, S. , Wu, H.‐T. , Fischer, A. , Miller, D. H. , MacLaughlan, S. , Douglass, E. , … Brodsky, A. S. (2013). Identification of ovarian cancer metastatic miRNAs. PLOS One, 8(3), e58226 10.1371/journal.pone.0058226 [DOI] [PMC free article] [PubMed] [Google Scholar]
- Zhang, S. , Balch, C. , Chan, M. W. , Lai, H. C. , Matei, D. , Schilder, J. M. , … Nephew, K. P. (2008). Identification and characterization of ovarian cancer‐initiating cells from primary human tumors. Cancer Research, 68(11), 4311–4320. 10.1158/0008-5472.can-08-0364 [DOI] [PMC free article] [PubMed] [Google Scholar]
Associated Data
This section collects any data citations, data availability statements, or supplementary materials included in this article.
Data Availability Statement
The datasets generated and/or analyzed during the current study are not publicly available but are in a physical file in the laboratory and are available from the corresponding author on reasonable request.


