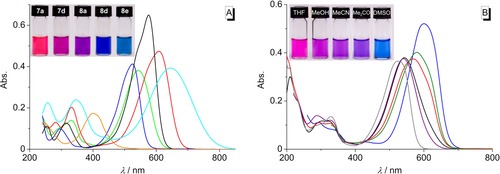
Figure 3.

A: Color (c=50 μm) and absorption spectra (c=10 μm) of the derivatives 2 g (orange), 7 a (blue), 7 d (green), 8 a (black), 8 d (red), and 8 e (cyan) in CHCl3. B: Color (c=20 μm) and absorption spectra (c=10 μm) of derivative 7 d in n‐hexane (gray), THF (purple), MeOH (black), MeCN (red), acetone (olive), and DMSO (blue).
